Recurrent Neural Network based Approach for Early Recognition of Alzheimer’s Disease in EEG. *
Petrosian A.A., +Prokhorov D.V., *Lajara-Nanson W., and *Schiffer R.B. *
Texas Tech University Health Sciences Center, Lubbock, TX + Ford Research Laboratory, Dearborn, MI
Keywords: Alzheimer’s disease, EEG, neural networks, wavelets
Corresponding author: Arthur A. Petrosian, Ph.D., Associate Professor, Texas Tech University Health Sciences Center, Department of Neuropsychiatry, 3601 4th Street, MS 8321 Lubbock, Texas 79430 Phone: (806)743-2495 Fax: (806)743-1668 E-mail:
[email protected]
Recurrent Neural Network based Approach for Early Recognition of Alzheimer’s Disease in EEG.
2
Abstract
Objective: We explored the ability of specifically designed and trained recurrent neural networks (RNNs), combined with wavelet preprocessing, to discriminate between the EEGs of patients with mild Alzheimer’s disease (AD) and their age-matched control subjects. Methods: 2-min. recordings of resting eyes-closed continuous EEGs (as well as their wavelet-filtered subbands) obtained from parieto-occipital channels of ten early AD patients and ten healthy controls were input into RNNs for training and testing purposes. The RNNs were chosen because they can implement extremely nonlinear decision boundaries and possess memory of the state which is crucial for the considered task. Results: The best training/testing results were achieved using a three-layer RNN on left parietal channel level 4 high-pass wavelet subbands. When trained on three AD and three control recordings, the resulting RNN tested well on all remaining controls and five out of seven AD patients. This represented a significantly better than chance performance of about 80% sensitivity at 100% specificity. Conclusion: The suggested combined wavelet/RNN approach may be useful in analyzing long term continuous EEGs for early recognition of AD. This approach should be extended on larger patient populations before its clinical diagnostic value can be established. Further lines of investigation might also require that EEGs be recorded from patients engaged in certain mental (cognitive) activities.
3
Introduction An important goal for clinical research in Alzheimer’s disease is the improvement of diagnostic accuracy, and moving the point of diagnosis earlier within the disease course. With more effective treatment options becoming available, the earlier the detection of AD is made, the sooner intervention can be started. We presently are 86-89% accurate for diagnosis within national center of excellence for patients followed longitudinally to death and autopsy [18,31]. We are less certain about our diagnostic accuracy at time points earlier in the disease course. In an effort to improve these accuracy outcomes many investigators have attempted to extract specific quantitative features from EEG, which would be characteristic for early stages of the disease. Various frequency and complexity techniques, including nonlinear dynamics (chaos) measures, were employed and some progress has been reported [2,5,11,22,29,34,36]. Note, that chaos has been proven only in neural networks in vitro [9] and not yet in scalp recordings. Nevertheless, Pritchard et al. investigated changes of the correlation dimension D2 of the EEG in Alzheimer’s disease [30]. They found in particular that in the eyes-closed state there was no significant difference between AD patients and controls. Other investigators [37] reported significantly lower D2 in late stage AD patients, reflecting less complex signal dynamics in such patients. Relative to frequency analysis, the nature of related EEG changes in AD appears to be well established now: increase in theta and delta; decrease in beta; slowing of the dominant alpha frequency and less reactivity to photic stimulation [2,3,5,15,34,35,41]. The correlation between cognitive decline and decreasing beta activity in dementia of Alzheimer type was studied by Ihl et al [15]. Their findings were supported by Wada et al [41], who reported significantly lower beta frequency power in AD patients accompanied by
4
increased theta activity mainly over parieto-occipital regions. Unfortunately this shift in power from high to low frequencies in the early stages of AD, when clinical diagnosis is most difficult, tends to be mild or even absent. In fact, EEG sensitivity in early mild AD is reported to be between 29% [39] and 42% [35]. Combining linear and nonlinear measures resulted in sensitivity numbers not exceeding 60% [36]. One might expect that the use of latest developed quantitative techniques would improve these sensitivity parameters. Yet, several investigators have found that frequency analysis is not clearly superior to visual analysis in differentiating early AD patients from healthy controls [1,12]. An attempt to make use of alternative signal waveform “descriptive” measures, Hjorth parameters of activity, mobility, and complexity [10,11], was made by Martin-Loeches et al [22]. They reported a remarkable AD/control group separation based upon a single measure - signal mobility. Notably, the greatest differences between AD/control groups were found to be in left parietal regions. However those findings were not replicated in later studies by other investigators. These and other current methodologies while pointing to the existence of certain intrinsic EEG features characteristic for AD, do not provide any means to extract a specific AD signature from EEG. As a result they are not sufficiently reliable to be of use for diagnosing individual patients and there is still a need for new techniques of EEG analysis that can, either alone or in combination with frequency analysis, improve the diagnostic value of the EEG in AD. Therefore in this study we employ sophisticated recurrent neural networks (RNNs) trained on raw EEG data and their wavelet-filtered subbands. These RNNs are capable of detecting subtle linear and nonlinear alterations in the signal. They have demonstrated exceptional signal recognition abilities in our previous studies on epileptic seizure prediction [26,27]. In this study we apply a similar approach on
5
a database of digitized EEGs obtained from 10 patients with relatively mild AD and 10 agematched healthy controls. Both patients and controls underwent mini-mental state examination (MMSE) and clinical dementia rating scale (CDR) [24] to objectively separate the groups and to exclude patients in advanced stages of the disease. The ultimate goal is to develop a reliable classification method that can discriminate between those groups using EEG recordings and commercially available computer hardware.
Methods EEG data acquisition and wavelet decomposition Two groups of early AD patients and controls initially included eleven and twelve subjects accordingly. The Alzheimer’s patients’ (3 females, 8 males) mean ages (±SD) were 72.8 ± 5.4. Their MMSE scores ranged from 18 to 27 with average score of 22.5. The controls’ (5 females, 7 males) mean ages were 69.9 ± 6.0 and MMSE scores were from 27 to 30 with average score of 28.8. All subjects in the Alzheimer’s group met NINCDSADRDA criteria [23] for probable AD. Only one AD patient met criteria for the diagnosis of familial Alzheimer’s disease; the remainder were diagnosed as idiopathic. Other medical conditions known to produce dementia were excluded following neurological and neuroimaging studies. Psychological diagnoses including depression and attention deficit were also ruled out. None of the patients suffered from renal, hepatic or any other condition that could be associated with EEG changes. All patients were asked to sign a consent form that allows the use of electroneural signals obtained for research. The EEGs were recorded using a 9-channel TECA 1121 (Vickers Medical) with scalp electrode placement according to the international 10-20 system - LIO-Fp1 (to monitor eye movements), F3, F4, P3, P4,
6
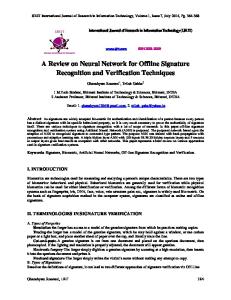
O1, O2, T3, and T4 (all with Cz as a reference). The low/high-pass filters were set at .5 and 60Hz respectively. The A-to-D precision rate was set at 9 bits. An EEG technician was with each subject during the recordings to monitor the subject’s vigilance state and to make sure that the subject did not become drowsy. The digitized at 512Hz EEGs were stored in a host computer system and were transferred to the computational system using an external rewritable optical drive. Records of eyes-closed (awake) continuous EEGs were about 4 min. in length of which approximately 2 min. continuous artifact-free segments were selected and transferred to the computer for network training/testing. Two extracted from left parietal data 4-sec. segments of original EEGs along with their fourth level wavelet detail coefficients are presented in Fig. 1. All paper EEG recordings were visually examined by an expert EEGer to exclude those that contained excess of muscle artifact related irregularities and other artifacts. As a result, two subjects from the control group and one subject from the Alzheimer group were excluded altogether from further consideration. Thus the study was restricted to EEGs of 20 subjects (10 Alzheimer plus 10 controls). Reviewing the paper recordings of these 20 subjects, the EEGer was asked to blindly classify the patients/controls based on visual analysis without prior knowledge of whether a particular recording was of a control or an Alzheimer subject. Only 6 out of 10 Alzheimer and 4 out of 10 controls were correctly identified, thus providing 60% sensitivity at 40% specificity of EEG-only based diagnosis. Note that this visual EEG based classification was done based on reviewing multichannel recordings (unlike the case of RNN training/testing on single channel recordings). The digitized EEGs were first subjected to Fourier power spectra comparative analysis. The single factor ANOVA tests revealed no significant group differences in average Fourier
7
power of EEGs of Alzheimer’s patients vs. controls. Next we designed a bandpass FIR filter using the Hamming window [11,14] and applied it to filter each EEG segment into its four significant subbands – delta (1-4Hz), theta (4-8Hz), alpha (8-13Hz), and beta (13-22Hz). We then performed t-tests (with a confidence level of α=.05) to compare average power in each of those filtered subbands between patients/controls. We found significant differences in beta (p=.02) and theta (p=.03) bands of parietal channels, and in beta (p=.02) and alpha (p=.05) bands of occipital channels (see Fig. 2). It should be noted, however, that we did not conduct tests on “homogeneity” of group variances as we did not aim to present here comprehensive statistical data. Instead, we trained RNNs on each of these subbands separately, which did not yield satisfactory patient/control classification results. We achieved stable network behavior only when extracted from the signal wavelet coefficients were used as inputs into RNNs. More specifically, we achieved the best classification results during training/testing RNNs on 4-th level wavelet detail coefficients of original EEGs. The ability of wavelets to extract and localize specific transient patterns from the signal makes them a natural complement to the application of RNN. We applied the most widely used Daubechies filter "daub4" [4,19] to decompose the original EEG data into its coherent component and “noisy residue”, i.e. the low- and high-pass subbands up to the level 6. This procedure of analyzing a signal by passing it through a filter bank is similar to the wellknown subband coding method [40]. The Daubechies mother wavelet function possesses with a “fractal structure” and has good localizing properties both in time and frequency domains. The pair of low-pass and high-pass filters generated by this function split the original signal spectrum in two equal parts – the low-pass part containing the signal gross structure and the high-pass part containing the detailed components. The low-pass part is
8
then further split into it’s own subbands and this process produces multiresolution wavelet components on subsequent resolution levels. This process of splitting the spectrum is graphically displayed in Fig. 3. Thus, each studied segment of the EEG was wavelet decomposed into multi-level low-pass and high-pass subbands, which were then input into the neural network for training and testing purposes. We demonstrate that this step was necessary for obtaining reliable network behavior.
Recurrent Neural Network Training The Recurrent Neural Networks (RNNs) suggested in this study belong to the wellknown type of discrete-time recurrent multilayer perceptrons [see e.g. 13]. Temporal representation capabilities of these networks can be significantly better than those of purely feedforward multilayer perceptrons or feedforward networks with tapped-delay lines. Unlike other networks, RNNs are capable of representing and encoding strongly hidden states, i.e. states in which a network' s output depends on an arbitrary number of previous inputs. However, despite their advantageous architecture (Fig. 4) the RNNs have not been widely used in practical applications due to the lack of an efficient and universal training method. Recent developments in the use of parameter-based extended Kalman filter (EKF) algorithms in RNN training procedures have proven these architectures to be of great practical value [6,20,32,33]. The EKF method adapts weights of the network in a patternby-pattern fashion accumulating important training information in approximate error covariance matrices and providing individually adjusted updates for each of the network' s weights. We have recently successfully applied this training method [26,27] for predicting
9
onsets of epileptic seizures in intra- and extra-cranial EEGs. The details of the EKF algorithm are presented below in the Appendix. The training of the RNNs was implemented on parieto-occipital channels (P3, P4, O1, O2) using raw EEG signals, as well as each of the derived delta, theta, alpha, beta subbands, and wavelet-decomposed subbands at levels 1-6. We trained one- and two-hidden-layer RNNs with architecture for one-hidden-layer presented in Fig. 4. Each analyzed original EEG segment of about two minutes in length (at 512 Hz sampling rate) contained over 60000 samples in total, which was sufficient data for effective network training (including on all wavelet decomposition levels considered). For each given training/testing signal the input to the network was normalized by subtracting the mean value of the signal and dividing by its standard deviation. The training program then uniformly split the obtained signal into a number of nonoverlapping regions corresponding to the number S of allocated training streams. This number as well as the length L of each stream, or training length, was varied from 10 to 50. Each training stream started from an entry point chosen randomly within a corresponding region of the training set. Before starting actual training of the RNN on L training pairs, we performed priming of the network, i.e. the RNN was fed with a sequence of consecutive samples of length P (priming length) in order to build up its internal states. This priming length was the same for each stream. It was normally proportional to the number of recurrent neurons in the RNN, and we varied P from 5 to 200. After SxP total samples were processed, the first weights’ update was initiated. It was based on the first S training pairs spread over different regions of the whole training set. After the first S pairs had been processed, we proceeded on to the next S pairs. We repeated this updating of weights until the last S pairs in the streams were used. Thus the total
10
number of pairs processed was Sx(P+L), with SxL pairs used for training of weights. Then we chose a new set of S entry points and continued this procedure (including priming) until an acceptable performance was attained. We specified targets for the network’s training by assigning constant values of -1 and +1 to the segments that contained control and Alzheimer data accordingly. In other words, we encoded the control EEG segment and Alzheimer EEG segment with target values of negative and positive constant values respectively. Note, that neurons in the hidden layer (Fig. 4) perform a bipolar sigmoid (y=tanh(0.5x)) transformation on their inputs, which is one of the most common nonlinear transformations for neurons of multilayer perceptrons. We used the same nonlinear transformation for the output neuron too since we dealt in this study with essentially a classification task. Training usually lasted several thousand passes, where one pass corresponded to a complete processing of all S streams. The programs were run on a 450 MHz PentiumII workstation with the largest net and training procedure of 2000 passes in a single experiment lasting for up to 30 hours. The mean-square differences (errors) between the targets and network’s actual output were minimized on the whole training/testing data. These errors usually remained close to their original values (for untrained RNN) during training on most passes, plunging to much smaller values for certain consecutive passes. The network weights obtained on such passes were saved and evaluated based upon percentages of false positives (positive outputs during control data) and false negatives (negative outputs during AD data). Visual analysis by plotting the outputs was also needed for evaluating and comparative analysis of the best networks performance. The best RNNs obtained during training were then tested on other patient/control recordings not used in
11
training. As noted above, these training and testing experiments were repeated across the channels on original, as well as on delta, theta, alpha, beta, and level 1-6 wavelet decomposed subbands. Additional experiments were also carried out on combined low- and high-pass subbands of level 4 and on combined levels 4 and 6 subbands.
Results On the acquired set of 20 recordings we proceeded with experiments in a following manner. We first trained network on one pair and tested on another pair of control/Alzheimer EEG recordings. The results on parietal channel P3 original signals and on their level 1 and level 4 subbands are presented in Fig. 5, 6. We noticed that while training/testing failed on original EEGs as well as on each of the delta, theta, alpha, and beta subbands, the network performed quite reliably on waveletdecomposed level 4 high-pass subbands. This turned out to be a significant observation, which concentrated our attention on this specific subband in all further experiments. The obtained set of weights during training on a single pair of Alzheimer/control data (Fig. 6, upper) however, did not test satisfactorily on the rest of the dataset recordings, which was to be expected. We therefore proceeded on to experiments with training RNN on three pairs of Alzheimer/control recordings by adding two more pairs to the above selected training pair. As it turned out, increasing the training set further to include four and five training pairs did not result in significant improvement of the net performance. Therefore, we present here only the results of experiments carried out with three selected training pairs (3 Alzheimer plus 3 control recordings) and subsequent testing on the remaining seven pairs (7 Alzheimer plus 7 controls). Throughout these experiments we changed the set of training parameters as
12
follows: a) the training length and the number of training streams were varied between 10 and 50; b) the actual net dimensions were changed from one-hidden-layer 1x10rx1 with ten recurrent hidden neurons to two-hidden-layer 1x20rx10rx1 with the total number of recurrent neurons being equal 30; c) the priming length was varied from 5 up to 200; d) the learning rate η(k) and noise factor q(k) (see Appendix) were also interactively controlled through the training procedure. Note, however, that for the latter we followed a specific fixed procedure of adjusting their values from 0.01 to 1.0 for the learning rate and from 0.01 to 10-4 for the noise factor. After each completed training the corresponding best network parameters and weights were saved for testing. The best training/testing results were obtained with a three-layer network on the left parietal channel level 4 high-pass subbands with training and priming lengths equal 50, and the number of training streams equal 10. These results are presented in Fig. 7. As seen in the upper plot of this Figure, the network trained well on all six Alzheimer and control data with the exception of a brief initial positive outburst on the first control data segment. The weights obtained with this training experiment were saved and tested on 14 other Alzheimer and control patients. Given that testing failed only on two rightmost Alzheimer data segments (Fig.7), the network achieved about 80% sensitivity at 100% specificity during the overall training/testing procedure. This represented a significantly better than chance performance [χ2(df=1)=4.98, p<0.05]. Although training with the same network parameters and same combination of patients/controls on occipital channel O2 also produced steadily favorable output (Fig. 8), testing was not as favorable as on channel P3 data. Interestingly however, on channel O2 data, the network performed well on the very same two Alzheimer data segments that did
13
not pass testing on channel P3 (Fig. 7,8). We then decided to carry out experiments with combined training on both channels P3 and O2 – the data from both channels were input into the network training procedure simultaneously. Despite making extensive alterations in training strategy we did not succeed in improving the network performance over the one obtained on the parietal channel only. Likewise, no performance improvement was achieved when training/testing was carried out on deeper subband levels 5 and 6 as well as on combined levels 4 and 6 high-pass subbands.
Discussion The diagnosis of early Alzheimer’s disease (AD) is becoming an increasingly important problem for clinical medicine as new therapies emerge. At present, physicians must rely upon relatively crude clinical markers for these judgments. It is important to improve the sensitivity and specificity for the diagnosis of AD, which are presently both less than 90%, even at university centers. In addition, it is becoming increasingly important to move the diagnosis point earlier in the disease process, so as to confer optimal chances for therapies to be effective. This study represents an attempt to develop a reliable computerized algorithm, which can detect early onset of Alzheimer’s disease using the electroencephalogram (EEG). We applied for that purpose a novel recurrent neural network (RNN) approach, combined with signal wavelet decomposition technique, on continuous EEG recordings during eyesclosed resting condition. While training on EEGs from subjects engaged in mental activity can be seen as a natural continuation of our experiments, it was out of the scope of this study.
14
The suggested combined approach proved to be well suited for analyzing long term EEGs with the specific classification problem. Representing a means for extraction of subtle intrinsic characteristics of the signal, it can be applied to a variety of other similar pattern recognition tasks. We have demonstrated that in this particular Alzheimer/control group separation task, performing suitable signal wavelet decomposition in conjunction with the RNNs is necessary and warranted. On wavelet decomposed level 4 high-pass subbands of original EEGs we were able to obtain a network with a high degree of accuracy in separating the two groups of ten patients each. More precisely, trained on three Alzheimer and three control EEGs the network was able to recognize EEGs of seven other controls and five of seven other Alzheimer patients. Note here that these results, while promising on the considered small sample size, are not yet sufficiently reliable to be of use for diagnosing individual patients. Note also, that a potential difficulty in this study was related to the accuracy of the clinical diagnosis of AD. As mentioned above this accuracy in the best clinics remains under 90% for the routine diagnosis of probable AD. It is therefore possible that not all of the 10 subjects in the Alzheimer’s group actually had AD and that some of the subjects included in the control group might actually have undiagnosed AD. Thus, we realized that this study could not provide perfect answers in terms of sensitivity and specificity of the suggested approach. However, we considered both the patient population size and group classifying procedures as statistically sufficient. Another potentially confounding factor in the subject recruitment process was the use of medications. None of the patients in the study were being treated with benzodiazepines, barbiturates, lithium, hypnotics, antiepileptic drugs, tricyclic antidepressants, phenothiazines
15
or any other agent that is known to produce EEG changes. At the same time, 6 AD patients were being treated with the acetylcohlinesterase inhibitor donepezil. We are unaware of any specific changes on EEG that may be produced by the use of donepezil in humans, although T.M. Itil and colleagues [16] reported a relative increase in alpha activity and a decrease in delta and theta activity with the use of similar cognitive-enhancing agents. Since we observed an opposite shift from signal higher to lower frequencies in AD patients (Fig. 2), a conclusion should be made that the medication use could not have contributed to the results of this study. We would like to emphasize again that the best results were obtained using level 4 highpass wavelet detail components (which overlapped with the signal beta frequency range) of the left parietal channel EEGs. These results support findings of different studies [2,11,15,34,38,41], which centered on alteration in EEG frequency bands and its correlation with cognitive decline in dementia of the Alzheimer type. Particularly, as Claus et al [2] and Wada et al [41] found, the maximal statistical differences were seen mainly in parietooccipital channels’ beta power bands. On the other hand, Martin-Loeches et al. [21] and others [8] observed a steady increase only in theta activity over the left parietal region in moderate AD patients. Contrary to our expectations however, the addition of level 6 highpass subbands (which contained the theta band) into RNN training procedures did not improve the overall network performance. One possible reason for this could have been our use of data obtained only from patients with mild AD. We would like to point out also, that unlike previous studies we input raw EEG and its frequency subbands into a network training procedure without regard for any extracted from signal quantitative features. To the best of our knowledge such an approach has not been
16
attempted before in recognition of AD and we attribute that to extensive computational requirements of the applied algorithm. On the other hand, the suggested approach is flexible enough to be extended on multiple class recognition problems, i.e. separation of three or more groups of patients with different types of dementia of Alzheimer type. Such studies were performed by Iznak et al [17], Signorino et al [34], and Yener et al [43], to classify the groups with AD, senile dementia of Alzheimer type, vascular, and fronto-temporal dementia (FTD). Our approach can be easily extended on such multiple group recognition problems by simply assigning different network output values to each particular group of patients. It is our intention to carry out such a study, which would include along with the FTD and vascular dementia patients, a group of subjects with mild cognitive impairment (MCI) as defined by Petersen et al. [25]. Naturally, we would not restrict ourselves in such studies with parieto-occipital channels only, and the best wavelet decomposition subbands might certainly differ from the ones discovered in this study. The patient populations should also be significantly increased for the validity of the applied algorithm in a multi-class separation problem. In the end, it is important to note that this study represents only a first step in demonstrating feasibility of the suggested RNN training procedure for early recognition of AD. This approach should be extended on a much larger specifically tailored patient population before any conclusion can be made of its clinical diagnostic value. In addition, more data are needed to explore the sensitivity of the proposed method in detecting different stages of the disease, monitoring treatment efficacy, and providing some prognostic measures. These further lines of investigation might require that EEGs be collected from patients engaged in some mental (cognitive) activities. The obtained results, if upheld on a
17
larger patient population data, may lead to a simple, non-invasive, and inexpensive procedure to move the diagnosis point earlier in the disease. This test will be based on simple EEG recording procedures and a computerized RNN based algorithm to detect early onset of AD.
Appendix. Summary of the EKF training algorithm.
The Extended Kalman Filter-based (EKF-based) training is an effective and powerful tool for training recurrent neural networks [6,32]. In essence, the EKF-based training can be viewed as a parameter identification problem for a nonlinear dynamical system (RNN). It adapts the weights of the network in a pattern-by-pattern fashion accumulating important training information in approximate error covariance matrices and providing individually adjusted updates for each of the network’s weights. Below we describe a popular version of the EKF algorithm known as a parameter-based node-decoupled EKF. Let us assume that all weights of the RNN are assembled in a vector W of length M, and that this vector is split in several disjoint groups. We denote Wi as a weight vector of the i-th group of weights. The index i runs from 1 to G, where G is the total number of groups. Thus, we assume that W1∪ W2 ∪ ... ∪ WG = W and dim(W1)+dim(W2)+...+dim(WG) = M. It is required by the EKF method that we compute derivatives of the RNN’s N outputs (rather than more commonly used derivatives of output errors) with respect to the weights [32]. These derivatives are obtained through backpropagation through time or its truncated version [6,42]. We accumulate and store the derivatives in a set of matrices Hi (one matrix per group of weights), where each Hi is of dimension dim(Wi)×N.
18
The EKF-based network training procedure can be described by the following equations: G
A( k ) = (η ( k ) I + ∑ HiT ( k ) Pi ( k ) Hi ( k )) − 1 , −1
i =1
Ki ( k ) = Pi ( k ) Hi ( k ) A( k ) , Wi ( k + 1) = Wi ( k ) + Ki ( k )e( k ) ,
Pi ( k + 1) = Pi ( k ) − K i (k ) H iT ( k ) Pi ( k ) + Qi (k ) ,
where η(k) is a scalar learning rate, Ki(k) is the Kalman gain matrix for the i-th group of weights, e(k) = d(k) - y(k) is the N×1 error vector [d(k) and y(k) are the desired and actual outputs respectively, and eT(k)e(k)/2 forms the mean-square error to be minimized over time]. Further, Pi(k) is the approximate error covariance matrix, dim(Pi(k)) = dim(Wi) × dim(Wi), which models correlations between each pair of weights within the i-th group of weights, and Qi(k) is a positive diagonal matrix that helps to avoid numerical divergence of the procedure and prevents getting stuck in a poor local minimum [32]. Grouping of the weights can be done in a variety of ways. We employed the groupingby-node method, i.e. weights belonging to the same neuron were grouped together. Thus G was equal to the number of neurons. This resulted in a significant reduction of computational complexity and storage requirements as the dimensionality of error covariance matrices Pi was made significantly smaller than M2 (the dimensionality in case of G = 1). The matrices Pi(0) were initialized as diagonal matrices with large enough diagonal elements with values of around 1000. Over the course of training the user-specified values of η(k) and q(k) (diagonal components of Qi(k); same for all neurons) were changed typically from 0.01 to 1.0 and from 0.01 to 10-4, respectively.
19
With large EEG data files, a batch update of weights is advantageous over a pattern-bypattern update since the network learns to simultaneously minimize error on an entire batch of patterns taken from different regions of the data segment. To combine efficiency of the EKF-based training with a batch-like update, without violating a consistency between the weights and the approximate error covariance matrices, we made use of a multi-stream training approach. It was first proposed and tested in [7] and can be described briefly as follows. We assume that there are S data streams. It is then useful to consider S copies of the same RNN (i.e. weights are the same for all the copies). Each copy is assigned to a separate stream. We then apply each copy of the RNN to a training vector drawn from the corresponding stream. We obtain S (N×1)-stream-error-vectors and S sets of matrices Hi. We then concatenate all corresponding Hi to form one Hi of dimension dim(Wi)×(N×S), where N×S is a total number of columns. Concatenating all the stream error vectors results in a single error vector e of dimension (N×S)×1, where N×S is a total number of rows. The number of columns in each of the Kalman gain matrices Ki is increased S times. The global scaling matrix A also grows S times in size in both dimensions. The increase in dimensionality of the A matrix should be of concern, as it must be inverted. However, it has not become a major problem in applying this multi-stream EKF-based procedure to a variety of tasks [20,33]. We have found the singular value decomposition [28] to be the best method for inverting the matrices A(k) of dimensions as high as 100×100. Note that the allocation of data streams can also be done in various ways. It is often impractical to use too short a stream since the total number of streams S can make the A matrix inversion too burdensome. On the other hand, having too few streams may not bring
20
a significant improvement over the one-stream (basic) EKF-based training. The experiments show, that faster training of at least an order of magnitude (in terms of number of passes) and much better generalization can be expected with a multi-stream EKF training as opposed to a one-stream training. This difference grows further with larger training sets, reaching the point when one-stream training is completely inadequate for data sets comprised of tens of thousands of training vectors [20].
Acknowledgments. The authors would like to acknowledge the financial support from Alzheimer’s Disease Research Institute at Texas Tech University Health Sciences Center. This research was partly funded by a grant from the Federal Administration on Aging (#90AM2378). We would also like to thank Rayma Seelow, B.S., and Linda Broom, B.A., for technical assistance in patient recruitment process.
References [1] Brenner RP, Reynolds CF, Ulrich RF. Diagnostic efficacy of computerized spectral versus visual EEG analysis in elderly normal, demented and depressed subjects. Electroencephalography and Clinical Neurophysiology, 1988, Vol. 69, pp. 110-117. [2] Claus JJ, Kwa VIH, Teunisse S, et al. Slowing on quantitative spectral EEG is a marker for rate of subsequent cognitive and functional decline in early Alzheimer disease. Alzheimer Disease Associated Disorders, Vol. 12(3), September 1998, pp. 167-74. [3] Coben LA, Chi D, Snyder AZ, Storandt M. Replication of a study of frequency analysis of the resting awake EEG in mild probable Alzheimer’s disease. Electroencephalography and Clinical Neurophysiology, Vol. 75 (1990), pp. 148-154.
21
[4] Daubechies I. The wavelet transform, time-frequency localization and signal analysis. IEEE Transactions on Information Theory, 1990, Vol. 36, No. 5, pp. 961-1005. [5] Duffy FH, Albert MS, McAnulty G. Brain electrical activity in patients with presenile and senile dementia of the Alzheimer type. Annals of Neurology, Vol. 16(4), 1984, pp. 439448. [6] Feldkamp L, Puskorius G. A Signal Processing Framework Based on Dynamic Neural Networks with Application to Problems in Adaptation, Filtering, and Classification. Proceedings of IEEE, vol. 86, no. 11, 1998, pp. 2259-2277. [7] Feldkamp L, Puskorius G. Training Controllers for Robustness: Multi-Stream DEKF, In Proceedings of the World Congress on Computational Intelligence (WCCI), Orlando, FL, June/July, 1994, pp. 2377-2382. [8] Grusendorf P. EEGs in cognitive stages of Alzheimer’s-type dementia. Journal of Neuroscience Nursing, 1994, Vol. 26(1), pp. 42-46. [9] Hayashi H, Ishizuka S. Chaotic responses of the hippocampal CA3 region to mossy fiber stimulation in vitro. Brain Research, 1995, Vol. 686, pp. 194-206. [10] Hjorth B. EEG analysis based on time domain properties. Electroencephalography and Clinical Neurophysiology, 1970, Vol. 29, pp. 306-310. [11] Holt T, Singleton C, Baker M, Petrosian A. Time-frequency, time-scale, and complexity analyses of EEG for Alzheimer’s disease diagnosis. In: Proceedings of IASTED International Conference on Signal and Image Processing (SIP-2000), November 19-23, 2000, Las Vegas, Nevada, pp.269-274.
22
[12] Hooijer C, Jonker C, Posthuma J, Visser SL. Reliability, validity, and follow-up of the EEG in senile dementia: sequalae of sequential measurement. Electroencephalography and Clinical Neurophysiology, 1990, Vol. 76, pp. 400-412. [13] Hush D, Horne B. Progress in supervised neural networks. IEEE Signal Processing Magazine., 1993, Vol. 10(1), pp. 8-39. [14] Ifeachor CE, Jervis WB. Digital signal processing: a practical approach. AddisonWesley, Reading, MA, 1993. [15] Ihl R, Dierks T, Martin E-M, Frolich L, Maurer K. Topography of the maximum of the amplitude of EEG frequency bands in dementia of the Alzheimer type. Biological Psychiatry, Vol. 39, 1996, pp. 319-325. [16] Itil TM, Eralp E, Ahmed I, Kunitz A, Itil KZ. The pharmacological effects of ginkgo biloba, a plant extract, on the brain of dementia patients in comparison with tacrine. Psychopharmacol. Bull., Vol. 34(3), 1998, pp. 391-7. [17] Iznak AF, Gavrilova SI, Zhigulskaya SE, et al. Quantitative EEG in early and differential diagnosis of mild dementia of different genesis. Vestnik Ross. Akad. Med. Nauk, 1999, Vol. 1, pp. 11-16 (in Russian). [18] Klatka LA, Schiffer RB, Powers JM, Kazee AM. Incorrect diagnosis of Alzheimer’s disease: a clinico-pathologic study. Archives of Neurology, Vol. 53, 1996, pp. 35-42. [19] Mallat S. A theory for multiresolution signal decomposition: The wavelet representation. IEEE Transactions on Pattern Analysis and Machine Intelligence, 1989, Vol. 11, No. 7, pp. 674-693. [20] Marko K, James J, Feldkamp T, Puskorius G, Feldkamp L, Prokhorov D. Training recurrent networks for classification: realization of automotive engine diagnostics. In
23
Proceedings of the World Congress on Neural Networks (WCNN), San Diego, CA, Sept. 1996, pp. 845-850. [21] Martin-Loeches M, Gill P, Rubia FJ. Two-Hz wide EEG bands in Alzheimer’s disease. Biological Psychiatry, 1993, Vol. 33, pp. 153-159. [22] Martin-Loeches M, Garcia-Trapero J, Gil P, Rubia FJ. Topography of mobility and complexity parameters of the EEG in Alzheimer' s disease. Biological Psychiatry, Vol. 30, 1991, pp. 1111-1121. [23] McKhann G, Drachman D, Folstein M, Katzman R, Price D, Stadlan E. Clinical diagnosis of Alzheimer' s disease: Report of the NINCDS-ADRDA work group under the auspices of the Department of Health and Human Services Task Force on Alzheimer' s Disease. Neurology, 1984, 34:939-944. [24] Morris JC, Edland S, Clark C, et al. The consortium to establish a registry for Alzheimer’s disease (CERAD). Part IV. Rates of cognitive change in the longitudinal assessment of probable Alzheimer’s disease. Neurology, 1993, Vol. 43, pp. 2457-65. [25] Petersen RC, Smith GE, Waring SC, et al. Mild cognitive impairment: Clinical characterization and outcome. Archives of Neurology., 1999, Vol. 56, pp. 303-308. [26] Petrosian A, Prokhorov D, Homan R, Dasheiff R, Wunsch D. Recurrent neural network based prediction of epileptic seizures in intra- and extracranial EEG. Neurocomputing, Vol (30)1-4, 2000, pp. 201-218. [27] Petrosian A, Homan R, Prokhorov D, Wunsch D. Classification of epileptic EEG using neural network and wavelet transform. SPIE Proceedings on Wavelet Applications in Signal and Image Processing, Vol. 2825, 1996, pp. 834-843.
24
[28] Press WH, Teukolsky SA, Vetterling WT, Flannery BP. Numerical Recipes in C: The Art of Scientific Computing. 2nd ed., New York: Cambridge University Press, 1992. [29] Pritchard WS, Duke DW, Coburn KL, Moore N.C, Tucker KA, Jann MW, Hostetler RM. EEG-based, neural-net predictive classification of Alzheimer’s disease versus control subjects is augmented by non-linear EEG measures. Electroencephalography and Clinical Neurophysiology, Vol. 91 (1994), pp. 118-130. [30] Pritchard WS, Duke DW, Coburn KL. Altered EEG dynamical responsivity associated with normal aging and probable Alzheimer’s disease. Dementia, 1991, Vol. 2, pp. 102-105. [31] Schiffer RB, Stewart J, Podgorski C, Papka M. Trends in the diagnosis of Alzheimer’s disease 1983-1997; Delay time in progress (Unpublished data). [32] Puskorius G, Feldkamp L. Neurocontrol of nonlinear dynamical systems with Kalman filter trained recurrent networks. IEEE Transactions on Neural Networks, 1994, Vol. 5, No. 2, pp. 279-290. [33] Saad E, Prokhorov D, Wunsch D. Comparative study of stock trend prediction using time delay, recurrent and probabilistic neural networks. IEEE Transactions on Neural Networks, 1998, Vol. 9, No. 6, pp. 1456-1470. [34] Signorino M, Pucci E, Belardinelli N, Nolfe G, Angeleri F. EEG spectral analysis in vascular and Alzheimer dementia. Electroencephalography and Clinical Neurophysiology, Vol. 94 (1995), pp. 313-325. [35] Soininen H, Partanen J, Laulumaa V, Helkala E-L, Laakso M, Riekkinen PJ. Longitudinal EEG spectral analysis in early stage of Alzheimer’s disease. Electroencephalography and Clinical Neurophysiology, 1989, Vol.72, pp. 290-297.
25
[36] Stam CJ, Jelles B, Achtereekte HAM, Van Birgelen JH, Slaets JPJ. Diagnostic usefulness of linear and nonlinear quantitative EEG analysis in Alzheimer’s disease. Clinical Electroencephalography, Vol. 27(2), April, 1996, pp. 69-77. [37] Stam CJ, Tavy DLJ, Jelles B, Achtereekte HAM, Slaets JPJ, Keunen RWM. Non-linear dynamical analysis of multichannel EEG : clinical applications in dementia and Parkinson’s disease. Brain Topography, 1994, Vol. 7, pp. 141-150. [38] Stevens A, Kircher T. Cognitive decline unlike normal aging is associated with alterations of EEG temporo-spatial characteristics. European Archives of Psychiatry and Clinical Neuroscience, 1998, Vol 248, pp. 259-266. [39] Szelies B, Grond M, Herholz K, Kessler J, Wullen T, Heiss WD. Quantitative EEG mapping and PET in Alzheimer’s disease. Journal of Neurological Sciences, 1992, pp. 4656. [40] Vetterli M, Herley C. Wavelets and filter banks: Theory and design. IEEE Transactions on Signal Processing, 1992, Vol. 40(9), pp. 2207-32. [41] Wada Y, Nanbu Y, Jian Z-Y, et al. Electroencephalographic abnormalities in patients with presenile dementia of Alzheimer type: quantitative analysis at rest and during photic stimulation. Biological Psychiatry, Vol. 41, 1997, pp. 217-225. [42] Werbos P. Backpropagation Through Time: What It Is and How To Do It. Proceedings of IEEE, 1990, vol. 78, no. 10, pp. 1550-1560. [43] Yener GG, Leuchter AF, Jenden D, et al. Quantitative EEG in frontotemporal dementia. Clinical Electroencephalography, 1996, Vol. 27(2), pp. 61-68.
26
100
50
0
0
100
0
200
400
600
800
1000
1200
1400
1600
1800
2000
50
100
50
0
0
100
0
200
400
600
800
1000
1200
1400
Fig.1
27
1600
1800
2000
50
0
50
100
0
50
100
0.4
control patient
*
0.3
*
*
* *
0.2
*
*
*
O1
O2
0.1
0.0
P3
P4
O1
Delta
O2
P3
P4
O1
O2
Theta
P3
P4
O1
Alpha
Fig. 2.
28
O2
P3
P4
Beta
Original Signal Level 1
Low-pass subband High-pass subband
Level 2
Low-pass High-pass
…
…
…
Fig. 3
29
Output
Hidden layer of fully recurrent nodes
Z-1
Z-1
Z -1 Input
Fig. 4
30
1
0
1 0
2 10
0
2 10
4
4 10
4
6 10
4
8 10
4
1 10
5
1.2
10
1.2
10
5
1
0
1
4
4 10
4
6 10
4
8 10
Fig. 5
31
4
1 10
5
5
1
0
1 0
1000
2000
3000
4000
5000
6000
7000
0
1000
2000
3000
4000
5000
6000
7000
1
0
1
Fig. 6
32
1
0
1 0
4 1 .10
5000
1.5 .10
4
4 2 .10
1
0
1 0
1 .10
4
2 .10
3 .10
4
Fig. 7
33
4
4 .10
4
4 5 .10
0
0
4 1 .10
5000
4 1.5 .10
2 .10
4
0
0
1 .10
4
2 .10
3 .10
4
Fig. 8
34
4
4 .10
4
4 5 .10
Figure Legends.
Fig 1. Two 4-second segments of left parietal EEGs obtained from an Alzheimer (above) and control (below) patients and their forth-level wavelet detail coefficients (on the right).
Fig. 2. Averages and standard deviations of power in delta, theta, alpha, and beta frequency bands in parieto-occipital channels P3, P4, O1, and O2. All significant differences (with p-values of .02 for beta, .03 for theta, and .05 for alpha bands) between Alzheimer patients and controls are marked with an asterisk.
Fig. 3. Signal wavelet decomposition.
Fig. 4. A sample of RNN architecture, also known as the Recurrent Multilayer Perceptron. This network typically consists of a linear input layer, one or several hidden layers, and an output layer. Neurons of each hidden layer are fully recurrent. It means that each neuron is fed by outputs of all neurons of the same layer taken from the previous time step. The neuron is also fed by feedforward (nondelayed) outputs of the preceding hidden (or input) layer. All the connections have a unique adjustable weight, and an adjustment of all weights constitutes the network’s training process. Neurons in the hidden layer and the output neuron perform a nonlinear bipolar sigmoid transformation on their inputs.
Fig. 5. Training (upper) and testing (lower) on original EEGs. The solid line is the actual network output. The desired network output (dashed line) is negative up to the middle of the segment (about 2 min. of control data) and positive thereafter (about 2 min. of Alzheimer data).
35
Fig. 6. Training (upper) and testing (lower) on level 4 high-pass subbands. The network quite strictly followed the desired output (negative on two control segments, positive on two Alzheimer’s) both during training and more importantly during testing.
Fig. 7. Training on three controls and three Alzheimer patients (upper) and testing on the remaining seven controls and seven Alzheimer patients (lower, all data from left parietal channel P3). The network tested well on all controls and all but two rightmost segments of Alzheimer data.
Fig. 8. Training (upper) and testing (lower) on data from right occipital channel O2 of same controls and Alzheimer patients as in Fig. 7. The network trained well but failed on four controls and two Alzheimer recordings during testing. Yet it tested well on the same two rightmost Alzheimer segments that did not pass testing in experiments with left parietal channel data (Fig. 7).
36
37