Real-Time Detection of Malware Downloads via Large-Scale URL→File→Machine Graph Mining Babak Rahbarinia
Marco Balduzzi
Roberto Perdisci
Auburn University at Trend Micro Research, Italy University of Georgia Montgomery
[email protected] Athens, GA 30602, USA Montgomery, AL 36117, USA
[email protected] [email protected]
ABSTRACT In this paper we propose Mastino, a novel defense system to detect malware download events. A download event is a 3-tuple that identifies the action of downloading a file from a URL that was triggered by a client (machine). Mastino utilizes global situation awareness and continuously monitors various network- and system-level events of the clients’ machines across the Internet and provides real time classification of both files and URLs to the clients upon submission of a new, unknown file or URL to the system. To enable detection of the download events, Mastino builds a large download graph that captures the subtle relationships among the entities of download events, i.e. files, URLs, and machines. We implemented a prototype version of Mastino and evaluated it in a large-scale real-world deployment. Our experimental evaluation shows that Mastino can accurately classify malware download events with an average of 95.5% true positive (TP), while incurring less than 0.5% false positives (FP). In addition, we show the Mastino can classify a new download event as either benign or malware in just a fraction of a second, and is therefore suitable as a real time defense system.
Keywords Graph Mining; Malware Detection; Machine Learning
1.
INTRODUCTION
Remote malware downloads, e.g., via drive-by exploits, social engineering attacks, second-stage malware drops, etc., currently represent one of the most effective infection vectors. Unfortunately, existing defenses that aim to prevent malware downloads, such as anti-virus engines (AVs) and URL blacklists, are only partially effective because they tend to lag behind the latest threats, thus leaving users exposed to new malware infections [17]. For instance, AVs are notoriously ineffective against malware code obfuscation [11], whereas URL blacklists can often be circumvented by disPermission to make digital or hard copies of all or part of this work for personal or classroom use is granted without fee provided that copies are not made or distributed for profit or commercial advantage and that copies bear this notice and the full citation on the first page. Copyrights for components of this work owned by others than ACM must be honored. Abstracting with credit is permitted. To copy otherwise, or republish, to post on servers or to redistribute to lists, requires prior specific permission and/or a fee. Request permissions from
[email protected].
ASIA CCS ’16, May 30-June 03, 2016, Xi’an, China c 2016 ACM. ISBN 978-1-4503-4233-9/16/05. . . $15.00
DOI: http://dx.doi.org/10.1145/2897845.2897918
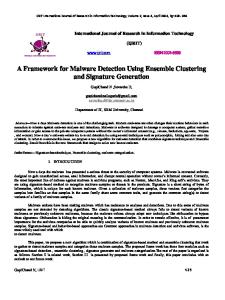
tributing malware downloads from frequently changing domains [9]. In this paper we present Mastino, a novel system for accurate real-time detection of malware download events. Our system aims to detect malware downloads by reasoning about who is downloading what, and from where, rather than trying to classify the content of the single downloaded files or the specific download URLs in isolation. To this end, we target a real-world deployment scenario in which a large number of machines (in the order of hundreds of thousands) run a download identification agent (DIA) capable of identifying new executable file download events. Each DIA sends information about new download events to our detection system, and temporarily quarantines the file, thus preventing the operating system from opening or executing a file until a decision is received regarding its nature, as shown in Figure 1. If Mastino classifies the file as benign, the DIA will allow the downloaded file to run; otherwise, the file can be permanently blocked or removed. Based on the download events reported by hundreds of thousands of machines, our system maintains a large tripartite graph of historic download events (Figure 2), in which nodes represent either a machine, a downloaded file, or the download URL, and edges between nodes express who (i.e., what machine) downloaded what file and from what URL. This tripartite graph is further augmented by annotating nodes with intrinsic features that pertain to each separate node (e.g., file nodes contain information about whether the downloaded file is packed, carries a valid signature, etc.). We then cast the problem of accurately detecting new malicious file downloads as an inference problem over this annotated tripartite graph. In essence, Mastino leverages largescale situation awareness about web-based software download events to more accurately detect future malware downloads. To achieve high detection accuracy, Mastino combines knowledge derived from historic relationships between machines, files, and URLs, with both system- and networklevel properties of each download event. This is in contrast with previous works, which attempt to detect malware downloads based primarily on features derived from network traffic [12, 19, 22] or that only consider the “relationships” between machines and files [8]. In addition, unlike [19], our system is not limited to detecting browser-initiated malware downloads (e.g., via drive-by and social engineering attacks), and instead aims to detect any malware download, including malware updates, second-stage malware drops, pay-per-
install malware downloads, etc. (differences with previous work are discussed in detail in Section 7). For instance, given a machine m that downloads an executable file f from a URL u, Mastino takes into account features such as the name and hash of the process running on m that initiated the download, the name of the downloaded file as it was first saved on disk, whether or not m had been previously infected, etc. These system-level features are further combined with file-based information, such as whether f is believed to be packed/obfuscated (as determined by the download identification agent), whether the file carries a valid digital signature, its lifetime (i.e., when was the file first observed by any of the agents), etc., along with networklevel features about the source URL (e.g., the “age” of the download domain, its effective second-level domain, etc.). In Section 5.4, we show that combining both system-level and network-level features significantly improves detection accuracy. In summary, we make the following contributions: • We present Mastino, a novel system for accurate realtime detection of web-based malware download events. Mastino leverages large-scale situation awareness about web-based software download events, and casts the problem of detecting new malware downloads as an inference problem over large URL→file→machine relationship graphs. • Unlike previous work, Mastino combines both systemand network-level information related to executable file downloads, allowing us to more accurately detect future malware downloads. In addition, the classification of new download events can be performed in only a fraction of a seconds, thus enabling real-time malware detection. • We evaluate Mastino over data collected from a realworld deployment across hundreds of thousands of enduser machines globally distributed across the Internet. We show that our system is able to classify new malware download events with a true positive (TP) rate of 95.5% at less than 0.5% false positives (FP).
2.
OVERVIEW
Problem Definition. Let m be a user’s machine that at time t downloads an executable file f from a remote download URL u. Our main goal is to concurrently classify f and u to determine in real time whether they are likely malicious. In other words, we aim to proactively detect malware download events, so that malware files can be immediately quarantined (or removed) to prevent their execution on the download client system. Approach. Our approach leverages large-scale situation awareness to accurately detect new malware download events in real time. We continuously monitor system and network events on a large number (hundreds of thousands, in our current deployment) of client machines scattered across the Internet, as shown in Figure 1. Each client runs a download identification agent (DIA), whose main responsibility is to recognize when an executable file download has occurred and report detailed information about this event to a centralized malware download detection (MDD) system. MDD collects information about executable file download events from all participating clients, automatically updates its malware download detection models, and responds to download classification requests from the clients.
U
Executable file download servers Clients that run Download Identification Agent (DIA)
F
M Classification Request
Malware Download Detector (MDD)
Download events information
- Global situation awareness - Build/update annotated graphs - Learn malware detection models - Classify file downloads
Figure 1: Mastino – approach overview.
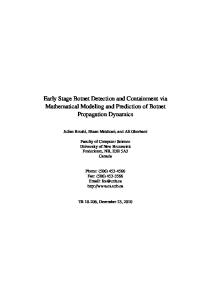
Malware Download Detection System (MDD). In this paper, we focus on designing and implementing the centralized malware download detection system (depicted in Figure 1) so that it can accurately classify malware download events, and respond to download classification requests from clients with minimal response latency. Every time a client downloads an executable file, the DIA agent on the client reports information about the event to the malware download detection system, including the full URL from which the file was downloaded and detailed information about the downloaded file, such as whether the file is likely packed/obfuscated, carries a valid signature and size. DIA also collects system-level information about the machine that downloaded the file, including information such as the name and hash of the client process that initiated the download, the destination name with which the downloaded file is stored on disk, etc. MDD uses the download events information reported by the DIA agents to build an annotated download graph (see simplified example in Figure 2). Essentially, this download graph is a directed tripartite graph, G(U, F, M, EU,F , EF,M , EU,M ), where nodes in set U represent URLs, nodes in F are files uniquely identified by their SHA1 hash, and set M includes all participating machines, which are identified by an anonymized global unique identifier (GUID) generated by the DIA agent. A URL u is connected to a file f with a directed edge (u → f ) if f was downloaded from u. Similarly, a file f is connected to a machine m with a directed edge (f → m), if f was downloaded by m. Finally, a URL u is connected to a machine m with an edge (u → m) if m downloaded an executable file from u (notice that Figure 2 does not show (u → m) edges for simplicity). Each node is annotated with intrinsic node information. For example, each file node f ∈ F includes information about whether f is likely packed/obfuscated, if it carries a valid digital signature, its file size, file name etc. Similarly, a URL node u ∈ U includes information such as IP, the fully qualified domain name (FQD) and effective second level domain (e2LD) of the domain portion of u, path and query string components of u, and the “age” of URL, FQD, and e2LD. Machine nodes carry information related to their malware infection history, the processes that initiated the file downloads on the machines, and etc. MDD maintains historic snapshots of the download graph, in which known benign and malicious files and URLs are labeled accordingly (e.g., by leveraging existing blacklists, whitelists, and multiple AV engines). This historic information is used to build a statistical classifier, which is responsible to satisfy classification requests from the DIAs. For
...
U - File's SHA1 - File size
- Is the code likely obfuscated? - Does it carry a valid signature? - ...
- Complete URL string
- query string - effective 2LD - IP info - ...
F To be classified Benign
- Global unique ID (GUID)
- Past download behavior - Process that downloaded file - Geo-location - ...
...
M
Malicious
Figure 2: Example representation of an annotated download graph. Note that edges between URLs and machines are not shown, for simplicity. instance, let d0 = (u0 , f 0 , m0 ) be a new download event tuple (i.e., a new URL, file, and machine GUID) reported by one of the participating DIAs to the MDD. The MDD system first updates the most recent available graph snapshot by adding the new download event nodes and related edges. MDD uses this updated graph to concurrently classify u0 and f 0 (the URL and file nodes) as either malicious or benign. If either the URL u0 or the file f 0 is classified as malicious, the related entire download event is classified as malware and the classification result is forwarded to the requesting DIA, as shown in Figure 3 (see Section 3 for details). Non-Goals and Assumptions. The design of the download identification agent (DIA) is outside the scope of this paper. We assume that the DIA is capable of accurately detecting executable file download events, and can collect the related network- and system-level information (including file download path on disk, downloading process information, downloading URL, etc.). In addition, we assume that (i) the DIA is capable of quarantining the downloaded files, preventing their execution until a classification response is received from our MDD system; (ii) DIA and MDD can authenticate each other; and that (iii) the integrity and confidentiality of the communication between each deployed DIA and the MDD are protected (e.g., via TLS). We believe these assumptions are reasonable, because most technical challenges related to DIAs have already been successfully addressed by a large body of work in both the anti-malware industry and academia. Privacy Considerations. To perform this study we collect data from hundreds of thousands of real-world clients that run a DIA developed by a leading anti-malware vendor. It is important to notice that the data is collected only from clients who voluntarily agree to share information about file download events. In addition, the data is provided to us in a fully anonymized form, whereby machine identifiers and other potentially sensitive information (e.g., the download path on file-system) are scrambled – via appropriate cryptographic primitives. Data privacy is further protected via mutual non-disclosure agreements.
3.
SYSTEM DETAILS
In this section, we describe in details how Mastino’s Malware Download Detection (MDD) module works.
3.1
Graph Node Labeling and Reputations
Each node in the tripartite download graph is assigned a reputation score. These reputation scores are utilized to perform inference-based detection of unknown files and URLs based on the associations among the download event enti-
download server file
download classification request DIA
MDD classification requests queue
update download graph
classify new download URL and file
client classification results
Figure 3: High-level overview of classification process.
ties in the graph. Specifically, we define a badness reputation score, R ∈ [0, 1] where 1 means maximum badness, 0 means maximum goodness, and 0.5 means unknown node (details in Section 4.1). If a node’s R is above a badness threshold, the node will be labeled as known bad, while if the reputation is below a certain threshold, the node will be labeled as known good. In all other cases the node will be labeled as unknown. To calculate and assign the badness reputation score R to nodes in the tripartite graph, we leverage a combination of public and private information for files and URLs, such as files’ AV labels, URL blacklists and list of top Alexa domains. A machine node’s R is calculated based on its download history, system-level information, and R of its neighbors in the graph, since no black or whitelist of machines is available. In Section 4.1, we explain in details how file, URL, and machine nodes in each layer of the graph receive their R scores and labels. Note that due to our large-scale deployment and incompleteness of the black- and whitelists, it is highly challenging to label all nodes, so the majority of the nodes will remain unknown, and it will be Mastino’s responsibility to accurately classify these nodes.
3.2
Behavioral Graph-based Classifier
We use statistical classifiers that harness behavioral patterns among the nodes in the graph as well as the partially available ground truth from known nodes to detect malware file downloads and malicious URLs. Specifically, Mastino’s classification system consists of two classifiers, one dedicated to distinguishing between malicious and benign URLs, and another dedicated to detecting malicious downloaded files. The output of these two classifiers is then reconciled as follows: if either the URL or the downloaded file is classified as malicious, then the entire download event is deemed as a malware download. The classifiers in each layer receive as input a statistical feature vector for a to-be-classified node, n, and output a badness score. The badness score is checked against an automatically learned detection threshold to label n. Each layer’s classifier uses a set of statistical features
to enable the detection. The classifier features in each layer could be divided into two groups. A set of behavior-based features and a set of intrinsic features. Behavioral-based features are the ones that describe the goodness or badness of related nodes connected to a to-be-classified node. These features can only be computed by using the graph nodes and edges. The intrinsic features, in contrast, are the features that could be computed without the graph (e.g., a file’s size).
3.2.1
Intrinsic Features
For files, their node-specific information (see Section 2 and annotated nodes in Figure 2) in the tripartite download graph is used as intrinsic features. For example, the lifetime and prevalence of files are two of the intrinsic features. Intuitively, files that have been downloaded by many users and were constantly observed by DIA for long periods of times are most likely benign software. In contrast, malwares usually have shorter lifetimes and are downloaded by fewer users, especially, if one considers the impact of packing/obfuscating malware binaries. Additionally, features about if files are packed and if they have a valid signature are also useful. The intuition here is that malwares are often packed to remain undetected by AVs. For URLs, we consider the age or recency of the URL itself and its FQD and e2LD as intrinsic features. Generally, newly registered domains or not-so-popular URLs and domains are more likely associated with malicious content. Table 1 reports the full list of intrinsic features for files and URLs and the intuition behind them. Note that we don’t have a classifier for the machines layer; however, we use machines as a support layer in our graph to compute the behavior-based features for the other two layers. In the following section, we describe the behaviorbased features and explain the role of machines in measuring the features.
3.2.2
Behavior-based Features
The behavior-based features for nodes in a layer of the download graph, e.g. URLs, are computed based on the badness reputation, R, of nodes in the other two layers, e.g. files and machines. This means that all the neighbors of an unknown node n have some say in determining the reputation of n. Intuitively, if an unknown file f , for example, is downloaded from domains where majority of them hosted malware in the past, and/or from URLs with a specific path component that is associated with malicious file downloads, and/or by vulnerable machines with high R, then it is more likely that f is itself malicious. URLs Behavior-based Features. To compute these features for a URL, u, we first find the set of all files and machines in the graph that are connected to u. Let Fu = {f1 , f2 , . . . , fh } and Mu = {m1 , m2 , . . . , mk } be sets of files and machines nodes connected to u, respectively. Then we compute min, max, average, median, and standard deviation of the following: 1) reputation, R, of all fi ∈ Fu , 2) reputation, R, of all mi ∈ Mu , and 3) number of AVs that labeled each fi ∈ Fu . These numbers are used as features of u. In essence, these statistics highlight the true nature of the neighbors of u. Intuitively, if u’s neighbors have high badness reputation, it is more likely that u itself has a high badness reputation as well. Conversely, if on average, neighbors of u are benign nodes (i.e. clean machines and benign files), then it is likely that u itself is a benign domain.
However direct neighbors of a single URL in the tripartite graph, might not give us enough information. To gather more evidence about u (the URL we want to compute its features), we consider its components, such as FQD, e2LD, path, etc. Then we find a set of URLs, Cu , that have at least a component in common with u. Finally, we gather larger sets of files, Fu0 , and machines, Mu0 , that are connected to URLs in Cu and use them to expand features of u in a similar fashion as nodes in Fu and Mu . Figure 4(a) shows how the mentioned behavior-based features are computed for a sample URL u. Four files, Fu ∪Fu0 , and three machines, Mu ∪ Mu0 , are connected to u and Cu collectively. For simplicity, u and Cu are shown as one node. Each file and machine sends some information, shown on edges, to u for feature computations. Precisely, we consider FQD, e2LD, path, path pattern, query string, query string pattern, IP, and IP/24 as components of a URL. The path pattern is an advanced regular expression for u’s path. To generate it, we identify sequences of letters, digits, and hexadecimal numbers in a path, and generalize them while keeping non-alphanumeric characters. For example, if a URL’s path is /sample/123/DA10/foo.exe, then the generated path pattern would be /S6/D3/H4/S3.S3, which represents a path with sequences of 6 letters, 3 digits, 4 hexadecimal digits, 3 letters, a ’.’, and 3 letters. The query string is defined and generated in a similar fashion from the query string. The IP and IP/24 are the sets of IPs and IP/24 networks that u resolved to during the observation time window. Note that the features explained above help us to make better classification decisions. For example, consider u is an unknown URL that all of its neighbors are unknown nodes, so they cannot contribute meaningfully to classifying u. Nonetheless, if u shares the same URL path with a group of malicious URLs (because, for example, they were generated by the same kit), and if there are some known malware files or infected machines connected to this group of URLs, they will have an impact on accurately labeling u as malicious, since their R will be used to compute some features of u. Consider another example when the path component of some malicious URLs is generated by an algorithm that randomizes the characters, so they might look different. However, it is likely that they share the same path pattern. Now this group of malicious URLs will help classifying u, the unknown URL, if u has the same path pattern. Files Behavior-based Features. These are computed in a similar way as in URLs. For example, for a file, f , we gather all the connected nodes from the URLs and machines layers to compute the features of f . Figure 4(b) shows how these features are computed. Note that the connected URLs to f also send the R of their components, such as FQD, path pattern, IP, etc., to f for feature computation. We define the R of a URL’s component to be the average of R of all URLs that share the same component. This helps in correctly classifying unknown f nodes that their direct URL neighbors are also unknown, but share some components with known URLs.
4. EXPERIMENTAL SETUP 4.1 Calculating Badness Reputation and Labeling Nodes The following details how we label nodes of each layer of the tripartite download graph by assigning them badness
Table 1: Files and URL layers intrinsic features File Intrinsic Features Explanation The size of the files. Intuitively, large file sizes are less likely malware files and are mostly benign softwares. However, file size by itself cannot distinguish benign and malware files, since many benign files have small sizes, too. Extension This feature tries to capture malware binary downloads that have an unusual extension, such as jpg, to deceive users. Note this feature will only be useful, if a file has other extensions than exe. Lifetime The time difference between the last time and first time of seen date for a file by DIA. The intuition here is that usually files with very short lifetime are malware. Also considering the impact of packing and obfuscating, malwares can have very short lifetimes. Prevalence The number of downloads of a file by unique machines. Benign and popular softwares are downloaded by many machines around the world, but malwares, in contrast, usually are downloaded by a very small number of machines. In some extreme cases, malware distributors install a unique malware (with new and unseen-before SHA1 hash) to each machine. Packed This feature identifies whether files are packed by a packer or not. As mentioned in the description of other features, packing and obfuscation is a technique that is mostly used by malwares to avoid detection. Signed This feature identifies whether files are signed or not. Number of countries The number of unique countries that downloaded the file. Same as the lifetime or prevalence features, this feature also tries to capture unpopular files. Java or Acrobat Reader If the downloading process of a file is Java (java.exe) or Acrobat Reader (acrord32.exe) and the download URL is not oracle.com or acrobat.com, then this feature will be set to true. The reason is that the downloads that are triggered by the Java or Acrobat Reader processes are possibly suspicious. URL Intrinsic Features Feature Explanation URL, FQD, and e2LD age These features determine how long ago the URL, FQD, and e2LD were first seen in our data in a time window. In general, new or not very popular URLs and domains are more likely to be malicious than benign. Feature Size
file2
file1
file4
file3
Each file sends R and number of AV labels
u ⋃ Cu
machine2
compute min, max, med, avg, and std machine3
(a) URL behavior-based features
url4
url3
Each URL sends R of itself, plus R of its FQD, e2LD, path, path pattern, IP, etc.
u behavior-based features = {files stats, machine stats}
Each machines sends R
machine1
url2
url1 compute min, max, med, avg, and std
f
f behavior-based features = {URL stats, machine stats}
Each machines sends R
machine1
machine2
compute min, max, med, avg, and std
compute min, max, med, avg, and std machine3
(b) File behavior-based features
Figure 4: Computation of behavior-based features: (a) for URL, u, based on R and other information of neighbor files and machines that are connected to either u or Cu ; (b) for file, f , based on R of connected URLs and their components and machines
reputation R. As discussed in section 3.1, R is a real number in range [0, 1] that represents how much evidence exists towards badness or goodness of nodes in the graph. Generally, values closer to R = 1 mean high probability of badness, values closer to R = 0 indicate high goodness possibility, and R = 0.5 means unknown, i.e. no evidence. Files: Ground truth could be collected for some of the files in the tripartite graph using various sources, such as VirusTotal. If available, we use the assigned labels of reputable and well-known antivirus companies to compute reputation scores for files. We also use a proprietary list of known benign files to further enhance the file reputation computation. Empirically, we identified ten antivirus vendors that provide the most reliable results and are more well-known and popular according to their market share, and we refer to this list as trusted AVs1 . Our confidence of a file being bad depends on the number of AVs from the trusted AVs list that label the file as malicious, and, therefore, it determines the R for the file. The more trusted AVs have a malicious label for a file the higher the badness score will become. An R 1
Our list of trusted AVs: Trend Micro, Microsoft, Symantec, McAfee, Kaspersky, AVG, Avast, ESET Nod32, BitDefender, and Sophos
above a certain threshold translates to a bad label. On the other hand, if no AV, either trusted or not, have a malicious label for a file, a low R and consequently a good label will be given to the file. In addition, we utilize a proprietary list of known benign files to refine R. URLs: We leverage black- and whitelists of URLs and domains to gather ground truth regarding URLs. While some of the sources that we use are private, the majority are publicly available, such as list of popular domains according to Alexa and a blacklist of malicious domains according to Google Safe Browsing (GSB) [10]. We use a proprietary list of benign URLs as our whitelist that is combined, conservatively, with Alexa list of top 1 million domains to minimize noise as follows. We keep track of domains that consistently appeared in Alexa list for about a year. From this list we also filtered out known domains related to cloud storage and those that allow their subdomains to be freely registered, such as web hosting or free blog services and dynamic DNS providers, as these type of domains might be abused by attackers. The final list contains ∼450K domains which are very unlikely to be malicious. Then from whitelist of URLs, we remove those URLs that their e2LD does not ap-
pear in our Alexa list. This conservatively filtered whitelist of URLs contains minimal noise (see Section 6 for possible limitations). Now if a URL is found to be in our filtered whitelist, a low R, i.e. a score close to 0, will be assigned and the URL will be labeled as good. Similarly, a conservative approach is followed to label malicious URLs. A URL will be assigned an R close to 1 (maximum badness), if GSB and our private blacklist have that URL as a malicious URL, and so a bad label will be assigned. Note that to account for possible noise in the black- and whitelists, we don’t set the Rs to absolute 0 or 1. In all other cases, R will be a number close to 0.5, and an unknown label will be assigned. Machines: The reputation computation for machines is somewhat different in terms of meaning from files and URLs, as benign and malicious labels for this group of nodes don’t necessarily denote a good or a bad machine per se. Instead, a malicious label for a machine represents a machine that tends to be more vulnerable to infections, according to historic evidence (e.g., past known infections on that host) and a benign label represents a machine that seemed not associated with malicious content when looking at its activities in the past. In a novel approach, we combine the behavioral history of the machines with some system level information collected by DIA to compute R of machines as follows. For each machine, in a time window, we consider the history of its activities, including downloaded files and visited URLs, as well as the list of client processes that initiated the downloads. Since all these entities in machine’s activity history are assigned Rs, we can average their combined badness reputations and use it as machine’s R score. The intuition is that if a machine, during a time period, does not download bad files, contact bad URLs, or run bad processes, it is likely that the machine is a clean one. In contrast, a machine will be assigned a high R if in the past downloaded enough bad files, contacted some bad URLs, or had malware processes running. In this case, it is likely that this machine is vulnerable and will access malicious content again in the future.
4.2
System Operation
In this section we describe how the behavioral classifiers are trained and how the system operates. The system provides real-time classification results for files and URLs observed on daily basis. Furthermore, by combining the classification results of files and URLs, Mastino enables the classification of the entire download events, d = (u, f, m), 3-tuples of URLs, files, and machines. To do so, the system automatically classifies new items (files and URLs) on the current day harnessing historical knowledge gathered from the previous days in a time window T . The historical knowledge is, in fact, the augmented tripartite download graph that associates the items of download events together where all nodes are assigned an R value. We keep a sliding window over all the download events and set T = 10 days. That is, the beginning of T is set to 10 days before the start of current day, dc . So we are interested in classifying all unknown nodes observed on dc using the download graph that is generated by considering all download events during T (see Figure 5). Note the decision on the length of T is set based on our evaluations which are reported in Section 5.6. For any unknown file and URL node in dc , we compute its feature vector by following the procedure described in Section 3.2, and feed the feature vector of the unknown node to
the related behavioral classifier, i.e. an unknown file will be fed to the files classifier and an unknown URL will be fed to the URLs classifier. The classifier in return produces a score which will be compared against a previously learned detection threshold. If the produced score is above the detection threshold the unknown node will be labeled as malicious. Eventually, by combining the classification results for files and URLs, Mastino detects malicious download events d = (u, f, m) where u or f were labeled as bad by the classifiers. Figure 5 shows how does the system operate by keeping a sliding window over all the download events during T and using them to generate a download graph and train behavioral classifiers. The window T slides forward to train new classifiers for subsequent dc days and classify new and unknown files and URLs. U F
M
Train Classifiers
Classification System File Classifier
Real-time classification of files & URLs
URL Classifier All download events during Time Window T
U F
...
U M
F
M
U F
M
Detection of Malicious Download Events Time
Start of time window T
Day 1
Day 2
End of time window T (e.g. Day 10)
Current day (dc)
Figure 5: System Operation
4.3
Training the Classifiers
In order to properly train the file and URL behavioral classifiers to be used for detection on current day, dc , we use the knowledge from previous days during T in the graph to prepare training datasets of known files and URLs. The training dataset for file classifier, for instance, contains labeled feature vectors for all known good and bad file nodes in the download graph during training time window T (see Figure 5). Section 3.2 explains how feature vectors for files and URLs are computed. Computing Behavior-based Features During Training. Note that for known file and URL nodes that are used for training, part of their behavior-based features are based on R of machines connected to them. However, the R of machines was computed according to their history, i.e. the files and URLs connected to them in the first place (Sect.4.1). So if we simply use the assigned R of machines to compute the behavior-based features for files and URLs during training, we unfairly give the classifier an advantage. In machine learning, this phenomenon is known as information leakage. To resolve this issue, before we compute behavior-based features for a known node n, to be included in the training dataset, we temporarily ignore any impact n had on determining R of machines, as if n was unknown.
5.
EVALUATION
We performed numerous experiments to fully evaluate the system. In this section, first, we report some statistical information about the data. Second, we explain our train and test experiment. Next, we discuss the labeling of download events and evaluating the whole system. Then we present the results of feature analysis and efficiency measurements.
Finally, we present a detailed section on analyzing our results and some interesting case studies.
5.1
Data Collection
This work is based on the data collected from Dec 2013 to Aug 2014 by the DIA agents from customers of Trend Micro. The collected data contains download events d = (u, f, m) and their associated network- and system-level information, as explained in Section 2. During a time window T and using the download events, Mastino generates a tripartite download graph. Table 2 reports statistics about the nodes in various tripartite download graphs over multiple T = 10 days for each month of data. Table 3 reports the number of events that were observed during T as well as the number of edges of the generated download graphs. The “Date” column reports the month that the days of the time window belong to. Table 2: Node statistics for download graphs generated during sample T = 10 days for each month of the data Date Jan Feb Mar Apr May Jun Jul
Files URLs Machines Total Benign Malware Total Benign Malware Total Clean Vulnerable 144,435 1,976 1,021 124,306 15,121 39,183 121,177 431 19,533 127,369 2,040 1,668 112,310 12,056 37,266 110,231 956 17,236 120,584 1,801 1,432 106,041 11,291 34,596 100,098 1,347 13,882 102,922 1,732 3,744 99,883 12,092 32,594 92,696 780 16,998 96,289 1,643 2,904 92,665 12,707 27,174 84,347 877 15,299 79,310 1,708 1,875 77,401 15,338 23,424 69,881 590 16,544 74,543 1,622 1,479 73,434 11,591 22,775 65,646 868 13,005
Table 3: Download events and graph size statistics generated during sample T = 10 days for each month of the data Date Download events Unique Download events Edges Jan 385,939 190,021 2,916,292 Feb 291,940 168,376 2,590,943 Mar 256,076 154,980 2,402,586 Apr 257,426 142,807 2,167,115 May 253,107 130,570 2,008,174 Jun 182,960 108,014 1,658,350 Jul 189,936 102,649 1,555,636
5.2
Train and Test Experiments
In this section we show the evaluation result of system operation as it was discussed in Section 4.2. To this end we have defined a time window, T , which keeps track of all download events that happened during T . We are interested in using trained classifiers based on labeled nodes in the download graph during T to enable detection of new and unknown nodes on the current day, dc . So dc is our test day. We first discuss the preparation of training and test datasets for a single day of experiment and then present the results over multiple days of performing the tests.
5.2.1
Training and Test Datasets
First we generate a training dataset using all the known nodes in the graph during training time window T by following the procedure detailed in Section 4.3. To prepare the test datasets and to replicate the real-world operation of the system we proceed as follows. To evaluate the classifiers, we consider the nodes on dc , the test day, that were not present during time window T . This ensures that no information regarding the test samples were ever used during training and properly simulates the operative mode of the system where we are only interested in labeling new and unknown nodes on dc . We prepare three different groups of test datasets for files and URLs using nodes on dc as follows:
New Nodes - Fn and Un : Fn contains all files belonging to download events d = (u, f, m) from test day, dc , for which the file f was never seen during training time window, T , but the URL u or machine m appeared during T . Similarly, Un is composed of all new URLs from download events on dc , but the file f or machine m were seen during T . New Download Events - Fe and Ue : Fe contains all files belonging to download events d = (u, f, m) observed on dc for which none of the nodes were ever appeared during the training period T , however, some ground truth exists for the URL u or machine m. For example, Fe might contain a file that is connected to a new URL u and a new machine m where m downloaded some other malicious files from some bad URLs on that same test day dc , and, therefore, it was labeled as bad on dc . In a similar fashion, we generate test dataset Ue for URLs. New Unknown Download Events - Fu and Uu : Fu contains all files belonging to download events d = (u, f, m) appeared on dc for which none of the nodes ever observed during the training period T and no ground truth is available for the URL u and machine m whatsoever. URLs test dataset Uu is constructed similarly.
5.2.2
Multi-day Train and Test Evaluation
We perform train and test experiments to evaluate the generalization capabilities of our behavioral classifiers. First, we generate all three groups of test datasets described in Section 5.2.1 for various test days. Then we evaluate the performance of our trained classifiers on the test datasets. For example, for a single test day dc , we feed all file test samples in Fn , Fe , and Fu to the file classifier and record the prediction scores for each file in each test dataset separately. These scores are used to evaluate the performance of the classifiers on each specific test dataset on a single test day dc . However, we like to demonstrate that the classifier results are consistent for the entire dataset. So we combine the classification scores over multiple days and report the aggregate results as follows. We choose t testing periods, T P Ri , i = 1, 2, . . . , t, each including k consecutive test days, di,j , j = 1, 2, . . . , k. For a specific testing period, T P Rx , we perform train and test experiment for each dx,j , j = 1, 2, . . . , k. That is, first we train a set of classifiers by building a download graph over the time window, T , that ends just before dx,j (e.g., a time window that spans 10 days before dx,j ). The classifiers are used to produce prediction scores for the test nodes on dx,j . The time window T is then slid forward to compute prediction scores for all k days belonging to testing period T P Rx . Then we store these prediction scores Px,j , j = 1, 2, . . . , k. Finally, we aggregate all the prediction scores for the testing period T P Rx and report the results. To choose the most suitable classification algorithm for Mastino, we experimented with different statistical classifiers and picked Random Forest [7] as it consistently provided the best results. Figure 6 shows the results of these experiments for files and URLs using the three groups of test datasets for seven (t = 7) testing periods selected at random from various months of our data. Each testing period contains 5 consecutive test days (k = 5), resulting in train and test evaluation for 35 days, in total. We compute the ROC curves by varying the detection threshold on the classifier’s output scores. Also note that the ROCs show the true positive (TP) rates for false positives (FP) less than 1%.
.
100
0.2
0.4
0.6
FP (p e rce n t a g e )
0.8
60
20
0 0.0
1.0
(a) Fn test file nodes
Ja n Fe b Ma r Ap r Ma y Ju n Ju l
40
Average Size of Test Dataset Malicious URLs= 4,373 Benign URLs= 10,570 0.2
0.4
0.6
FP 5p e rce n t a g e )
0.8
1.0
TP ( p e r c e n t a g e )
TP 5 p e r c e n t a g e )
0.4
0.6
FP (p e rce n t a g e )
0.8
Average Size of Test Dataset Malware Files= 10 Benign Files= 175
0 0.0
1.0
0.2
0.6
0.8
1.0
.
100
80
Ja n Fe b Ma r Ap r
40
0 0.0
0.4
FP (p e rce n t a g e )
(c) Fu test file nodes
.
60
20
Ja n Fe b Ma r Ap r Ma y Ju n Ju l
40
20
80
60
0 0.0
0.2
100
80
20
Average Size of Test Dataset Malware Files= 127 Benign Files= 396
60
(b) Fe test file nodes
.
100
Ja n Fe b Ma r Ap r Ma y Ju n Ju l
40
Average Size of Test Dataset Malicious URLs= 3,183 Benign URLs= 6,558 0.2
0.4
0.6
FP (p e rce n t a g e )
TP 0 p e r c e n t a g e )
0 0.0
Average Size of Test Dataset Malware Files= 188 Benign Files= 480
80
TP ( p e r c e n t a g e )
Ja n Fe b Ma r Ap r Ma y Ju n Ju l
40
TP ( p e r c e n t a g e )
TP ( p e r c e n t a g e )
60
.
100
80
80
20
.
100
60
20
Ma y
Ju n Ju l 0.8
Ja n Fe b Ma r Ap r
40
Average Size of Test Dataset Malicious URLs= 158 Benign URLs= 6,202
0 0.0
1.0
0.2
0.4
0.6
FP 0p e rce n t a g e )
Ma y
Ju n Ju l 0.8
1.0
(d) Un test URL nodes (e) Ue test URL nodes (f) Uu test URL nodes Figure 6: Multi-day train and test for files (Fn , Fe , Fu ) and URLs (Un , Ue , Uu ) on seven different testing periods (FP∈ [0%, 1%])
As it can be observed from the ROCs, the file and URL classifiers perform very well even for very low FPs. For example, the file classifier when tested on Fe on average achieved 90% TP while incurring only 0.5% FP, and even for FP of 0.1%, average TP is 82.5%. For URLs in Ue the average TP is 86.5% and 96% for FPs 0.1% and 0.5%, respectively. Especially, the results of tests on Fu and Uu are remarkably good. Remember that test samples of Fu and Uu are files and URLs from download events where all nodes are unknown and never seen before. Nonetheless, the classifier can easily detect them. For files and in four months, for example, Mastino achieved 100% TP with no FPs (see Figure 6(c)). This is due to the power of our tripartite graph layers as well as system-level features that could help in these situations where not enough historic information is available. To help the reader better understand how the classifier can classify such cases, we provide a few case studies in Section 5.8. Furthermore, as Figure 6 shows, the detection results are fairly consistent throughout our dataset.
5.3
Overall Classification of Download Events
In Section 5.2 we evaluated the files and URLs classifiers separately. In this section, we discuss how we evaluate the classification system as a single unit to label download events daily. As a reminder, a download event is a 3-tuple of files, URLs, and machines. Mastino labels a download event as malicious, if the event’s URL, file, or both are labeled as bad by the classifiers. So for evaluation, we consider the test samples of one day of train and test experiment. Then we classify the files and URLs with FP set to 0.5%. Then we consider all the related download events to test nodes and label them according to the following two rules: i) if file is a TP or URL is a TP, the event will be labeled as TP, and ii) otherwise if file is a FP or URL is a FP, then event will
be labeled as FP. We experimented with various test days spread randomly across our dataset. Table 4 reports five of those test days (results of other test days are very similar). Table 4: Results of labeling download events on five sample test days Month of Test Day Feb Mar Apr May Jun
5.4
Events test events TP% FP% 4,205 96.2 0.4 4,581 95.4 0.5 4,163 97.3 0.5 4,004 96.1 0.4 3,856 94.0 0.5
Feature Analysis
In order to assess the usefulness of various feature groups in our system, we performed extensive feature analysis. In particular, in this section we will show that the presence of all three layers are necessary for detection of files and URLs. To perform feature analysis, we proceed as follows. We remove all groups of features that are related to a specific layer of the graph from the classifiers, perform the train and test experiment, and compare the results with the case of having all features present. For example, for files classifier, first we can remove the features related to the URLs layers, which essentially means having only 2 layers of files and machines in the graph and perform a train and test experiment. Then in another train and test experiment we can remove the machine layer. In addition, we also remove the intrinsic features (system-level features) of the classifiers and compare the result with the case of keeping them to show that they are also essential for better detection results. Figure 7(a) shows the feature analysis results for the file classifier for a testing period in February which is an aggregate of 5 days (see Section 5.2.2). While the ROC labeled as “All Features” is the detection result of a classifier that benefits from all the
100
100
100
80
80
TP (percentage)
TP (percentage)
layers of the graph as well as the files intrinsic features, each of the other ROCs are generated by removing one group of features at a time. Figure 7(b) shows a similar experiment but for URLs. Clearly, the performance of the classifier is the best when all features are used.
60
40
All_Features No_Machine No_URL No_Intrinsic
20
0 0.0
0.2
0.4
0.6
FP (percentage)
0.8
(a) Fn test file nodes
T= 1 T= 5 T= 10 T= 20 T= 30
0.2
0.4
0.6
FP (percentage)
0.8
0.2
0.4
0.6
FP (percentage)
0.8
1.0
Figure 8: Selection of time window for files - train and test using Fn with various T lengths
All_Features No_Machine No_File No_Intrinsic 1.0
(b) Un test URL nodes
Efficiency
The whole MDD system (Figure 3) would run on a server that receives requests from DIAs. The server that we used is actually quite a light machine with only 8GB of RAM and 8 1.2GHz CPUs. We averaged the run time for training and testing phases over multiple runs. On average the training phase requires about 2 hours and 30 minutes to generate a download graph over a time window of 10 days and train the classification models. On a single day, we observe around 21K to 22K nodes (files and URLs) and the total time it takes to compute a classification result for all items is approximately 20 to 30 minutes which translates to about 0.08 seconds per node. Consequently, it takes 0.16 seconds to label a download event. So Mastino is capable of providing on-line and almost instantaneous responses to clients’ requests. Thus, as mentioned in Section 2, the DIA agent needs to quarantine the newly download file for only about 0.16 seconds (plus some negligible network communication delay) to receive a response from the MDD. Considering that the time it takes to actually download files is much larger than 0.16 seconds, Mastino will not have a negative impact on users’ experience.
5.6
Selection of Training Time Window T In our experiments, we set T = 10 days based on our pilot experiments with various time windows ranging from 1 to 30 days. In this section, we compare the detection result on a same testing period using various T lengths. We demonstrate that our chosen T = 10 days provides a good trade-off between runtime efficiency and detection performance. Figure8 reports the results of a file train-test experiment over a testing period for time windows of 1, 5, 10, 20, and 30 days. As it can be seen, by increasing T length beyond 10 days, no notable performance gain could be achieved. Furthermore, as the length of time window increases, the training time increases as well. On average, the training time for T of 1, 5, 10, 20, and 30 days is about 40, 70, 120, 240, and 370 minutes. Similar results apply for URLs, too. 5.7
40
0 0.0
40
Figure 7: Feature analysis results (testing period: February)
5.5
TP (percentage)
60
0 0.0
60
20
20
1.0
80
Analysis of the Classification Results
In this Section, first, we discuss the results of train and test experiment (Section 5.2). Next, we analyze the output of our classifier on completely unknown files, i.e. those files for which no ground truth was available whatsoever at the
time of performing the train and test experiments. Finally, we report a break down of Mastino’s detected malware families when it was run in the wild.
5.7.1
Download events with Ground Truth
To perform this analysis, we picked a testing period of 5 days (see Section 5.2.2) and used a threshold of 0.5% FP rate for classification. In this experiment, 21 files are identified as false negatives (FN), i.e. labeled as benign by our system, but according to AV labels should have been labeled as malware. Out of these FNs, none were connected to any malicious URLs (6 were connected to only benign URLs), 15 FNs did not use any type of code obfuscation techniques, and 17 files were downloaded by machines that had a clean history, i.e. they were not labeled as infected in the graph. These observation to some extent justifies the decision of the classifier on labeling these files as benign since the majority of them were connected to non-malicious URLs in the graph, or did not exhibit a malicious behavior (e.g., downloaded on machines with a clean history and not packed). Further investigation revealed that some of FNs were “potentially unwanted applications”, such as adware, bundled with benign software. Next, we analyze the FPs. Out of 3 FPs: 1 was downloaded by multiple malicious URLs, another was packed and the last was downloaded on a machine with R > 0.7. So even though according to AVs and our proprietary whilelist of files, these samples were assigned a benign label, they might very well be malware.
5.7.2
Completely Unknown Download Events
We now evaluate our system as deployed in an operational environment, i.e. running on files that are unknown to AV vendors at the time of performing the train and test experiment. By evaluating which samples are correctly classified prior to any detection by AVs, we show that Mastino can label unknown files accurately and ahead of time. To this end, we performed train and test and used a classifier’s threshold of 0.5% FP rate. Then we obtained the most up-to-date labels from VirusTotal, i.e. corresponding to six months after the testing period. In between the dates that the experiment was performed and the date that VirusTotal was queried again, a portion of the samples that were previously unknown have got some labels. Out of 57,896 unknown files on test day, 406 were later detected as malicious and 2,774 identified as benign. Overall, Mastino correctly classified 84% of future malware on the test day, when they were still unknown to all AVs, and incurred 1.2% FPs.
To understand why Mastino incurred FPs, we further analyzed the characteristics of these files. Looking at the download graph, 38% of FPs were connected to malicious URLs, 94% were packed, and 50% of FPs were downloaded by machines that had recently downloaded other malware or contacted malicious URLs. These are suspicious signs for the classifier. We also analyzed the FN results (64 out of 406 files). In the graph, most of the FNs were in fact connected to either benign or unknown URLs and only 12% of FNs were connected to malicious URLs. Furthermore, 89% of the FNs, were downloaded by machines with clean histories.
5.7.3
Break Down of Detected Malware Families
Here we report examples of malware families that Mastino detected during our testing before any other trusted AVs. Among these, a significant amount is represented by first stage malware like downloaders and droppers, e.g. Win32/In stallCore.MI, TrojanDropper:Win32/Rovnix, Downloader .ATW and MalSign.InstallC.4DB. Note that downloaders and droppers, in general, represent a significant portion of malware samples because they are often associated with the first code being downloaded and executed on infected machines from malware campaigns. Other families consist of adware, bots, banking trojans (bankers) and key-loggers, including, e.g., Rogue:Win32/FakePAV, Win32:Crypt-QTG, PWS: Win32/Zbot, FakeAV_r.YE, Backdoor.Trojan, and Trojan .FakeAV.
5.8
Case Studies
In Section 5.2.2, we presented the classification results of test download events for which none of the nodes were present during the training time window and no ground truth was available for the nodes. We showed that the classifier can detect the majority of such nodes with high accuracy. Here we report a few case studies of those file nodes. Case Study 1: E-mail Dropper. A file with the name of file_saw.exe was observed on Feb. 12 and used as test sample in Fu because it was downloaded by machines and from URLs for which no ground truth was available. However, our classifier successfully assigned a malicious label to this file. Further analysis revealed that the sample was a downloader, usually distributed via spam emails and detected as Win32/Trojan Downloader.Wauchos.A and Win32:InjectBGK [Trj]. By analyzing the file’s features, we confirm that the features related to the path patterns of the URLs helped the classifier in his successful talk 2 . These features show an average reputation score of 0.72 (i.e., malicious), meaning that multiple URLs with the same path pattern have offered malicious files. In total, 182 files were downloaded from 1,445 URLs with same path pattern, which mostly were malware. Other contributing features are the low number of countries that downloaded the file (one in this case), and the low prevalence of the downloaded files: about 85% of them had a prevalence less than 2. Finally, the classified file did not have a valid signer at the time of download. Case Study 2: Somoto. Two files in Fu with similar filenames (FreeZipSetup-[0-9a-zA-Z].exe) were downloaded by two unknown machines from unknown URLs. The files 2
URLs with paths /f/1392240240/1255385580/2 and /f/1392240120/4165299987/2, and the path pattern /H1/D10/D10/D1 offered the file.
were correctly labeled as malware by Mastino. Further investigation revealed that the files belong to an adware campaign called Somoto. These files were packed, had short lifetime and prevalence of zero. In addition, although the related machines were labeled as unknown, according to the download graph, one of them downloaded one malicious file during T . Interestingly, during the same time window, 695 files with very similar names, features, and sizes3 were downloaded from several hundreds URLs. Mastino classified all of them as malicious. By analyzing them, we confirmed that they are indeed part of the same malware campaign and therefore correctly detected as malicious on early phase by our system. However, on the day of experiment, only 79 were known by AVs. Six month later, 634 were reported as bad by VirusTotal (the remaining 61 are still undetected). Case Study 3: TTAWinCDM Spyware. This file was classified as malware by Mastino on March 19 when no prior AV information was available: The first submission to VirusTotal occurred over two months later. Even though this file was identified on one machine with R = 0.5 and downloaded from a single URL with R = 0.5 as well, it was classified correctly. By our analysis, the feature that contributed actively on the detection was a mismatch on the downloading process. In fact, while the downloading process was identified as Acrobat (i.e., acrord32.exe), the file was not downloaded from a URL hosted on the acrobat. com domain. Other contributing factors were a very low lifetime, prevalence and number of countries.
6.
DISCUSSION AND LIMITATIONS
Mastino’s MDD should run on a server to receive requests from DIAs on clients’ machines. One challenge here is to keep the server up and running at all times, so it becomes a single point of failure. Also the communication between DIAs and MDD might suffer from small network communication latency. However, the idea of centric servers nowadays is used by many systems commercially, which with current network infrastructures could run with very high availability rates. In addition, since MDD provides almost instantaneous decisions (see Section 5.5), and considering that network latency is negligible when compared to actual download time, Mastino could transparently protect users. Attackers might try to introduce noise to evade Mastino’s behavioral classifiers. For example, an attacker might serve a mix of benign and malicious files from their URLs to confuse our system. However, we believe this will not trouble Mastino notably. First, considering the way we compute the behavior-based features (Section 3.2.2), our system still takes into consideration the aggregate of badness reputations of all files served from the attacker’s URLs and could still distinguish these cases. Second, even though the attacker could mix some good files in their URLs, they cannot alter the badness reputation and labels of machines that contact these URLs, because we assign badness reputation to machines not only based on their network-level history, but also according to their system-level activities. Third, this type of evasion might have a negative impact on behavior-based features. Intrinsic features of benign and malicious files and URLs, however, could still steer Mastino towards correct decisions and play an important role in improving our accuracy as it is shown in Section 5.4. 3
Varying between 16.5K to 16.9K, due to the effect of packing.
Similarly, to evade detection and introduce noise, attackers might try to somehow utilize legitimate and popular domains. For example, they might host their malware on cloud storage services. Since the URLs of these domains are also used to store legitimate softwares, some amount of noise might be introduced when computing behavior-based features for files and URLs. To reduce the amount of noise, we try to filter out these types of domains from our whitelist (see Section 4.1). However, due to the number of such domains and services, it is difficult to filter all of them out. Despite this, Mastino still achieves very high accuracy while incurring very low FP rates. Again, intrinsic features assist us significantly in these situations as well. Another challenge is the detection of files and URLs for which no prior information is available in our download graph, i.e. the test samples of Fu and Uu (see Section 5.2.1). Mastino, however, performs remarkably well on these test datasets by taking full advantage of all the three layers of the download graph plus the intrinsic features. We also provided multiple case studies in Section 5.8 to further point out how Mastino enables detection in these difficult cases. We need to compute badness reputation and assign labels for nodes in all three layers of the tripartite download graph, including machines. In reality, machines’ true labels might change during training window T . So our labels for machines might not be completely accurate during the whole T due to their fleeting nature. For example, a machine will be labeled as vulnerable, if it downloaded enough malwares during training window T or visited multiple malicious URLs, but it is possible that after visiting those URLs and downloading malware files and getting infected, an AV agent disinfected the machine. However, the machine’s label will stay as vulnerable in the graph for T . Despite this, we still believe that keeping the machine’s label as vulnerable is useful, even if it is cleaned currently, due to the fact that it had a tendency of downloading malwares and visiting malicious URLs and it could likely do so again. We also showed in Section 5.4 that machines’ reputations are helpful in improving our accuracy.
7.
RELATED WORK
Traditional approaches in malware detection involve analyzing the binaries by statically inspecting the code or evaluating their behavior at runtime [4, 5, 15, 20, 23, 25]. Unfortunately, the time to detect malwares is quite high in these methods and they simply cannot keep up with thousands of new and unknown files observed daily in the wild. A large corpus of research focus on DNS-based reputation systems [1–3, 6], which primarily focus on detecting IP addresses and domain names associated with malicious activities, e.g. hosting C&C servers or “drop zones”. Mastino is a different system that not only could detect malicious URLs, it can also provide real-time protection against malware files and can label download events using a novel tripartite graph mining model. Graph mining, as a general technique to reason on data modeled as a graph, has been successfully applied in different domains of system security. Polonium [8] aims to detect malware files using graphical models. While their graph-based approach is similar to ours, we identify the following fundamental differences: Polonium employs a very expensive loopy belief propagation algorithm and adopts an offline approach, by running the algorithm on the entire
(huge) graph, which is very time consuming and costly. As opposite, we do real-time detection and proactively detect malware download events so that malware files can be immediately quarantined (or removed) to prevent their execution on the client machine; Polonium does not consider the URL layer and only classifies files. Our approach extends the analysis to the URL from where the file was downloaded, and we concurrently classify files and URLs. In addition, as we showed in our evaluation, all layers, including URL layer, are helpful in improving the system overall performance; The Polonium’s paper does not reveal how the reputation of machines is computed. On our side, we present and describe, in detail, which intrinsic machine’s features are helpful in improving the results – for example, the download history of a machine and the downloading process. Manadhata et al. in [16] also introduce a system that detects malicious domains by constructing a host-domain graph that runs belief propagation. Relationships between files (e.g., between binaries) have also been modeled with graphs in [21] and [24] to detect malwares. Recently, authors of [13] also proposed a system to detect malwares by following the chains of downloads on individual hosts initiated by malware droppers. Mastino is different from these systems as it provides simultaneous detection of malicious files, URLs, and download events, in general. More recently, authors in [18] build bipartite graphs from passive DNS traffic collected from large ISP networks, with the goal of representing the who is querying what relationship. They run a graph-based behavioral classifier that suggests for domains used in C&C operations. Unlike this work, Mastino is not limited to only detecting C&C servers and can deal with all sort of malicious URLs. Nazca [12] focuses on detecting malware downloads by identifying the network infrastructure (domain, IPs, URLs) that support malware installation campaigns (e.g., drive-by download campaigns). Nazca is designed to be deployed at the edge of ISP networks, and only inspects network traffic without performing any analysis of the file properties or reputation of the downloading client. On the contrary, Mastino combines information from URLs, files, and client machines to accurately detect new malware downloads in real time. AMICO [22] and Google’s CAMP [19] distinguish between benign and malicious files by reasoning on the download behavior of client machines. However, we identify several fundamental differences with our work. AMICO performs on-the-fly reconstruction of the download from HTTP network traffic. This is expensive and limits its adoption to non-encrypted traffic and standard protocols. AMICO, for example, cannot detect modern ransomwere like TorrentLocker [14], which hosts the cash-out infrastructure in the Tor network – i.e., a series of circuits of encrypted connections as routing relays. In the same way, CAMP only detects files as been downloaded from the browser (i.e., Chrome). This makes the system ineffectual against malware updates (e.g., from botnets), second-stage malware (often employed in large malware campaigns), or any file downloaded by a generic client. In addition, as the downloaded file is intercepted and reconstructed at browser-level, multi-stage infections (i.e., where the drive-by’s execution code downloads the malware in multiple steps) might not been efficiently identified by CAMP, or exploits triggering vulnerabilities in the browser might disable the anti-malware solution.
Our system, in addition to overcome the limitation hereby described, aims at protecting users’ machine independently from their networking configuration. AMICO, for example, collects download information at network level and is useful in protecting machines when installed in LANs – but it fails with protecting machines like laptops switching across different networks (e.g., wireless or 4G). Another important difference in approach is the lack of system-level information about the machine that downloaded the file, e.g. about the client process that initiated the download and the destination path where the downloaded file is stored. As we showed in our evaluation, these features help in improving our system. Finally, both AMICO and CAMP are only able to detect malware files, but Mastino leverages a tripartite download graph to enable concurrent detection of bad URLs, malware files, and malicious download events in general.
8.
CONCLUSION
In this paper, we presented Mastino a novel system that is cable of efficiently detecting malware download events in real time by passively monitoring the download events of users. We developed a proof-of-concept prototype of the system and evaluated it using real-world data. Our evaluation results show that the system can detect malware files and malicious URLs with high accuracy while only incurring less than 0.5% FPs. We discussed the efficiency of the system and the fact that it only takes a fraction of a second to provide accurate classification of files or URLs submitted to the system. We analyzed our classification results in details and provided interesting case studies of Mastino’s real-world operation.
Acknowledgments This material is based in part upon work supported by the National Science Foundation, under grant No. CNS-1149051. Any opinions, findings, and conclusions or recommendations expressed in this material are those of the authors and do not necessarily reflect the views of the National Science Foundation. This work is also partially supported by a grant from the Auburn University at Montgomery Research Grant-inAid Program. Additional acknowledgments go to Trend Micro’s Forward-Looking Threat Research (FTR), SPN and Machine Learning teams who supported the research in different forms.
9.
REFERENCES
[1] M. Antonakakis, R. Perdisci, D. Dagon, W. Lee, and N. Feamster. Building a dynamic reputation system for dns. In USENIX security symposium, pages 273–290, 2010. [2] M. Antonakakis, R. Perdisci, W. Lee, N. Vasiloglou II, and D. Dagon. Detecting malware domains at the upper dns hierarchy. In USENIX Security Symposium, page 16, 2011. [3] M. Antonakakis, R. Perdisci, Y. Nadji, N. Vasiloglou II, S. Abu-Nimeh, W. Lee, and D. Dagon. From throw-away traffic to bots: Detecting the rise of dga-based malware. In USENIX Security Symposium, pages 491–506, 2012. [4] U. Bayer, C. Kruegel, and E. Kirda. TTAnalyze: A tool for analyzing malware. na, 2006. [5] J. Bergeron, M. Debbabi, J. Desharnais, M. M. Erhioui, Y. Lavoie, N. Tawbi, et al. Static detection of malicious code in executable programs. Int. J. of Req. Eng, 2001(184-189):79, 2001. [6] L. Bilge, E. Kirda, C. Kruegel, and M. Balduzzi. Exposure: Finding malicious domains using passive dns analysis. In NDSS, 2011.
[7] L. Breiman. Random forests. Machine learning, 45(1):5–32, 2001. [8] D. H. Chau, C. Nachenberg, J. Wilhelm, A. Wright, and C. Faloutsos. Polonium: Tera-scale graph mining for malware detection. In ACM SIGKDD Conference on Knowledge Discovery and Data Mining, 2010. [9] M. Felegyhazi, C. Kreibich, and V. Paxson. On the potential of proactive domain blacklisting. In Proceedings of the 3rd USENIX conference on Large-scale exploits and emergent threats: botnets, spyware, worms, and more, pages 6–6. USENIX Association, 2010. [10] Google. Google Safe Browsing. https: //www.google.com/transparencyreport/safebrowsing/. [11] F. Guo, P. Ferrie, and T.-C. Chiueh. A study of the packer problem and its solutions. In Recent Advances in Intrusion Detection, pages 98–115. Springer, 2008. [12] L. Invernizzi, S. Miskovic, R. Torres, S. Saha, S. Lee, M. Mellia, C. Kruegel, and G. Vigna. Nazca: Detecting malware distribution in large-scale networks. In Proceedings of the Network and Distributed System Security Symposium (NDSS), 2014. [13] B. J. Kwon, J. Mondal, J. Jang, L. Bilge, and T. Dumitras. The dropper effect: Insights into malware distribution with downloader graph analytics. In Proceedings of the 22nd ACM SIGSAC Conference on Computer and Communications Security, pages 1118–1129. ACM, 2015. [14] K. Lab. Torrentlocker ransomware. http://www.kaspersky.com/internet-security-center/ threats/torrentlocker-malware, 2015. [15] W.-J. Li, K. Wang, S. J. Stolfo, and B. Herzog. Fileprints: Identifying file types by n-gram analysis. In Information Assurance Workshop, 2005. IAW’05. Proceedings from the Sixth Annual IEEE SMC, pages 64–71. IEEE, 2005. [16] P. Manadhata, S. Yadav, P. Rao, and W. Horne. Detecting malicious domains via graph inference. In Proceedings of the 2014 Workshop on Artificial Intelligent and Security Workshop, pages 59–60. ACM, 2014. [17] J. Oberheide, E. Cooke, and F. Jahanian. Cloudav: N-version antivirus in the network cloud. [18] B. Rahbarinia, P. Roberto, and M. Antonakakis. Segugio : Efficient Behavior-Based Tracking of Malware-Control Domains in Large ISP Networks. DSN ’15 (45th Annual IEEE/IFIP International Conference on Dependable Systems and Networks), (3), 2015. [19] M. A. Rajab, L. Ballard, N. Lutz, P. Mavrommatis, and N. Provos. Camp: Content-agnostic malware protection. In NDSS, 2013. [20] N. Solutions. Norman sandbox whitepaper, 2003. [21] A. Tamersoy, K. Roundy, and D. H. Chau. Guilt by association: large scale malware detection by mining file-relation graphs. In Proceedings of the 20th ACM SIGKDD international conference on Knowledge discovery and data mining, pages 1524–1533. ACM, 2014. [22] P. Vadrevu, B. Rahbarinia, R. Perdisci, K. Li, and M. Antonakakis. Measuring and detecting malware downloads in live network traffic. In Computer Security–ESORICS 2013, pages 556–573. Springer, 2013. [23] C. Willems, T. Holz, and F. Freiling. Toward automated dynamic malware analysis using cwsandbox. IEEE Security & Privacy, (2):32–39, 2007. [24] Y. Ye, T. Li, S. Zhu, W. Zhuang, E. Tas, U. Gupta, and M. Abdulhayoglu. Combining file content and file relations for cloud based malware detection. In Proceedings of the 17th ACM SIGKDD International Conference on Knowledge Discovery and Data Mining, KDD ’11, pages 222–230, New York, NY, USA, 2011. ACM. [25] H. Yin, D. Song, M. Egele, C. Kruegel, and E. Kirda. Panorama: capturing system-wide information flow for malware detection and analysis. In Proceedings of the 14th ACM conference on Computer and communications security, pages 116–127. ACM, 2007.