Real-time automated 3D sensing, detection, and recognition of dynamic biological micro-organic events Bahram Javidi, Seokwon Yeom, Inkyu Moon, and Mehdi Daneshpanah Dept. of Electrical and Computer Engineering, U-2157, University of Connecticut, Storrs, Connecticut USA 062692157
[email protected]
Abstract: In this paper, we present an overview of three-dimensional (3D) optical imaging techniques for real-time automated sensing, visualization, and recognition of dynamic biological microorganisms. Real time sensing and 3D reconstruction of the dynamic biological microscopic objects can be performed by single-exposure on-line (SEOL) digital holographic microscopy. A coherent 3D microscope-based interferometer is constructed to record digital holograms of dynamic micro biological events. Complex amplitude 3D images of the biological microorganisms are computationally reconstructed at different depths by digital signal processing. Bayesian segmentation algorithms are applied to identify regions of interest for further processing. A number of pattern recognition approaches are addressed to identify and recognize the microorganisms. One uses 3D morphology of the microorganisms by analyzing 3D geometrical shapes which is composed of magnitude and phase. Segmentation, feature extraction, graph matching, feature selection, and training and decision rules are used to recognize the biological microorganisms. In a different approach, 3D technique is used that are tolerant to the varying shapes of the non-rigid biological microorganisms. After segmentation, a number of sampling patches are arbitrarily extracted from the complex amplitudes of the reconstructed 3D biological microorganism. These patches are processed using a number of cost functions and statistical inference theory for the equality of means and equality of variances between the sampling segments. Also, we discuss the possibility of employing computational integral imaging for 3D sensing, visualization, and recognition of biological microorganisms illuminated under incoherent light. Experimental results with several biological microorganisms are presented to illustrate detection, segmentation, and identification of micro biological events. ©2006 Optical Society of America OCIS codes: (110.6880) Three-dimensional image acquisition; (100.6890) Three-dimensional image processing; (100.5010) Pattern recognition and feature extraction; (170.3880) Medical and biological imaging
References and links 1.
2. 3. 4.
The largely forgotten Influenza in 1918, a. k. a. "Spanish Flu" or "La Grippe" killed an estimated 40 million people worldwide, and an estimated 600,000 in the USA. It infected an estimated 20% of the world population. See Alfred Crosby, “America's Forgotten Pandemic: The Influenza of 1918,” (Cambridge University Press, Cambridge, 1989). http://www.pbs.org/wgbh/amex/influenza/ J. W. Lengeler, G. Drews, and H. G. Schlegel, Biology of the prokaryotes, (New York, Blackwell science, 1999). M. G. Forero, F. Sroubek, and G. Cristobal, “Identification of tuberculosis bacteria based on shape and color,” Real-time imag. 10, 251-262 (2004).
#67676 - $15.00 USD
(C) 2006 OSA
Received 1 February 2006; revised 10 April 2006; accepted 10 April 2006
1 May 2006 / Vol. 14, No. 9 / OPTICS EXPRESS 3806
5. 6.
7.
8.
9. 10. 11. 12. 13. 14. 15. 16. 17. 18. 19. 20. 21. 22. 23. 24. 25. 26. 27. 28. 29. 30. 31.
32. 33. 34. 35. 36. 37.
J. Alvarez-Borrego, R. R. Mourino-Perez, G. Cristobal-Perez, and J. L. Pech-Pacheco, “Invariant recognition of polychromatic images of Vibrio cholerae 01,” Opt. Eng. 41, 827-833 (2002). A. L. Amaral, M. da Motta, M. N. Pons, H. Vivier, N. Roche, M. Moda, and E. C. Ferreira, “Survey of protozoa and metazoa populations in wastewater treatment plants by image analysis and discriminant analysis,” Environmentrics 15, 381-390 (2004). S.-K. Treskatis, V. Orgeldinger, H. wolf, and E. D. Gilles, “Morphological characterization of filamentous microorganisms in submerged cultures by on-line digital image analysis and pattern recognition,” Biotechnol. Bioeng. 53, 191-201 (1997). T. Luo, K. Kramer, D. B. Goldgof, L. O. Hall, S. Samson, A. Remsen, and T. Hopkins, “Recognizing plankton images from the shadow image particle profiling evaluation recorder,” IEEE Trans. Syst. Man. Cybern. Part B 34, 1753-1762 (2004). A. Mahalanobis, R. R. Muise, S. R. Stanfill, and A. V. Nevel, “Design and application of quadratic correlation filters for target detection,” IEEE Trans. Aerosp. Electron. Syst. 40, 837-850 (2004). F. A. Sadjadi, “Infrared target detection with probability density functions of wavelet transform subbands,” Appl. Opt. 43, 315-323 (2004). A. K. Jain, Fundamentals of digital image processing, (Prentice Hall, 1989). R. O. Duda, P. E. Hart, and D. G. Stork, Pattern classification 2nd, (NewYork, Wiley Interscience, 2001). C. M. Bishop, Neural networks for pattern recognition, (New York, Oxford University Press, 1995). B. Javidi and P. Refregier, eds., Optical pattern recognition, (SPIE, 1994). H. Kwon and N. M. Nasrabadi, “Kernel RX-algorithm: a nonlinear anomaly detector for hyperspectral imagery,” IEEE Trans. Geosci. Remote Sens. 43, 388-397 (2005). F. Sadjadi, ed., Milestones in performance evaluations of signal and image processing systems, (SPIE Press, 1993). P. Refregier, V. Laude, and B. Javidi, “Nonlinear joint transform correlation: an optimum solution for adaptive image discrimination and input noise robustness,” J. Opt. Lett. 19, 405-407 (1994). F. Sadjadi, “Improved target classification using optimum polarimetric SAR signatures,” IEEE Trans. Aerosp. Electron. Syst. 38, 38-49 (2002). B. Javidi and F. Okano, eds., Three-dimensional television, video, and display technologies, (New York, Springer, 2002). B. Javidi, ed., Image Recognition and Classification: Algorithms, Systems, and Applications, (New York, Marcel Dekker, 2002). B. Javidi and E. Tajahuerce, “Three dimensional object recognition using digital holography,” Opt. Lett. 25, 610-612 (2000). O. Matoba, T. J. Naughton, Y. Frauel, N. Bertaux, and B. Javidi, “Real-time three-dimensional object reconstruction by use of a phase-encoded digital hologram,” Appl. Opt. 41, 6187-6192 (2002). Y. Frauel and B. Javidi, “Neural network for three-dimensional object recognition based on digital holography,” Opt. Lett. 26, 1478-1480 (2001). E. Tajahuerce, O. Matoba, and B. Javidi, “Shift-invariant three-dimensional object recognition by means of digital holography,” Appl. Opt. 40, 3877-3886 (2001). B. Javidi and D. Kim, “Three-dimensional-object recognition by use of single-exposure on-axis digital holography,” Opt. Lett. 30, 236-238 (2005). D. Kim and B. Javidi, “Distortion-tolerant 3-D object recognition by using single exposure on-axis digital holography,” Opt. Express 12, 5539-5548 (2005). S. Yeom and B. Javidi, “Three-dimensional object feature extraction and classification with computational holographic imaging,” Appl. Opt. 43, 442-451 (2004). B. Javidi, I. Moon, S. Yeom, and E. Carapezza, “Three-dimensional imaging and recognition of microorganism using single-exposure on-line (SEOL) digital holography,” Opt. Express 13, 4492-4506 (2005). S. Yeom, I Moon, and B. Javidi, “Real-time 3D sensing, visualization and recognition of dynamic biological micro-organisms,” Proceedings of IEEE 94, 550-566 (2006). S. Yeom and B. Javidi, “Three-dimensional recognition of microorganisms,” J. Bio. Opt. 11, 024017-1~8 (2006). S. Yeom, I. Moon, and B. Javidi, “Two approaches of 3D microorganism recognition using single exposure online digital holography,” in F. Sadjadi and B. Javidi (eds.), Physics of Automatic Target Recognition, (Springer, 2006). B. Javidi, I. Moon, and S. Yeom, “3D microorganism sensing, visualization and recognition using single exposure on-line digital holography,” Optics and Photonics News 17, 16-21 (2006). I. Moon and B. Javidi, “Shape-tolerant three-dimensional recognition of microorganisms using digital holography,” Opt. Express 13, 9612-9622 (2005). S. Kishk and B. Javidi, “Improved resolution 3D object sensing and recognition using time multiplexed computational integral imaging,” Opt. Express 11, 3528-3541 (2003). S. Yeom, B. Javidi, and E. Watson, “Photon counting passive 3D image sensing for automatic target recognition,” Opt. Express 13, 9310-9330 (2005). T. Kreis, ed., Handbook of Holographic Interferometry, (Wiley, VCH, 2005). J. W. Goodman, Introduction to Fourier Optics 2nd, (Boston, McGraw Hill, 1996).
#67676 - $15.00 USD
(C) 2006 OSA
Received 1 February 2006; revised 10 April 2006; accepted 10 April 2006
1 May 2006 / Vol. 14, No. 9 / OPTICS EXPRESS 3807
38. 39. 40. 41. 42. 43. 44. 45. 46. 47. 48. 49. 50. 51. 52. 53. 54. 55. 56. 57. 58. 59. 60. 61. 62. 63. 64. 65. 66. 67. 68. 69.
70.
J. W. Goodman and R. W. Lawrence, “Digital image holograms,” Appl. Phys. Lett. 11, 77-79 (1967). I. Yamaguchi and T. Zhang, “Phase-shifting digital holography,” Opt. Lett. 22, 1268-1270 (1997). P. Ferraro, S. Grilli, D. Alfieri, S. D. Nicola, A. Finizio, G. Pierattini, B. Javidi, G. Coppola, and V. Striano, “Extended focused image in microscopy by digital holography,” Opt. Express 13, 6738-6749 (2005). T. Zhang and I. Yamaguchi, “Three-dimensional microscopy with phase-shifting digital holography,” Opt. Lett. 23, 1221-1223 (1998). B. R. Brown and A. W. Lohmann, “Complex spatial filtering with binary masks,” Appl. Opt. 5, 967-969 (1966). M. DaneshPanah and B. Javidi “Segmentation of 3D holographic images using bivariate jointly distributed region snake,” Opt. Express (submitted). O. Germain and P. Refregier “Optimal snake-based segmentation of a random luminance target on a spatially disjoint background,” Opt. Lett. 21 (1996). C. Chesnaud, V. Page, and P. Refregier, “Improvement in robustness of the statistically independent region snake-based segmentation method of target-shape tracking,” Opt. Lett. 23, 488-490 (1998). M. Kass, A. Witkin, and D. Terzopoulus, “Snakes: Active contour models,” Int. J. Comput. Vision 1, 321-331 (1987). N. Mukhopadhyay, Probability and Statistical Inference, (New York, Marcel Dekker, 2000). B. Javidi and J. Wang, “Limitations of the classic definition of the signal-to-noise ratio in matched filter based optical pattern recognition,” Appl. Opt. 31, 6826-6829 (1992). B. Javidi and J. Wang, “Optimum distortion invariant filters for detecting a noisy distorted target in background noise,” J. Opt. Soc. Am. 12, 2604-2614 (1995). J. G. Daugman, “Uncertainty relation for resolution in space, spatial frequency, and orientation optimized by two-dimensional visual cortical filters,” J. Opt. Soc. Am. 2, 1160-1169 (1985). T. S. Lee, “Image representation using 2D Gabor wavelets,” IEEE Trans. Pattern. Anal. Mach. Intell. 18, 959971 (1996). J. G. Daugman, “How iris recognition works,” IEEE Trans. Circuits Syst. for Video. Tech. 14, 21-30, (2004). M. Lades, J. C. Vorbruggen, J. Buhmann, J. Lange, C. v.d. Malsburg, R. P. Wurtz, and W. Konen, “Distortion invariant object recognition in the dynamic link architecture,” IEEE Trans. Comput. 42, 300-311 (1993). R. P. Wurtz, “Object recognition robust under translations, deformations, and changes in background,” IEEE Trans. Pattern. Anal. Mach. Intell. 19, 769-775 (1997). B. Duc, S. Fischer, and J. Bigun, “Face authentification with Gabor information on deformable graphs,” IEEE Trans. Image Process. 8, 504-516 (1999). S. Yeom, B. Javidi, Y. J. Roh, and H. S. Cho, “Three-dimensional object recognition using x-ray imaging,” Opt. Eng. 43, 027201-1~23 (2005). G.W. Snedecor and W.G. Cochran, Statistical Methods, (Iowa State University Press, 1989). M. G. Lippmann, “Epreuves reversibles donnant la sensation du relief,” J. Phys. 7, 821-825 (1908). H. E. Ives, “Optical properties of a Lippmann lenticuled sheet,” J. Opt. Soc. Am. 21, 171-176 (1931). Okoshi, Three-Dimensional Imaging Techniques, (New York, Academic, 1976). C. B. Burckhardt, “Optimum parameters and resolution limitation of integral photography,” J. Opt. Soc. Am. 58, 71-76 (1968). F. Okano, H. Hoshino, J. Arai, and I. Yuyama, “Real-time pickup method for a there-dimensional image based on Integral Photography,” Appl. Opt. 36, 1598-1603 (1997). F. Jin, J. Jang, and B. Javidi, “Effects of device resolution on three-dimensional integral imaging,” Opt. Lett. 29, 1345-1347 (2004). J. S. Jang and B. Javidi, “Three-dimensional integral imaging of micro-objects,” Opt. Lett. 29, 1230-1232 (2004). R. Martínez-Cuenca, G. Saavedra, M. Martínez-Corral, and B. Javidi, “Enhanced depth of field integral imaging with sensor resolution constraints,” Opt. Express 12, 5237-5242 (2004). H. Arimoto and B. Javidi, “Integral three-dimensional imaging with digital reconstruction,” Opt. Lett. 26, 157159 (2001). A. Stern and B. Javidi, “3D image sensing and reconstruction with time-division multiplexed computational integral imaging (CII),” Appl. Opt. 42, 7036-7042 (2003). S. Hong and B. Javidi, “Improved resolution 3D object reconstruction using computational integral imaging with time multiplexing,” Opt. Express 12, 4579 – 4588 (2004). Y. Frauel, E. Tajahuerce, O. Matoba, A. Castro, and B. Javidi, “Comparison of passive ranging integral imaging and active imaging digital holography for three-dimensional object recognition”, Appl. Opt. 43, 452462 (2004). A. Stern and B. Javidi, “Three-Dimensional image sensing, visualization, and processing using integral imaging,” Proceedings of the IEEE 94, 591- 607 (2006).
#67676 - $15.00 USD
(C) 2006 OSA
Received 1 February 2006; revised 10 April 2006; accepted 10 April 2006
1 May 2006 / Vol. 14, No. 9 / OPTICS EXPRESS 3808
1. Introduction The development of reliable, automated, and low-cost methods for real-time detection and identification of harmful bacteria and viruses are of significant benefits and essential in combating catastrophic diseases. Such pandemics could create global disasters and the death toll could be in millions [1-2]. Conventional methods in practice for inspecting most bacteria or viruses involve bio-chemical processing. In general, these techniques are labor intensive, require special skills, and are not real-time. Clearly, there could be vast applications for realtime automated recognition of microorganisms in a multitude of areas, including combating biological terrorism, security and defense, diagnosis of diseases, health care, food safety investigation and so on. Real-time automatic recognition of living organisms is a very difficult task for a number of reasons. Biological microorganisms are dynamic events and not rigid objects. They can move, grow, and reproduce themselves, and vary in size and shape among the same species [3]. In particular, bacteria and viruses are very small and simple morphological traits. They may occur as a single cell or form an association of various complexities according to the environmental conditions. Conventional methods in this field have been aimed to recognize cells through bio-chemical analyses. Most image-based recognition efforts for specific microorganisms have been based on two-dimensional (2D) intensity images [4-8] which may not be effective. 2D image processing and pattern recognition techniques have been extensively applied to identify objects in unknown scenes [9-18]. Recently, there has been increased interest in three-dimensional (3D) optical imaging and automatic target recognition (ATR) [19-35]. Digital holography techniques [36-41] can be used for 3D image sensing [21-27]. Previously, computer synthesized holograms were used for complex spatial filtering [42]. Holographic microscopy [40-41] is an attractive 3D imaging technique for acquisition and visualization of 3D information of the micro-biological objects. By means of digital holographic microscopy, one can obtain both magnitude and phase content of a microorganism. Single-exposure on-line (SEOL) digital holography [25-26] for 3D image recognition has benefits compared with off-axis and/or phase-shifting on-axis digital holography. In particular, the SEOL holographic setup is simpler than its off-axis counterpart and it is more robust to input object size and scale variations. Since recording a hologram in the SEOL holographic setup requires a single-exposure, it is robust to sensor noise and environmental variation, thus it can be used for monitoring and studying dynamic events of microorganisms. In this paper, we present an overview of several techniques for real-time automated 3D sensing, detection, visualization, segmentation, and recognition of microorganisms [28-33, 43]. In particular, SEOL digital holography is employed for sensing and visualization of micro-biological objects. The optical setup of SEOL digital holography is based on the MachZehnder interferometer to record the Fresnel diffraction field of microorganisms. The 3D complex amplitude of the microorganisms is computationally reconstructed at arbitrary depths along the optical axis without mechanical scanning. Segmentation of microscopic objects can be accomplished using a number of approaches [43-46]. One technique is bivariate jointly distributed region snakes method for segmentation of complex amplitude biological microorganism images [43]. Living organisms are non-rigid objects and they vary in shape and size. Moreover, they often do not exhibit clear edges in computationally reconstructed SEOL holographic images. Thus conventional segmentation techniques based on the edge map may fail to segment these images appropriately. We present a statistical framework based on the joint probability distribution of magnitude and phase information of SEOL holographic microscopy images and maximum likelihood estimation of parameters for the joint probability density function. An optimization criterion is computed by maximizing the likelihood function of the target support hypothesis [47-49]. The performance of the proposed method for the segmentation of reconstructed SEOL holographic microorganism images along with experimental results is presented.
#67676 - $15.00 USD
(C) 2006 OSA
Received 1 February 2006; revised 10 April 2006; accepted 10 April 2006
1 May 2006 / Vol. 14, No. 9 / OPTICS EXPRESS 3809
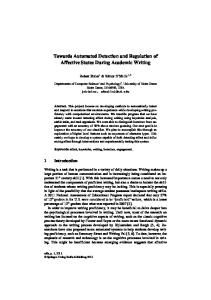
In one 3D recognition approach [See Fig. 1(a)], after the segmentation of the microorganisms, the recognition of microorganisms can be performed by analyzing the 3D complex morphology of the computationally reconstructed holographic images. Gabor-based wavelets [50-52] extract features of the microorganisms by decomposing the reconstructed images in the spatial frequency domain. A feature matching technique follows which measures the similarity of 3D morphologies between a reference microorganism and unknown biological samples. The graph matching with Gabor-based wavelets has been used as a robust template matching which is tolerant to shift, rotation, and distortion [53-56]. We may utilize the graph matching technique with Gabor features for automatic selection of feature vectors to be used in training and testing stages. In this case, trained features of the specific microorganisms will be stored in a database [29,30]. As we discussed, automatic recognition of microorganisms is a difficult task because of their dynamic nature (moving, growing, and varying in size and shape). Therefore, an alternative recognition approach is developed that utilizes statistical inference theory for a shape-tolerant 3D recognition system as shown in Fig. 1(b). A number of sampling segments are randomly extracted from the reconstructed 3D image of microorganisms. By selecting arbitrary sampling segments and testing them through statistical inference, we can develop a recognition system which is independent of the shape of microorganisms. These sampling segments are processed using various cost functions including mean-squared distance (MSD), mean-absolute distance (MAD), and statistical inference using the sampling theory [47]. The equality of means and equality of variances between the sampling segments of a reference microorganism and unknown input biological samples are tested for recognition. Student’s t distribution and Fisher’s F distribution are, respectively, used to analyze the difference of means and the ratio of variances of reconstructed microorganism images [47,57]. After calculating statistical parameters of the microorganisms, the data can be processed by training rules and then stored in the database. As we will show in the experiments, spatially shift-invariant recognition of biological microorganisms can be obtained through the reconstructed volumetric image of an unknown input biological scene.
Fig. 1. Diagram of the approach for 3D sensing, visualization and recognition of microbiological objects using SEOL holographic microscopy, (a) 3D morphology-based recognition, (b) shape-tolerant 3D recognition.
In addition, 3D sensing, imaging, and recognition of biological microorganisms may be achieved by means of computational integral imaging (II). II sensing system can operate with incoherent light to generate multi-view perspectives of a 3D scene by using a micro-lens array #67676 - $15.00 USD
(C) 2006 OSA
Received 1 February 2006; revised 10 April 2006; accepted 10 April 2006
1 May 2006 / Vol. 14, No. 9 / OPTICS EXPRESS 3810
[19,58-70]. The volumetric information of the biological microorganism is reconstructed numerically by ray projection method. The research described in this paper has a number of benefits: 1) the biological microorganisms are analyzed in 3D coordinates and complex magnitude topology; 2) the single-exposure on-line holographic sensor allows optimization of the space bandwidth product of detection as well as robustness to environmental variations during the sensing process; 3) multiple exposures are not required, thus, dynamic biological events can be detected in real-time; 4) a statistical segmentation technique based on complex amplitude reconstructed holographic images is developed; 5) a graph matching technique with Gabor features measures the similarity of 3D morphologies between a reference and unknown input microorganisms; and 6) shape-tolerant 3D microorganism recognition leads to promising recognition performance independent of the geometrical shape of microorganisms. In Section 2, we present a brief overview of SEOL digital holography and its advantages for sensing micro-organic biological events. The segmentation of the complexvalued biological microorganism images using the regional segmentation method is presented in Section 3. Microorganism recognition using 3D complex morphology of the reconstructed images is presented in Section 4. Shape-tolerant recognition technique using statistical inference is presented in Section 5. Spatially shift-invariant recognition of microorganisms is discussed in Section 6. In Section 7, experimental results are demonstrated. The possibility of computational integral imaging for 3D sensing, visualization, and recognition of biological microorganisms is discussed in Section 8. Summary and conclusions follow in Section 9. 2. Overview of SEOL holographic microscopy The block diagram for real-time automated 3D sensing, detection, and recognition of dynamic biological micro-organic events is shown in Fig. 1. The first stage is SEOL holographic sensing and 3D reconstruction. The interference intensity patterns of a microorganism in the Fresnel diffraction field is recorded by the charge-coupled device (CCD) array as shown in Fig 2. A beam splitter divides the laser beam into object and reference waves. The laser beam illuminates the specimen magnified by the microscope objective. The SEOL digital hologram of a microorganism can be generated by the reference wave and the diffracted wave-fronts of the specimen. Our system requires only a single-exposure, therefore SEOL digital holography can be suitable for recognizing a moving 3D object and it is tolerant to external noise factors. The complex field distribution of a microorganism at the hologram plane can be represented as follows: O H ( x, y ) = ∫
d0 +
d0 −
δ 2
δ
2
exp[ j 2πz / λ ] π exp[ j ( x 2 + y 2 )] × jλ z λz
(1)
π 2 2π ⎧ ⎫ (ε + η 2 )] exp[− j ( xε + yη )]dεdη ⎬dz, ⎨∫∫ O (ε , η ; z ) exp[ j λ z λz ⎩ ⎭
where d 0 is the distance between the center of a microorganism and the hologram plane; δ is the microorganism’s depth along z-axis; and O(ε ,η ) is the field distribution of a microorganism at the object plane. The SEOL digital hologram of a microorganism at the hologram plane can be expressed as follows: H ( x, y ) =| O H ( x, y ) + R ( x, y ) |2 − | O H |2 − | R |2 ,
(2)
where the reference beam’s intensity | R |2 is obtained by only a one time measurement on the experiment and the object beam’s intensity | O H |2 can be approximated by means of the local averaging technique [28-33].
#67676 - $15.00 USD
(C) 2006 OSA
Received 1 February 2006; revised 10 April 2006; accepted 10 April 2006
1 May 2006 / Vol. 14, No. 9 / OPTICS EXPRESS 3811
Fig. 2. Experimental setup for recording SEOL digital hologram of 3D microorganisms; Ar: Argon laser, BS1, BS2: beam splitter; M1, M2: mirror; MO: microscope objective; CCD: charge-coupled device array.
The reconstruction of the original microorganism is performed digitally on a computer. The field distribution of the microorganism from SEOL digital hologram can be numerically reconstructed by the inverse Fresnel transformation:
Φ ( x, y)] ,
O(ξ ,η ;τ = d 0 ) = IFrT {H ( x, y )}τ = d0 = A o ( x, y ) exp[ j
o
(3)
where IFrT {} ⋅ denotes the inverse Fresnel transformation. The reconstructed image from the SEOL digital hologram inevitably contains a conjugate image. This undesired component degrades the quality of the reconstructed 3D image, but the intrinsically defocused conjugate image also contains the information of the 3D microorganism. As an additional merit, SEOL digital holography allows us to obtain a dynamic time-varying scene which is digitally reconstructed on the computer for monitoring and recognizing moving and growing microorganisms. 3. Microorganism segmentation using bivariate region snakes A critical step for microorganism identification is the segmentation of reconstructed images, which can facilitate proper detection and recognition. In this section, we address the segmentation of SEOL holographic images of microorganisms using bivariate jointly distributed region snakes [43] which is based on statistically independent region snakes [44, 45]. This technique is built on a statistical framework capable of handling images with complex-valued pixels and the joint probability distribution of magnitude and phase information of the scene. Within this framework, the optimization criterion is computed by maximizing the likelihood function of the target support hypothesis Hw, while no knowledge of the statistical properties of the target/background is assumed as a priori. Instead, a maximum likelihood estimator estimates the necessary statistical parameters. Moreover, target and background pixels are assumed to have independent bivariate Gaussian distribution for their magnitude and phase contents, respectively. This method uses the concept of snake active contours [43-46] for separating the target from the background scene by a target support hypothesis. A snake is essentially a closed contour that can be approximated by a multi-node polygon, which evolves during the #67676 - $15.00 USD
(C) 2006 OSA
Received 1 February 2006; revised 10 April 2006; accepted 10 April 2006
1 May 2006 / Vol. 14, No. 9 / OPTICS EXPRESS 3812
segmentation process to minimize a certain criterion known as the snake energy [46]. This contour divides the image into inner and outer regions which are denoted by Ωt (target) and
Ω b (background), respectively. A stochastic algorithm is utilized to carry out the optimization and guide the deformations of the snake to eventually force the snake contour to converge to the original microorganism boundary [43-45]. There are several advantages for using the bivariate jointly distributed region snake algorithm [43-45]. In fact, the bivariate joint distribution of magnitude and phase information provides a more accurate image model for the reconstructed images of SEOL digital holography since it captures the correlation between each pixel’s magnitude and phase content. That is in contrast with independent distribution analysis, which treats the magnitude and phase information as independent random variables and consequently ignores the correlation of these two correlated random variables. In addition, in region snakes regime, the evolution of the snake contour is not dependent of local pixels near the contour edge as in classic snake active contours [46], but rather, the evolution process is based on the statistical distribution of the complex amplitude inside and outside the snake contour. The latter fact facilitates segmentation of objects even when they are out-of-focus or images with jagged object boundaries. 3.1 Methodology Computational reconstruction of the SEOL hologram obtained from the interference pattern formed on the CCD involves the inverse Fresnel transform. As a result, the reconstructed holographic images have complex-valued pixels, thus each pixel si = αi exp( jϕ i ) is a complex number with α i and ϕ i for its magnitude and phase, respectively. The target and background pixels are assumed to follow two independent bivariate normal distributions. Each distribution has a probability density function which consists of two dependent normal random variables α and ϕ as for magnitude and phase, respectively. The original bivariate normal probability density function is not separable directly. However, conditioning one of the variables ( α ) on the second variable ( ϕ ), one can obtain the separated form of bivariate normal probability distribution function as follows [47]: f u (α i , ϕ i ) =
1
σϕ
u
⎛ ϕi
Φ⎜ ⎜ ⎝
− μϕu
σϕ
u
⎞ 1 ⎟× ⎟ σu α |ϕ ⎠
⎛α i
Φ⎜ ⎜ ⎝
− μαu|ϕ
σ α|ϕ u
⎞ ⎟, ⎟ ⎠
(4)
where Φ (x ) = ( 2π ) −1/ 2 exp( − x 2 / 2) denotes the standard normal distribution. The script u ∈ {t , b} is used to discriminate the target and background respectively. Also, let parameter vector Θu = { μαu , μϕu , σαu , σϕu , ρ u } be the distribution parameters of either the target or the
background. Since the separation of two random variables in Eq. (4) is made possible by conditioning α on ϕ , the corresponding conditional mean and variances can be used for α as follows [47]:
μαu |ϕ = μαu +
ρ uσ αu (ϕ − μϕu ) , u 2 σα |ϕ = σα2 (1 − ρ u2 ). σϕu
(5)
Let w = {wi | i ∈ [1, N ]} be a binary window model that determines the support of the target such that wi=1 for the pixels of target and wi=0 elsewhere, and N is the total number of image pixels. Now the image can be represented as the addition of disjoint target complex pixels (a) inside the binary window w, and background complex pixels (b) outside the window [48,49]. Thus, we adopt the one dimensional representation of the image as: s i = a i wi + bi [1 − wi ] . #67676 - $15.00 USD
(C) 2006 OSA
Received 1 February 2006; revised 10 April 2006; accepted 10 April 2006
1 May 2006 / Vol. 14, No. 9 / OPTICS EXPRESS 3813
With these notations the problem of segmentation reduces to finding an optimal choice for w that maximizes the hypothesis probability P[ H w | s] (i.e. the most likely window w of the target), where H w represents the hypothesis that w is the target support. Using the Bayes rule and considering an equally likely hypothesis scenario, the maximization of a posteriori hypothesis probability is analogous to maximizing the conditional probability which is expressed as the likelihood function for Hw as following: N
N
i =1
i =1
P(s | H w , Θ) = ∏ ft (α i , ϕi ) ⋅ wi × ∏ fb (αi ,ϕi ) ⋅ (1 − wi ),
(6)
where vector Θ = {Θt , Θb } contains all the parameters needed to characterize the bivariate normal distributions of the target and background pixels. Since no prior knowledge of the target and background is assumed, these parameters should be estimated. Thus maximum likelihood estimator has been utilized as following: μˆαu =
∑
1 αi , N u ( w ) i∈Ωu
μˆϕu =
∑
1 ϕi , N u (w ) i∈Ωu
1
∑
∑
1
(7)
⎧ 1 ⎫2 ⎧ 1 ⎫2 σˆα = ⎨ (α i − μαu ) 2 ⎬ , σˆϕu = ⎨ (ϕ i − μαu ) 2 ⎬ , ⎩ N u (w ) i∈Ωu ⎭ ⎩ N u ( w ) i∈Ωu ⎭ 1 ρˆ u = (α i − μαu )(ϕi − μαu ), N u ( w )σαu σϕu i∈Ωu u
∑
where N u (w) denotes the number of pixels in the target or background window according to the script u. By substituting the bivariate joint probability distribution function in Eq. (4) into Eq. (6) and using Eqs. (5) and (7), one can see that maximization of Eq. (6) is analogous to minimization of the following criterion [43]:
(
)
(
)
J (s | H w , Θ) = N t ( w ) log σˆϕt σˆαt 1 − ρˆ t2 + N b ( w ) log σˆϕb σˆαb 1 − ρˆ b2 .
(8)
Minimization of Eq. (8) leads to maximization of the likelihood function in Eq. (6), thus, this optimization forces the snake polygon (representing Hw) to evolve in such a way to find the statistically optimal Hw for the target support. 3.2 Stochastic optimization algorithm
In order to carry out the optimization, a simple stochastic algorithm is employed. The basic idea is to model the snake by a polygon with l constant points and iteratively deform the polygon nodes in such a way that the optimization criterion in Eq. (8) decreases at every iteration. This procedure is illustrated in the following diagram:
w1
J ( w′k +1 , s) J ( w k , s)
w′k +1
w k +1 = w′k +1
w′k +1 Fig. 3: Schematic diagram of the primary stochastic minimization algorithm.
Several techniques such as multi-resolution snake, adaptive node selection and direction inertia are presented in [43] to increase the robustness and convergence speed of the above #67676 - $15.00 USD
(C) 2006 OSA
Received 1 February 2006; revised 10 April 2006; accepted 10 April 2006
1 May 2006 / Vol. 14, No. 9 / OPTICS EXPRESS 3814
algorithm. The algorithm is terminated when no more contraction can be imposed on J(s,w) for long consecutive iterations. 4. 3D complex morphology-based recognition of microorganisms
In this section, we review 3D complex morphology-based recognition of microorganisms [2832]. 3D complex morphology pattern is defined as the complex amplitude of computationally reconstructed holographic images at arbitrary depths. In the following subsections, we present detailed processes of the recognition technique. 4.1 Feature extraction by means of Gabor-based wavelets
It is more efficient to remove unnecessary background for recognition before processing the microorganisms. Threshold-based segmentation is performed using histogram analysis [2832], however more advanced methods such as bivariate region snake in Section 3 can be applied. After the segmentation, images are decomposed and feature vectors are extracted by Gabor-based wavelets. The Gabor-based wavelets have the form of a Gaussian envelope modulated by the complex sinusoidal function [50-52]. The impulse response (or kernel) of the Gabor-based wavelet in 2D discrete domain is defined as: g uv ( x ) =
| k uv |2
σ
2
⎛
exp⎜⎜ − ⎝
2 ⎛ σ | k uv |2 | x |2 ⎞ ⎡ ⎟ ⎢exp( jk uv ⋅ x ) − exp⎜ − ⎜ ⎟ 2 2σ 2 ⎝ ⎠⎣
⎞⎤ , ⎟⎥ ⎟ ⎠⎦
(9)
where x is a position vector; kuv is a wave number vector; and σ is proportional to the standard deviation of the Gaussian envelope. kuv is defined as: kuv = k0u[cosφv sinφv]t, k0u = k0/δu-1, φv = [(v–1)/V]π, u = 1,…,U, and v = 1,…,V, where k0u is the magnitude of the wave number vector; φv is the azimuth angle of the wave number vector; k0 is the maximum carrier frequency of the Gabor kernels; δ is the spacing factor in the frequency domain; U and V are the total numbers of decompositions along the radial and tangential axes, respectively; and the superscript t denotes the matrix transpose. By changing the magnitude and direction of the vector kuv, we can scale and rotate the Gabor kernel to make self-similar forms. The size of the Gaussian envelope is the same in the x and y directions which is proportional to σ / | k uv | . The second term in the square bracket in (9), exp(−σ 2 / 2) , subtracts the DC value so that it has a zero mean response [51]. The Gaborbased wavelets perform band-pass filtering where spatial and orientation frequency bandwidths depend on the size of the Gaussian envelope. The carrier frequency of the band pass filter is determined by kuv. The Gaussian-envelope in the Gabor-based wavelet achieves the minimum space-bandwidth product [50]. It is suitable to extract local features with high frequency bandwidth (small u) kernels and global features with low frequency bandwidth (large u) kernels.
ˆ after it is 2D convolved Let yuv be the filtered output (Gabor coefficients) of the image O with the Gabor kernel guv: y uv ( x, y ) =
∑∑ g Nx Ny
x ′=1 y ′=1
uv
ˆ ( x ′, y ′), ( x − x ′, y − y ′)O
(10)
where Oˆ is the complex amplitude of the segmented image; and Nx and Ny are the size of the ˆ is normalized between 0 image in the x and y directions, respectively. The magnitude of O and 1. A rotation-invariant vector is defined at each pixel. The rotation-invariant property can be achieved by adding up all the Gabor coefficients along the tangential axes of the frequency domain. Thus, we can define the U-dimensional rotation-invariant node vector as: v[ x] = [
∑ y [ x] ⋅ ⋅ ⋅ ∑ y v =1
#67676 - $15.00 USD
(C) 2006 OSA
V
V
1v
v =1
Uv
[x ]]t .
(11)
Received 1 February 2006; revised 10 April 2006; accepted 10 April 2006
1 May 2006 / Vol. 14, No. 9 / OPTICS EXPRESS 3815
4.2 Graph matching technique
The rigid graph matching (RGM) technique [53-56] measures the similarity of 3D complex morphology between a reference microorganism and unknown input samples. The graph is defined as a set of nodes associated in the local area. Let R and S be two identical and rigid graphs placed on the reference image Or and unknown sample image Os, respectively. The location of the reference graph R is pre-determined by the translation vector pr and the clockwise rotation angle θ r . Position vectors of K nodes in the graph R are computed as: ⎡cosθ
sinθ ⎤ ⎥, k = 1,..., K , ⎣ − sin θ cosθ ⎦
x k (p r , θ r ) = Aθ r (x ok − x oc ) + p r , Aθ = ⎢
(12)
where x ok and x oc are, the position vectors of the node k and the center of the graph without any translation and rotation, respectively; and K is the total number of the nodes in the graph. In our database, the reference graph is predetermined in order to represent unique shape features of the microorganism. Assuming the graph R covers a designated shape of the representing characteristic in the reference microorganism, we search the similar local shape by translating and rotating the graph S on unknown input images. A similarity function between the graph R and S is defined as the summation of the normalized inner product of two vectors v R [x k (p r ,θ r )] and v S [x k ( p s ,θ s )] : ΓRS ( p s , θ s ) =
1 K
∑ |||vv [x[x(p(p,θ,θ)])],||||vv [[xx ((pp ,,θθ ])]|||, K
R
k =1
R
k
k
r
r
r
r
S
k
S
s
k
s
s
(13)
s
⋅ stands for the inner product; and v R [x k ( p r , θ r )] and v S [x k ( p s , θ s )] are the node vectors of the graph R in the reference image and the graph S in the unknown input image, respectively. We adopt a difference cost function to improve the discrimination capability between two graphs R and S. The difference cost is defined as the absolute value of the difference between two vectors:
where
C RS ( p s ,θ s ) =
1 K
∑ v [x (p ,θ )] − v [x (p ,θ )] . K
k =1
R
k
r
r
S
k
s
s
(14)
The local area which is covered by the graph S is identified with the reference shape if the following two conditions are satisfied: ΓRS (p s ,θˆs ) > α Γ and C RS (p s ,θˆs ) < α C ,
(15)
where α Γ and α C are thresholds for the similarity function and the difference cost, respectively; and θˆs is obtained by searching the best matching angle to maximize the similarity function at the position vector ps. In this subsection, we utilize graph matching technique for the identification of unknown input objects. However, a training process can be considered as a subsequent stage after the graph matching. In the case of microorganisms, automatic selection of training data by means of the graph matching might be useful when biological samples overlap and/or cluster which make it difficult to select individual objects. More detailed scheme of the automatic feature selection with the training and decision rules can be found in [29,30]. 5. Shape-independent recognition approach
We apply statistical algorithms to the 3D recognition system to make it independent of the shape and profile of the microorganisms [33]. The shape-independent recognition approach may be suitable for recognizing 3D microorganisms such as bacteria and biological objects that do not have well defined shapes or profiles. For example, they may be simple, unicellular and branched in their morphological traits. It could also be applied to cells that vary in shape #67676 - $15.00 USD
(C) 2006 OSA
Received 1 February 2006; revised 10 April 2006; accepted 10 April 2006
1 May 2006 / Vol. 14, No. 9 / OPTICS EXPRESS 3816
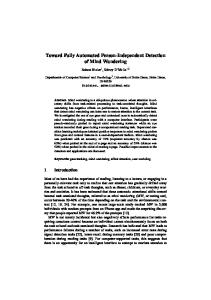
and profile rapidly. For the shape-independent approach, a number of sample segments are randomly extracted from the segmented 3D image of a microorganism. These samples are processed using statistical cost functions to classify the microorganism. The sample distributions for the difference of parameters between the sample segment features of the reference and input images are calculated using statistical estimation. First, we reconstruct the 3D microorganism as a volume image from a SEOL digital hologram corresponding to a reference microorganism. Then, we randomly extract N pixels in the reconstructed 3D image. We repeat the above steps for S specimens of the same class of microorganism. Therefore, each sample segment consists of N by S complex values. We denote each pixel value in the trial sample patch as X SN n [See Fig. 4]. We refer to each reconstruction plane of the 3D volume as “page.” Now, we change the locations of each sample in a given page, and repeat the above steps n times. Similarly, we record the SEOL digital hologram of an unknown input microorganism and then restore the original input image. Next, we randomly extract N pixels n times in the unknown reconstructed 3D image and repeat the above steps about S specimens of the same microorganism. Each sample segment consists of N by S complex values. We have a total of n of these segments as well. We denote each pixel value in the trial sample patch as YNS n [See Fig. 4]. For classification and recognition of biological microorganisms, we use the statistical inference for the equality of the locations and dispersions between reference sample data and unknown sample data using a statistical sampling and estimation theory. We assume that random variables X SN and YNS which are elements inside the reference and unknown input sample segment are statistically independent with identical population distribution f ( X) and f (Y ) , respectively. Also, let X SN be independent of YNS . It is noted that the reconstructed image from a SEOL hologram consists of complex values, so we perform two separate univariate hypothesis testing about the real part and the imaginary part, respectively. From the histogram analysis of the real and imaginary parts of the reconstructed 3D images from the SEOL digital hologram, we may consider that the random variables (real or imaginary parts of the reconstructed image) in the sampling segment nearly follow Gaussian distribution. For checking the normality of sample data, the Ch-square goodness of fit test [57] can be performed. For comparing the variance of two sample segments between reference and input, if the sample data are normally distributed, the following F-test can be used [47,57]: F( NX −1),( NY −1) =
{N Y /( N Y − 1)}V [Y ] Vˆ [Y ] , = {N X /( N X − 1)}V [ X] Vˆ [X]
(16)
where N X and N Y are the number of reference and input sampling segment, respectively; V[⋅] denotes the variance; and Vˆ[⋅] is unbiased sample variance. If the sample data are not normally distributed, we use the following Levene's test [57] by performing an analysis of variance on the absolute deviations of the data from their respective sample: W=
( N X + N Y − 2)[ N X ( Z X − Z )2 + N Y (Z Y − Z )2 ]
∑
NX
(Z Xj − Z X )2 + j =1
∑
NY
( Z Yj − Z Y )2 j =1
,
(17)
where Z • j = Y• j − Y• j ; Y• j is the sample mean of the reference or unknown input; Z • is the sample means of the Z • j ; and Z is the overall mean of the Z • j .
#67676 - $15.00 USD
(C) 2006 OSA
Received 1 February 2006; revised 10 April 2006; accepted 10 April 2006
1 May 2006 / Vol. 14, No. 9 / OPTICS EXPRESS 3817
Fig. 4. The design procedure for shape independent 3D recognition of biological microorganisms. The sampling segments are extracted in the reconstructed 3D image using SEOL digital hologram.
For comparing the means of two sample segments between reference and input image, if the sample data are normally distributed, the following t-test can be used [47,57]: T=
1 E[ X] − E[Y] , VP {( N X )−1 + ( N Y ) −1}1/ 2
(18)
where VP is the pooled estimator of the variance of actual population; and E[⋅] denotes the expectation operator. If the sample data are not normally distributed, we use the following Mann-Whitney test [57] that does not require assumptions about the shape of the underlying distributions by performing an analysis of median from their respective sample: U = N X NY +
N X ( N X + 1) − RX , 2
(19)
where the statistic U is corresponding to the reference image; and R X is the rank sum of the sample data of the reference image. If the sample size is greater than 8, it is known that the statistic U is approximately normally distributed, so Eq. (19) can be Z = (U − μ U ) / σ U , where μ U and σ U are mean and standard deviation of the statistic U, respectively. We also perform Kolmogorov-Smirnov Test (K-S Test) [57] as a distribution-free test for comparison of two populations. The statistic is given by: J = max { FX (u ) − FY (u ) } , −∞< u <∞
(20)
where F• (u ) is the empirical cumulative distribution functions (CDF) of two samples of data. If the p-value calculated from the statistical test in Eqs. (16)-(20) is less than the desired value at a level of significance α , we can reject the null hypothesis H 0 . It is noted that H 0 indicates that there is no statistically significant difference between dispersions (variance), locations (mean) and distribution functions at a given confidence level. #67676 - $15.00 USD
(C) 2006 OSA
Received 1 February 2006; revised 10 April 2006; accepted 10 April 2006
1 May 2006 / Vol. 14, No. 9 / OPTICS EXPRESS 3818
6. Shift-invariant recognition approach
From SEOL digital holographic microcopy, we can reconstruct cross-section images of biological microorganisms along longitudinal direction. These facts enable us to obtain focused images of microorganisms located at the different reconstruction distance as shown in Fig. 5. Applying correlation techniques to the volumetric intensity image of unknown input microorganisms and a reference intensity image, we can recognize the unknown input and find the focused image of it, respectively [24]. These allow the recognition system to be shiftinvariant.
Fig. 5. Coordinate system for the SEOL digital hologram and the shift-invariant 3D recognition of microorganisms.
The cross-correlation function Corr ( x, y, p) between the reference image and the unknown input section images is given by:
{
}
Corr( x, y, p) = FT −1 FT [U X ( x, y, p)]× FT ∗ [U Y ( x, y)] ,
(21)
where FT denotes Fourier transformation; p is a page number; and U X ( x, y, p) and UY ( x, y ) are amplitude filed distributions of the unknown input and reference, respectively. 7. Experiments results 7.1 Segmentation results
In this section some experimental results of the bivariate region snake segmentation described in Section 3 are presented. Computationally reconstructed images of several microorganisms from SEOL holographic microscopy are used. As discussed earlier, bivariate jointly distributed region snake incorporates both the magnitude and phase information simultaneously since the holographic images are complex, however, the magnitude images are used for illustration in the figures hereafter. The snake contour is modeled as a polygon with l vertexes and the binary window function, w, is set to 1 inside and 0 outside the polygon. The images in the first column in Fig. 6(a) shows two different diatom algae over which the snakes are initialized with 4 nodes. Although the initial contour is completely different from target boundaries the bivariate region snake is able to capture the microorganism body after approximately 1500 iterations [See Fig. 6(b)]. As it can be seen in Fig. 6(c), the optimization traces obtain a reasonable slope and show very slight progress after the 1500th iteration which can be an indicator to stop the iterations.
#67676 - $15.00 USD
(C) 2006 OSA
Received 1 February 2006; revised 10 April 2006; accepted 10 April 2006
1 May 2006 / Vol. 14, No. 9 / OPTICS EXPRESS 3819
(a)
(b)
(c)
Fig. 6. (a) Magnitude images of two diatom algae on which the snake is initialized with 4 points, (b) the final segmentation carried out by bivariate region snake after 1500 iterations, (c) the trace of the optimization criterion during the iteration.
In the next example, the segmentation of sphacelaria alga has been illustrated. This alga has a branch-like structure. The initialization captures a small portion of the living organism and throughout the iterations, the snake creeps to capture its whole body. Since the structure of algae requires many snake nodes, and the optimization algorithm’s speed is inversely proportional to the number of snake nodes, more iteration is needed to complete the segmentation. Figure 7(a) is intentionally reconstructed out-of-focus from a SEOL hologram, so it appears blurred without well-defined edges to be more challenging, however, the bivariate region snake shows promising results in Figs. 7(b) and (c).
(a)
(b)
(c)
Fig. 7. (a) Magnitude image of an out-of-focus sphacelaria alga reconstructed from a SEOL hologram and the 5 point snake initialization,. (b) the segmented microorganism, (c) the trace of the optimization criterion during the iteration.
The next experiment in Fig. 8 shows the segmentation of a diatom, where the boundaries of the microorganism are traced by the snake. The introduction of slight structural mutation on the snake results in small peaks in the optimization profile as shown in Fig. 8(d). These structural mutations are imposed by eliminating unnecessary nodes which lie close to the line segment connecting their previous and next nodes. The optimization plot in Fig. 8(d) shows how mutations can help the snake find its way through narrow passages.
#67676 - $15.00 USD
(C) 2006 OSA
Received 1 February 2006; revised 10 April 2006; accepted 10 April 2006
1 May 2006 / Vol. 14, No. 9 / OPTICS EXPRESS 3820
(a)
(b)
(c) (d) Fig. 8. (a) Magnitude image of computationally reconstructed SEOL hologram of diatom algae, (b) segmentation result, (c) the final binary windows w for the target, (d) optimization profile showing mutations as small peaks.
7.2 Experimental results for3D morphology-based recognition
To test the recognition performance, we generate 9 holograms for sphacelaria alga and tribonema aequale alga samples, respectively. We denote 9 sphacelaria alga samples as A1,…,A9 and 9 tribonema aequale alga samples as B1,…,B9. To test the robustness of the proposed algorithm, the position of the CCD is changed during the experiments resulting in different depths for the focused reconstruction image. The samples A1-A3 are reconstructed at 180 mm, A4-A7 are reconstructed at 200 mm, and A8 and A9 are reconstructed at 300 mm and all samples of tribonema aequale (B1~B9) are reconstructed at 180 mm for the focused images.
200
200
200
150
150
150 y
250
y
250
y
250
100
100
100
50
50
50
50
100
150 x
(a)
200
250
50
100
150
200
250
50
100
x
(b)
150
200
250
x
(c)
Fig. 9. Each image is composed of different components of the node vector in Eq. (11) when (a) u = 1, (b) u = 2, (c) u = 3.
#67676 - $15.00 USD
(C) 2006 OSA
Received 1 February 2006; revised 10 April 2006; accepted 10 April 2006
1 May 2006 / Vol. 14, No. 9 / OPTICS EXPRESS 3821
200
200
150
150 y
250
y
250
100
100
50
50
50
100
150
200
250
50
x
200
250
True class False class 200
150
100
50
A1 A2 A3 A4 A5 A6 A7 A8 A9 B1B2 B3 B4 B5 B6 B7 B8 B9
microorganism sample number
(c)
max. similarity and min. difference
(b)
250
number of detection
150 x
(a)
0
100
1.6 1.4
simlarity difference
1.2 1 0.8 0.6 0.4 0.2
A1A2A3A4A5A6A7A8A9B1B2B3B4B5B6B7B8B9
microorganism sample number
(d)
Fig. 10. Recognition of sphacelaria alga, (a) reference sample A1 with the graph R, (b) graph matching result of unknown input sample A9, (c) number of detections, (d) maximum similarity and minimum difference cost, (a) and (b) are presented by contrast reversal for better visualization.
Magnitude and phase parts of computationally reconstructed complex images are cropped and reduced into images with 256 × 256 pixels by the reduction ratio 0.25. During the segmentation, we assume less than 20% of the lower magnitude region of the complex image is occupied by the microorganisms and the magnitude of the microorganisms is less than 45% of the background diffraction field. The parameters for Gabor-based wavelets are set as: σ = π, k0 = π/4, δ = 2 , U = 3, and V = 6. Figure 9 shows the node vector components when u = 1, 2, and 3. Only real parts of yuv in Eq. (10) are used for the feature extraction. To recognize two filamentous objects which have different thicknesses and distributions, we select two different reference graphs and place them on the sample A1 and B1. A rectangular grid is selected as a reference graph for the sphacelaria alga which shows regular thickness in the reconstructed images. The reference graph is composed of 25×3 nodes and the distance between nodes is 4 pixels in the x and y directions. Therefore, the total number of nodes in the graph is 75. The reference graph R is placed with pr = [81 75]t and θ r =135° in the sample A1 as shown in Fig. 10(a). The threshold α Γ which is set at 0.6 is only used. The threshold is selected heuristically to produce better results.
#67676 - $15.00 USD
(C) 2006 OSA
Received 1 February 2006; revised 10 April 2006; accepted 10 April 2006
1 May 2006 / Vol. 14, No. 9 / OPTICS EXPRESS 3822
200
200
150
150 y
250
y
250
100
100
50
50
50
100
150
200
250
50
x
True class False class
30
20
10
A1A2A3A4A5A6A7A8A9B1B2B3B4B5B6B7B8B9
microorganism sample number
(c)
max. similarity and min. difference
number of detection
200
250
(b)
50
0
150 x
(a)
40
100
1.4 simlarity difference
1.2 1 0.8 0.6 0.4 0.2 0
A1A2A3A4A5A6A7A8A9B1B2B3B4B5B6B7B8B9
microorganism sample number
(d)
Fig. 11. Recognition of tribonema aequale alga, (a) reference sample B1 with the graph R, (b) graph matching result of unknown input sample B2, (c) number of detections, (d) maximum similarity and minimum difference cost, (a) and (b) are presented by contrast reversal for better visualization.
Considering the computational load, the graph S is translated by every 3 pixels in the x and y directions for measuring the similarity and difference to the graph R. To search the best matching angles, the graph S is rotated by 7.5° from 0 to 180° at every translated location. When the positions of rotated nodes are not integers, they are replaced with the nearest neighbor nodes. Figure 10(b) shows another sphacelaria alga sample (A9) for the input image with the graph matching results. The reference shapes are detected 65 times along the filamentous objects. Figure 10(c) shows the number of detections for 9 true-class and 9 falseclass samples. The detection number for A1~A9 varies from 27 to 220 showing strong similarity between the reference sample (A1) and the input samples (A2~A9) of the true-class microorganism. There is no detection found in the samples B1~B9 which are the false-class microorganisms. Figure 10(d) shows the maximum similarity and the minimum difference cost for all samples. To recognize tribonema aequale alga, a wider rectangular grid is selected to identify its thin filamentous structure. The reference graph is composed of 20×3 nodes and the distance between nodes is 4 pixels in the x direction and 8 pixels in the y direction, therefore, the total number of nodes in the graph is 60. The reference graph R is placed with pr = [142 171]t and θ r = 90° in the sample B1 as shown in Fig. 11(a). The thresholds α Γ and α C are set at 0.8 and 0.7, respectively. Figure 11(b) shows another sample (B2) of the true-class input image with the graph matching results. The reference shapes are detected 30 times along the thin filamentous object. Figure 11(c) shows the number of detections for 9 true-class and 9 falseclass microorganisms. The detection number for the true-class samples B1~B9 varies from 6 to
#67676 - $15.00 USD
(C) 2006 OSA
Received 1 February 2006; revised 10 April 2006; accepted 10 April 2006
1 May 2006 / Vol. 14, No. 9 / OPTICS EXPRESS 3823
49. Four false detections are found in one of the false-class samples A8. Figure 11(d) shows the maximum similarity and the minimum difference cost for all samples. 7.3 Experimental results for shape-tolerant and shift-invariant 3D microorganism recognition
In this subsection, we conduct statistical estimation and inference to test the performance of our shape tolerant 3D microorganism recognition system using SEOL digital holography. First, 100 trial sampling segments are produced by randomly selecting the pixel values in the segmented oscillatoria bacteria 3D image as the reference microorganism, where we change the size of each trial sampling segment 30, 100, and, 200. We apply Sobel edge-detection method to the segmented 3D images.
(a)
(b)
Fig. 12. The magnified intensity images at the distance d = 270 mm of microorganisms by use of a 100 × microscope objective, (a) oscillatoria bacteria, (b) diatom alga.
Similarly, a number of sampling segments are randomly selected in the oscillatoria bacteria 3D image as the true-class inputs and in the diatom alga image as the false-class inputs. We produced 100 true-class and 100 false-class input sampling segments, respectively. The reference and input images are reconstructed at distance d = 270 mm as shown Fig 12. Table 1(a) shows experimental results of F-test for comparing the variances between reference and unknown input. As shown in Table 1(a), it is noted that the average p-value for the true-class input are around 0.4534 and 0.5166 in the real and imaginary parts at the sample size 100, respectively and for the false-class input are around 0.0080 and 0.0226. Table 1(b) shows the results of the Levene's test for the difference of scale parameters between the reference and input. It is noted that average p-value for the true-class input are around 0.7068 and 0.6856 in the real and imaginary parts at the sample size 100, respectively, and for the false-class input are around 0.0688 and 0.0156, respectively.
#67676 - $15.00 USD
(C) 2006 OSA
Received 1 February 2006; revised 10 April 2006; accepted 10 April 2006
1 May 2006 / Vol. 14, No. 9 / OPTICS EXPRESS 3824
Table 1. (a) F-test (normal distribution). (b) Levene’s test (any continuous distribution) for the equality of the dispersion parameter between two sampling segments versus a sample size.
(a)
(b)
Table 2. (a) T-test (normal distribution) for the equality of the location parameter. (b) Mannwhitney test (nonparametric) for comparing the median between two sampling segments versus a sample size.
(a)
(b)
#67676 - $15.00 USD
(C) 2006 OSA
Received 1 February 2006; revised 10 April 2006; accepted 10 April 2006
1 May 2006 / Vol. 14, No. 9 / OPTICS EXPRESS 3825
Table 3. K-S test (distribution-free) for comparing the cumulative distribution between two sampling segments versus a sample size.
The experimental result of T-test for comparing the mean between the reference and input is shown in the Table 2(a). It is noted that average p-value for the true-class input are around 0.5530 and 0.5677 in the real and imaginary parts at the sample size 200, respectively and for the false-class input are around 0.2141 and 0.5009, respectively. Table 2(b) shows the results of nonparametric test for the difference of the median between the reference and input. It is noted that average p-value for the true-class input are around 0.5336 and 0.5626 in the real and imaginary parts at the sample size 200, respectively and for the false-class input are around 0.3092 and 0.5067, respectively. Table 3 shows the experimental result of distributionfree test for a comparison of two populations. The average maximum difference between the cumulative distributions for the true-class input are around 0.0710 and 0.0770 in the real and imaginary parts at the sample size 200, respectively and for the false-class input are around 0.1320 and 0.1240, respectively. We calculate the correlation coefficient between the diatom alga image reconstructed at d = 400 mm as reference and unknown input image to test the shift-invariance of our recognition system, where we move the longitudinal position of microorganism using xytranslation stage. As shown in Fig 13, we obtain the correlation peak at the reconstruction distance around 270 mm for the true-input class, but for the false-class input the correlation value is less than around 0.1.
Fig. 13. Experimental result of correlation coefficient calculated between the intensity image of reference and the volume intensity image of unknown input versus reconstruction distance.
#67676 - $15.00 USD
(C) 2006 OSA
Received 1 February 2006; revised 10 April 2006; accepted 10 April 2006
1 May 2006 / Vol. 14, No. 9 / OPTICS EXPRESS 3826
7.4 Discussion of real- time processing
For real-time application, computational complexity should be considered. Since SEOL holography requires a single-exposure, real-time sensing is possible. For computational reconstruction of holographic images, the computational time is of the same order of fast Fourier transformation (FFT) which is O(N) = Nlog2N, where N is the total number of pixels in the holographic image. Therefore, with high speed electronics, it is possible to have realtime detection. For the segmentation using bivariate region snakes, the optimization of the cost function in the snake segmentation is carried out by the stochastic algorithm [43]. The computational complexity of the process depends on several parameters including the image size, number of polygon vertexes, the step size, and the initial position of the snake contour. However, due to the small deformation of the contour between successive iterations, it is possible to use the computed statistical information from previous iterations along with the pixel information inside the deformation area to derive the exact current statistical information needed [43]. The simulations for this work are implemented on a PC with Intel Pentium IV processor taking sometime between 1 and 10 seconds for the final results. It should be noted that a dedicated hardware can improve this speed dramatically. For the morphology-based recognition, the computational time of the Gabor filtering is of the same order as FFT. For the graph matching, the computational time depends on the shape and the size of the graph, the dimension of the feature vector, and searching steps for the translation vector and the rotation angle. Since the most time consuming operation results from searching the graphs, that is O(N) = N2, the system requires quadratic computational complexity. For the shift-invariant recognition approach, the cross-correlation function can be obtained with the same order of FFT. Therefore, real-time processing can be achieved by developing a specialized hardware or parallel processing. 8. 3D visualization and recognition using integral imaging
In this section, we present a brief discussion of 3D sensing and visualization of biological microorganisms using integral imaging (II) [19,58-70] which can be used for identification using the algorithms presented in this paper. In contrast to holography, II requires incoherent illumination to record the information of a 3D scene. II is a promising technique based on recording the multi-view directional information of 3D scene. A micro-lens array projects the 3D scene onto a detector array generating a set of elemental images. Captured micro-objects have different perspective and location information in each elemental image. The scene in II can be illuminated under ambient or incoherent light. Reconstruction is the reverse of the sensing process. In computational reconstruction, the elemental images are numerically projected through a virtual lens array to reproduce the original 3D object by means of geometrical ray projection method [66-68]. Therefore, volumetric scenes can be reconstructed at different longitudinal distances. Computational reconstruction of II can improve the image quality degradation caused by optical devices [68]. There are several advantages in 3D object recognition using II. One advantage is that II allows multiple perspectives imaging by a single shot. The depth and perspective information in the multiple perspective imaging can be utilized to build a compact 3D recognition system. The other advantage is that II is a passive sensor using incoherent light. Indeed, computational II reconstructs volumetric scenes at different depths, and we are able to recognize objects of interest located at different longitudinal distances.
#67676 - $15.00 USD
(C) 2006 OSA
Received 1 February 2006; revised 10 April 2006; accepted 10 April 2006
1 May 2006 / Vol. 14, No. 9 / OPTICS EXPRESS 3827
Mirror
Lens
Camera
Micro-lenslet array
Stage Specimen Light source Fig. 14. Experimental setup for 3D II recording of microorganisms
The experimental system uses a micro-lens array, and a pick-up camera as shown in Fig. 14. A filamentous microorganism, sphacelaria alga with a size of 50~100 μm is used in the experiments. A set of elemental images is captured with one exposure. Reconstructed microorganisms images at different depths (d) are shown in Fig. 15.
(a)
(b)
Fig. 15. Reconstructed volumetric images of sphacelaria alga at different depths, (a) d = 214 μ m, (b) d = 290 μm.
9. Summary and conclusions
Automatic recognition of biological microorganisms is very challenging because of their strong resemblance and dynamic nature such as moving, growing, and varying in size and shape. There are broad applications of real-time 3D surveillance and identification of dynamic microscopic bio-organic events. This paper is an overview of techniques for 3D sensing, imaging, segmentation, and recognition of biological microorganisms including SEOL holographic microscopy. 3D sensing and reconstruction by means of SEOL holographic microscopy is suitable for inspection of dynamic biological microscopic events. The sensing stage is robust to dynamic movement of microscopic objects and environmental conditions as compared with the multiple-exposure phase-shifting digital holography. The setup of SEOL digital holography is simpler than off-axis holography and more robust to object size and scale variations. A number of approaches are presented for the recognition of the biological microorganisms. Segmentation extracts regions of interest for further processing. A number of techniques are discussed for segmentation of biological microorganisms sensed by SEOL #67676 - $15.00 USD
(C) 2006 OSA
Received 1 February 2006; revised 10 April 2006; accepted 10 April 2006
1 May 2006 / Vol. 14, No. 9 / OPTICS EXPRESS 3828
holographic microscopy. In particular, bivariate jointly distributed region snake is developed as a statistical segmentation method maximizing the conditional probability of the target hypothesis assuming the joint Gaussian distribution for the complex amplitude pixels. One 3D recognition approach examines the simple morphological traits comprising the complex amplitude of biological microorganisms. Feature extraction by Gabor-based wavelets and graph matching technique are used to localize the specific 3D shape of reference microorganisms. A scheme of automated feature vector selection is claimed. Experimental results for graph matching technique are presented. Shape-tolerant 3D recognition of microorganisms using the statistical cost functions and inference is presented. A number of sampling segments are randomly extracted from the microorganism and processed with cost functions and statistical inference theory. By investigating the Gaussian property of the holographically reconstructed images of microorganisms, we are able to distinguish the sampling segments of the true-class object in the database from the different classes of microorganisms presented at the input. Using SEOL digital holographic microcopy, we can numerically reconstruct focused sectional images of biological microorganisms along longitudinal direction. We have shown by experiments that spatially shift-invariant recognition of biological microorganisms can be obtained throughout the reconstructed volumetric image of input biological scene. In addition, 3D sensing and imaging of biological microorganisms might be achieved by means of computational II and followed by recognition algorithms. II records multi-view perspectives of 3D microorganisms by using a micro-lens array. The volumetric information of the biological microorganism can be numerically reconstructed by ray projection method. The volumetric reconstruction allows us to search the microorganisms in 3D space. We have presented several different approaches and image processing techniques based on SEOL holography for 3D segmentation and recognition of biological microorganisms. Although these techniques are applied separately to different classes of microorganisms, the combination of these techniques may enhance the performance for the sensing, segmentation, and identification of unknown microorganisms. Acknowledgments
This work has been supported by Defense Advanced Research Projects Agency (DARPA). We wish to thank Dr. Seung-Hyun Hong for his assistance.
#67676 - $15.00 USD
(C) 2006 OSA
Received 1 February 2006; revised 10 April 2006; accepted 10 April 2006
1 May 2006 / Vol. 14, No. 9 / OPTICS EXPRESS 3829