Reactive Data Visualizations Curran Kelleher, Haim Levkowitz Computer Science Department University of Massachusetts Lowell, USA https://github.com/curran/portfolio http://www.cs.uml.edu/˜haim/
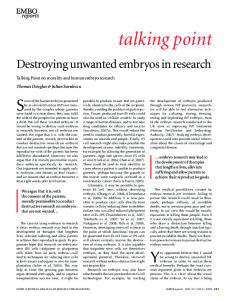
Fig. 1.
The data flow graph for a reactive bar chart based on reactive models, the core contribution of this paper.
Abstract—Managing complex data flows and update patterns is one of the most difficult challenges in interactive data visualization. For example, constructing interactive visualizations with multiple linked views can be a daunting task. Functional reactive programming provides approaches for declaratively specifying data dependency graphs and maintaining them automatically. We argue that functional reactive programming is an appropriate and effective abstraction for interactive data visualization. We demonstrates the effectiveness of our proposed approach in several visualization examples including multiple linked views. We also provide a catalog of reusable reactive visualization components. Keywords-multiple linked views; interaction technques; information visualization;
I. I NTRODUCTION Constructing interactive visualizations is a complex task. The task becomes even more complex when multiple visual-
izations are presented and linked together through interactions. The issue at the core of interactive visualization and linked views is management of complex data flows and update patterns. Even with the wealth of visualization toolkits and libraries that exist today, there is a need for an abstraction that addresses these core issues. The contribution of this paper is a novel approach for developing reusable interactive visualization components using concepts from functional reactive programming. II. R ELATED W ORK The first attempt at a systematic formalization of data visualization was Jacques Bertin’s “Semiology of Graphics” [1]. In this work, Bertin relates data types to visual marks and channels in a coherent system that takes visual perception into account. Bertin’s work has influenced many future theoretical
underpinnings of visualization, including Leland Wilkinson’s “Grammar of Graphics” [2] and Jock Mackinlay’s APT (A Presentation Tool) system [3], which led to the development of the commercial visualization package Tableau [4]. Interactions within data visualization environments have been well studied. Becker et al. investigated brushing in scatter plots [5]. Shneiderman et al. explored dynamic queries in general and how these operations fit into a larger context of visual information seeking [6]. Ward introduced a visualization system based on multiple linked views with direct manipulation techniques including brushing and linking [7]. Anselin discussed how interactive visualization systems with linked views can be applied to Geographic Information Systems [8]. Yi et al. conducted a thorough survey of existing taxonomies for visualization and interactions and developed a set of generalized classes of interactions for visualization [9]. Much work has been done regarding interactive visualization of data cubes. Stolte et al. introduced a formalism for defining multi-scale visualizations of data cubes throughout their work on the Polaris system [10] [11] [12]. Cuzzocrea et al. surveyed the area of data cube visualization in depth [13]. Mansmann coined the term “Visual OLAP”, framed it as a fundamentally new paradigm for exploring multidimensional aggregates [14]. Scotch et al. developed and evaluated SOVAT, a Spatial OLAP visualization and analysis tool applied to community health assessments [15] [16]. Several interactive “Big Data” visualization systems have been introduced [17] [18]. Techapichetvanich et al. explored how visualization interactions pertain to data cubes in particular [19]. Sifer et al. introduced a visual interface utilizing coordinated dimension hierarchies for OLAP cubes [20]. Interactions within data visualization environments have been well studied. Becker et al. investigated brushing in scatter plots [5]. Shneiderman et al. explored dynamic queries in general and how these operations fit into a larger context of visual information seeking [6]. Ward introduced a visualization system based on multiple linked views with direct manipulation techniques including brushing and linking [7]. Anselin discussed how interactive visualization systems with linked views can be applied to Geographic Information Systems [8]. Yi et al. conducted a thorough survey of existing taxonomies for visualization and interactions and developed a set of generalized classes of interactions for visualization [9]. The World Wide Web has evolved to become a full fledged application development platform. HTML5 is the latest set of standards and APIs (Application Programming Interfaces) from the World Wide Web Consortium that define the capabilities of modern Web browsers [21]. HTML5 applications are able to run across multiple platforms (albeit requiring some effort from developers). HTML5 has eclipsed Java Applets and Flash in fulfilling the dream of “write once, run anywhere”. HTML5 contains three graphics technologies that can support interactive Web-based visualizations: Canvas, SVG (Scalable Vector Graphics), and WebGL. D3.js is a flexible and powerful visualization library that uses SVG and has a strong community of users [22]. D3 at
its core is a DOM manipulation library with heavy use of functional programming. D3 allows concise declarative statements to define the core logic of visualizations. D3 provides additional APIs for performing common visualization tasks such as defining and using scales, generating labeled axes, and computing layouts from graphs and trees. D3 is at the center of a vibrant developer ecosystem and has seen wide adoption in industry. There are plentiful examples of D3.js usage for creating visualizations. Many supporting libraries have been created including NVD3 reusable charts, Chart.js for composing visualization elements, Crossfilter.js for interactive multidimensional filtering, and DC.js for multiple linked views. Interactive data visualizations can be linked together such that interactions in one visualization cause updates in another visualization. This technique is referred to as “multiple linked views” [23] and “brushing and linking” [24], [25]. This technique overcomes limitations of single visualizations by supporting exploration of the data through interaction. More information can be presented to the user with multiple linked views as compared to static visualizations. Dynamic queries, a technique related to multiple linked views, allow the user to interactively define query parameters used for generating the input data for a visualization [6]. The Model View Constroller (MVC) architecture is a long standing best practice for organizing complex applications [26]. The MVC architecture was first introduced as part of the Smalltalk-80 system for building user interfaces [27], and has been used extensively for Web application development [28]. Several authors describe how the MVC architecture can be applied to visualizations with multiple linked views [29], [30], [31], [32]. Functional reactive programming provides techniques for declaratively specifying reactive data dependency graphs [33]. Elliott et al˙applied functional reactive programming to animation [34]. Hudak et al˙applied functional reactive programming to robotics [35]. Data flow is a concept related to functional reactive programming in which developers can specify directed graphs of data transformations [36]. The KNIME data analysis environment uses a data flow model as its primary abstraction [37]. III. R EACTIVE M ODELS In this section we describe a novel way to combine elements of functional reactive programming with the Model View Controller (MVC) paradigm to create what we call reactive models. These reactive models can serve as a foundation for reusable interactive visualization components. This approach overcomes limitations of traditional MVC frameworks, and is simpler than using a full blown functional reactive programming framework. The Model View Controller paradigm can be combined with functional reactive programming to enable straightworward creation of reactive systems based on data flow graphs. In this section we introduce a novel and simple approach for implementing reactive models.
The Model in the Model View Controller (MVC) paradigm is responsible for: • • •
managing the state of the application, allowing the Controller to change the state of the application, and notifying the view when the state of the application changes.
One simple and widely used method for structuring a Model is as a set of key-value pairs [28]. This kind of model can fulfill the all of the responsibilities of a Model with three methods: • • •
set(key, value) Set the value for a given key. get(key) Get the value for a given key. on(key, callback) Add a change listener for a given key. Here, callback is a function that will be invoked synchronously when the value for the given key is changed.
We first discuss a simple model with only set and get methods (SimplestM odel), then discuss a more complex version that also includes on (SimpleM odel), then finally introduce a reactive model that includes the when operator from functional reactive programming (M odel).
A. Simplest Model
1 SimpleM odel = λ() 2 values = { } 3 callbacks = { } 4 return 5 on : λ(key, callback) 6 if callbacks[key] == NIL 7 callbacks[key] = [ ] 8 callbacks[key].push(callback) 9 set : λ(key, value) 10 values[key] = value 11 if callbacks[key] 6= NIL 12 for callback ∈ callbacks[key] 13 callback() 14 get : λ(key) return values[key] The above version includes an additional private variable, callbacks, which is an object whose keys are property names and whose values are arrays of callback functions. The on method defined starting at line 5 adds the given callback to the list of callbacks for the given key (and creates the list if it does not yet exist). The set method has been modified to invoke the callback functions associated with the given key when the value for that key is changed. Here is an example of how the on method can be used. 1 2 3 4 5 6
mySimpleM odel = SimpleM odel() mySimpleM odel.on(’x’, λ() log(mySimpleM odel.get(’x’)) ) mySimpleM odel.set(’x’, 5) // Causes line 3 to log 5 mySimpleM odel.set(’x’, 6) // Causes line 3 to log 6
C. Functional Reactive Model 1 2 3 4 5
SimplestM odel = λ() values = { } return set : λ(key, value) values[key] = value get : λ(key) return values[key]
The above pseudocode implements a key-value model that has only set and get methods. Line 1 defines the constructor function, SimplestM odel, which will return a new object that has set and get methods. Line 2 defines a private variable called values that will contain the key-value mapping. Lines 3 - 5 define the set and get methods, which store and retreive values from the internal values object. Here’s an example of how SimplestM odel might be used. 1 2 3
mySimplestM odel = SimplestM odel() mySimplestM odel.set(’x’, 5) mySimplestM odel.get(’x’) // Evaluates to 5
B. Simple Model Here is a version of the model that implements the on method as well:
For complex applications such as interactive visualizations, managing propagation of changes can quickly become complex. For this reason, modular visualization environments based on data flow have become popular [38]. A data flow graph defines a directed acyclic graph of data dependencies. The data flow model is amenable to construction of visual programming languages [39]. While many systems consider data flow as a means to construct data transformation pipelines, the concept also applies to building reactive systems that manage change propagation throughout an application or subsystem in response to user interactions or other events [34]. To provide a solid foundation for dynamic visualization systems, the Model should be able function in the context of data dependency graphs. Developers should be able to declaratively specify data dependencies, and change propagation should be automatically managed. The when operator from functional reactive programming propagates changes from one or more reactive functions (such as is found in the JavaScript libraries Bacon.js and RXJS). Our Model implementation can be extended with a when operator that enables construction of data dependency graphs. This operator will become a foundation for building dynamic interactive visualizations. Since when is superior to on in that it handles change propagation intelligently, in this final version
the the function returns TRUE (on line 5). We are now ready to define our model that includes the when operator.
Fig. 2. A basic reactive model that computes the full name whenever either the first name or last name changes. The reactive function is defined using the when operator.
on is not exposed in the public Model API. Adding when depends on having some utility functions available, debounce and allAreDef ined. 1 2 3 4 5 6 7 8 9
debounce = λ(callback) queued = FALSE return λ() if queued = = FALSE queued = TRUE run(λ() queued = FALSE callback() )
The debounce(callback) function returns a function that, when invoked one or more times in a single codepath, will queue the given callback function to execute only once on the next tick of the event loop. This has the effect of collapsing multiple sequential calls into a single call. The returned function is referred to as the “debounced” function. The debounce function defined starting on line 1 creates a closure with a boolean variable queued (instantiated on line 2) that keeps track of whether or not the callback function is currently queued to execute in the future. When the debounced function (defined starting on line 3) is called the first time, the condition on line 4 evaluates to TRUE. This causes queued to be set to TRUE (on line 5) and also causes the function defined starting on line 6 to be queued to run in the future. This uses the built-in function run that queues a function to execute on the next tick of the event loop. When the debounced function is invoked multiple times in the same code path, the condition on line 4 evaluates to FALSE, and nothing happens. When the current code path terminates and the queued function is invoked, queued is set to FALSE (on line 7) and the callback function is invoked. 1 2 3 4 5
allAreDef ined = λ(array) for item ∈ array if item == NIL return FALSE return TRUE
The function allAreDef ined(array) checks if all values in the given array are defined. It does so by comparing each item in the array to the special value NIL. As soon as one item is found to be NIL, the function returns FALSE (on line 4). If all items have been checked and none are found to be NIL,
1 M odel = λ() 2 simpleM odel = SimpleM odel() 3 return 4 set : simpleM odel.set 5 get : simpleM odel.get 6 when : λ(dependencies, f n) 7 callF n = debounce(λ() 8 args = dependencies.map(simpleM odel.get) 9 if allAreDef ined(args) 10 apply(f n, args) 11 ) 12 callF n() 13 for key ∈ dependencies 14 simpleM odel.on(key, callF n) IV. R EACTIVE V ISUALIZATIONS In this section we discuss how our reactive model construction can serve as a foundation for interactive visualizations. We also show how reactive models can be linked together at a higher level to form interactive visualizations with linked views. Interactive visualizations must respond to changes made by users such as resizing of the display, changes in the data driving the visualization, changes in configuration, and updates from other visualizations in a linked view context. We introduce reusable reactive visualization components, shown in table I, and show how they can be composed to form interactive visualizations and linked views. A. Visualization Primitives Consider visualizations such as the bar chart, line chart, stacked area chart, parallel coordinates and choropleth map. These visualizations share many underlying primitives such as scales, axes, margins and labels [22]. Interactive forms of these visualizations also share interaction techniques for selecting visual marks such as rectangular brushing, hovering, clicking, panning and zooming. These visualization primitives can be encapsulated as data dependency subgraphs within reactive models which we call components. Property names serve as the common elements between components. Below is a listing of the property names used in one or more components and a description of each: • data The relation to be visualized. • xAttribute The attribute within the data relation mapping to the X Axis. • xScale The scale (domain and range) for the X axis. • xScaleType Determines whether xScale is a linear, logarithmic or ordinal scale. • xAxis The visible X axis (tick marks and labels). • xAxisLabel The X axis label text. • yAttribute The attribute within the data relation mapping to the Y Axis. • yScaleType Determines whether yScale is a linear, logarithmic or ordinal scale.
TABLE I R EUSABLE REACTIVE VISUALIZATION COMPONENTS . Component margin
Diagram
Description Computes the size of the inner visualization rectangle based on the container size (which may change when the user resizes the visualization) and the configured margin.
xScale
Computes the X scale. The domain is computed from the input data by evaluating the X attribute bounds. The range is computed from the inner visualization width.
xAxis
Renders the X Axis (the center line, tick marks and tick labels) from the X scale.
xAxisLabel
Renders the text label for the X Axis.
yScale
Computes the Y scale. The domain is computed from the input data by evaluating the Y attribute bounds. The range is computed from the inner visualization width.
yAxis
Renders the Y Axis (the center line, tick marks and tick labels) from the Y scale.
yAxisLabel
Renders the text label for the Y Axis.
colorScale
Computes the color scale. The domain is computed from the input data by evaluating the set of unique values foun in the color attribute.
yScale The scale (domain and range) for the Y axis yAxis The visible Y axis (tick marks and labels). • yAxisLabel The Y axis label text. • colorAttribute The scale used to determine color of visual marks. • colorScale The scale used to determine color of marks. • box An (x, y, width, height) tuple specifying the outer bounds of the visualization in pixels • margin A (top, bottom, lef t, right) tuple specifying the visualization margin • width The width of the inner visualization rectangle inside the margin • height The height of the inner visualization rectangle inside the margin • yAxis The visible Y axis (tick marks and labels) • yTitle The Y axis title text Table I shows a listing of components that can be combined to easily generate a foundation for a variety of interactive visualizations. These components encapsulate reactive data dependency subgraphs that implement the visualization primitives necessary for interactive visualizations. Figure shows how several of these components can be assembled to create a general-purpose reactive bar chart. Our approach in the bar chart example is to use a configuration file that allows users or developers to configure the visualization. Note also that interactive user interface components could be linked with any configurable model property. This makes it straightforward to add interactivity to reactive visualizations and enables construction of linked views in which interactions in one visualization sets model • •
Fig. 3. A visualization of the Iris data set [40] using linked views, powered by reactive visualization components. Brushing to select records in the scatter plot causes the selected data to be aggregated and displayed in the bar chart.
properties on another visualization. Figure 3 shows an example of linked views using our approach. Here we are using a scatter plot with brushing interaction assembled using reusable components in a similar fashion to the bar chart shown in figure . figure 4 shows the overall flow of the linked scatter plot and bar chart. The brushing interaction sets a property on the reactive scatter plot called selectedData. A reactive function that aggregates the selected data by Iris species links the selected data to the input data of the bar chart. Whenever the user brushes to select a new set of records in the scatter plot, the bar chart updates immediately to show only the selected data. V. C ONCLUSION In this paper we introduce a novel way to combine elements of functional reactive programming with the Model View
Fig. 4. The (simplified) data flow graph for our linked scatter plot and bar chart example.
Fig. 5. A visualization of the Cars data set [41] by a reactive component that renders an HTML table style using Twitter Bootstrap [42].
Controller (MVC) paradigm to create what we call reactive models. These reactive models allow developers to declaratively specify data dependency graphs. This kind of abstraction is well suited for developing interactive visualizations because it drastically simplifies management of complex data flows and update patterns. We introduced a set of reusable data dependency subgraphs for interactive visualization we call components. These components encapsulate reactive flows involving visualization primitives such as margins, scales and axes. We demonstrated how these components can be composed for generating a reusable bar chart. We also demonstrated how these components can be used for assembling visualizations with multiple linked views. VI. F UTURE W ORK Future directions for this work will focus on developing a catalog of reusable visualization components, coupling the data to currently available public data sources, developing visualization-centric user interfaces and collaboration. So far we have applied our technique to bar charts and scatter plots only, however we intend to also support the following visualizations: • Table - Work on this has been done linking data to a dynamic HTML table (see figure ??). • Color Legend • Line Chart • Pie Chart • Choropleth Map • Parallel Coordinates • Heatmap • Stacked Bar Chart • Stacked Area Chart • Streamgraph • TreeMap • Force Directed Graph Layout
On the visualizations where it is appropriate, we plan to develop reusable components for the following interaction techniques: • Brushing - Dragging to interactively define a selection rectangle. • Picking - Selecting a single visual mark by clicking or tapping on it. • Details-on-demand - A pattern of linked view composition in which an overview visualization can be used as navigation for a detailed view. This is a fundamental concept in interactive information visualization [43]. We hope to develop a user interface for quickly assembling reusable components together based on graph drawing. This user interface would show the data dependency subgraphs shown in the diagrams of this paper, but they would be dynamic and editable. Another direction we have started working on is integrating external user interface components such as traditional list selections, drop down menus, and radio buttons. One example of this concept is shown in figure 5, which shows how reactive models can provide reactive HTML tables that can be linked with interactive visualizations. This would help in constructing intuitive user interfaces for manipulating the configuration of visualizations. An open source proof of concept implementation of our reactive visualization approach is available on GitHub. These projects contain the source code that generated figures 3 and 5. The GitHub pages also link to live demos you can try out yourself. The reactive model implementation is available at github.com/curran/model, and the reactive visualization components are available at https://github.com/curran/reactivis. ACKNOWLEDGMENT The authors would like to thank Professor Jesse Heines of University of Massachusetts and Professor Rosane Minghim of University of Sao Paulo, Sao Carlos - SP, Brazil for giving constructive feedback throughout the development of this work. R EFERENCES [1] J. Bertin, “Semiology of graphics: diagrams, networks, maps,” 1983. [2] L. Wilkinson, The grammar of graphics. Springer, 2005. [3] J. Mackinlay, “Automating the design of graphical presentations of relational information,” ACM Transactions on Graphics (TOG), vol. 5, no. 2, pp. 110–141, 1986. [4] P. Hanrahan, C. Stolte, and J. Mackinlay, “visual analysis for everyone,” Tableau White paper, vol. 4, 2007. [5] R. A. Becker and W. S. Cleveland, “Brushing scatterplots,” Technometrics, vol. 29, no. 2, pp. 127–142, 1987. [6] B. Shneiderman, “Dynamic queries for visual information seeking,” Software, IEEE, vol. 11, no. 6, pp. 70–77, 1994. [7] M. O. Ward, “Xmdvtool: Integrating multiple methods for visualizing multivariate data,” in Proceedings of the Conference on Visualization’94. IEEE Computer Society Press, 1994, pp. 326–333. [8] L. Anselin, “Interactive techniques and exploratory spatial data analysis,” Geographical Information Systems: principles, techniques, management and applications, vol. 1, pp. 251–264, 1999. [9] J. S. Yi, Y. ah Kang, J. T. Stasko, and J. A. Jacko, “Toward a deeper understanding of the role of interaction in information visualization,” Visualization and Computer Graphics, IEEE Transactions on, vol. 13, no. 6, pp. 1224–1231, 2007.
[10] C. Stolte, D. Tang, and P. Hanrahan, “Multiscale visualization using data cubes,” Visualization and Computer Graphics, IEEE Transactions on, vol. 9, no. 2, pp. 176–187, 2003. [11] ——, “Query, analysis, and visualization of hierarchically structured data using polaris,” in KDD, vol. 2. Citeseer, 2002, pp. 112–122. [12] ——, “Polaris: A system for query, analysis, and visualization of multidimensional relational databases,” Visualization and Computer Graphics, IEEE Transactions on, vol. 8, no. 1, pp. 52–65, 2002. [13] A. Cuzzocrea and S. Mansmann, “Olap visualization: models, issues, and techniques,” Encyclopedia of Data Warehousing and Mining,, pp. 1439–1446, 2009. [14] S. Mansmann and M. H. Scholl, “Visual olap: A new paradigm for exploring multidimensional aggregates,” in Proc. of IADIS Intl Conf. on Computer Graphics and Visualization (CGV), 2008, pp. 59–66. [15] M. Scotch and B. Parmanto, “Sovat: Spatial olap visualization and analysis tool,” in System Sciences, 2005. HICSS’05. Proceedings of the 38th Annual Hawaii International Conference on. IEEE, 2005, pp. 142b–142b. [16] M. Scotch, B. Parmanto, and V. Monaco, “Usability evaluation of the spatial olap visualization and analysis tool (sovat),” Journal of Usability Studies, vol. 2, no. 2, pp. 76–95, 2007. [17] L. Lins, J. T. Klosowski, and C. Scheidegger, “Nanocubes for realtime exploration of spatiotemporal datasets,” Visualization and Computer Graphics, IEEE Transactions on, vol. 19, no. 12, pp. 2456–2465, 2013. [18] Z. Liu, B. Jiang, and J. Heer, “immens: Real-time visual querying of big data,” in Computer Graphics Forum, vol. 32, no. 3pt4. Wiley Online Library, 2013, pp. 421–430. [19] K. Techapichetvanich and A. Datta, “Interactive visualization for olap,” in Computational Science and Its Applications–ICCSA 2005. Springer, 2005, pp. 206–214. [20] M. Sifer, “A visual interface technique for exploring olap data with coordinated dimension hierarchies,” in Proceedings of the twelfth international conference on Information and knowledge management. ACM, 2003, pp. 532–535. [21] I. Hickson, R. Berjon, S. Faulkner, T. Leithead, E. D. Navara, E. O’Connor, and S. Pfeiffer, “Html5: A vocabulary and associated apis for html and xhtml,” W3C Working Draft edition, 2013. [22] M. Bostock, V. Ogievetsky, and J. Heer, “D3: Data-driven documents,” IEEE Trans. Visualization & Comp. Graphics (Proc. InfoVis), 2011. [Online]. Available: http://vis.stanford.edu/papers/d3 [23] J. C. Roberts, “Exploratory visualization with multiple linked views,” 2004. [24] D. A. Keim, “Information visualization and visual data mining,” Visualization and Computer Graphics, IEEE Transactions on, vol. 8, no. 1, pp. 1–8, 2002. [25] L. Anselin, I. Syabri, and O. Smirnov, “Visualizing multivariate spatial correlation with dynamically linked windows,” Urbana, vol. 51, p. 61801, 2002. [26] J. Deacon, “Model-view-controller (mvc) architecture,” Online][Citado em: 10 de marc¸o de 2006.] http://www. jdl. co. uk/briefings/MVC. pdf, 2009. [27] G. E. Krasner, S. T. Pope et al., “A description of the model-viewcontroller user interface paradigm in the smalltalk-80 system,” Journal of object oriented programming, vol. 1, no. 3, pp. 26–49, 1988. [28] A. Leff and J. T. Rayfield, “Web-application development using the model/view/controller design pattern,” in Enterprise Distributed Object Computing Conference, 2001. EDOC’01. Proceedings. Fifth IEEE International. IEEE, 2001, pp. 118–127. [29] J. Heer and M. Agrawala, “Software design patterns for information visualization,” Visualization and Computer Graphics, IEEE Transactions on, vol. 12, no. 5, pp. 853–860, 2006. [30] I. Hatanaka and S. C. Hughes, “Providing multiple views in a modelview-controller architecture,” Jul. 20 1999, uS Patent 5,926,177. [31] C. Weaver, “Building highly-coordinated visualizations in improvise,” in Information Visualization, 2004. INFOVIS 2004. IEEE Symposium on. IEEE, 2004, pp. 159–166. [32] N. Boukhelifa, J. C. Roberts, and P. Rodgers, “A coordination model for exploratory multi-view visualization,” in Proceedings of the International Conference on Coordinated and Multiple Views in Exploratory Visualization (CMV 2003). IEEE COMPUTER SOC, 10662 LOS VAQUEROS CIRCLE, PO BOX 3014, LOS ALAMITOS, CA 907201264 USA, 2003, pp. 76–85.
[33] Z. Wan and P. Hudak, “Functional reactive programming from first principles,” in ACM SIGPLAN Notices, vol. 35, no. 5. ACM, 2000, pp. 242–252. [34] C. Elliott and P. Hudak, “Functional reactive animation,” in ACM SIGPLAN Notices, vol. 32, no. 8. ACM, 1997, pp. 263–273. [35] P. Hudak, A. Courtney, H. Nilsson, and J. Peterson, “Arrows, robots, and functional reactive programming,” in Advanced Functional Programming. Springer, 2003, pp. 159–187. [36] N. Halbwachs, P. Caspi, P. Raymond, and D. Pilaud, “The synchronous data flow programming language lustre,” Proceedings of the IEEE, vol. 79, no. 9, pp. 1305–1320, 1991. [37] M. R. Berthold, N. Cebron, F. Dill, T. R. Gabriel, T. K¨otter, T. Meinl, P. Ohl, C. Sieb, K. Thiel, and B. Wiswedel, KNIME: The Konstanz information miner. Springer, 2008. [38] G. Abram and L. Treinish, “An extended data-flow architecture for data analysis and visualization,” in Proceedings of the 6th conference on Visualization’95. IEEE Computer Society, 1995, p. 263. [39] D. D. Hils, “Visual languages and computing survey: Data flow visual programming languages,” Journal of Visual Languages & Computing, vol. 3, no. 1, pp. 69–101, 1992. [40] E. Anderson, “The irises of the gaspe peninsula,” Bulletin of the American Iris society, vol. 59, pp. 2–5, 1935. [41] H. Hauser, F. Ledermann, and H. Doleisch, “Angular brushing of extended parallel coordinates,” in Information Visualization, 2002. INFOVIS 2002. IEEE Symposium on. IEEE, 2002, pp. 127–130. [42] R. M. Lerner, “At the forge: twitter bootstrap,” Linux Journal, vol. 2012, no. 218, p. 6, 2012. [43] B. Shneiderman, “The eyes have it: A task by data type taxonomy for information visualizations,” in Visual Languages, 1996. Proceedings., IEEE Symposium on. IEEE, 1996, pp. 336–343.