Bid-auction framework for microsimulation of location choice with endogenous real estate prices Ricardo Hurtubia Michel Bierlaire Francisco Martínez Urbanics Termas de Chillán, Chile March 28th 2012
Outline 1)
Motivation
2)
The bid-auction approach to location choice modeling
3)
Estimation of bid-rent functions
4)
Bid-auction framework for microsimulation of location choice
Motivation – Land use models
Spatial distribution of agents and activities in a city affects:
Cities are complex systems:
Travel demand Energy consumption, pollution Social welfare Interaction of different markets Many heterogeneous agents Externalities
Land use models allow to understand and forecast (?) the evolution of cities Location choice models are a fundamental element of land use models Microsimulation / agent based models are flexible and detailed, making possible to evaluate complex scenarios
Motivation – Approaches to location choice modeling
Choice: agents (households and firms) select location of maximum utility as price takers
Most usual implemented approach in microsimulation Requires prices/rents to be given (usually modeled with a hedonic price model and/or exogenous adjustments)
Bid-auction: real estate goods are traded in auctions where prices and locations are determined by the best bidders
Usually implemented in equilibrium models (bids are adjusted so everyone is located somewhere) Prices are endogenous (expected maximum bid)
Motivation – Bid-auction advantages
Real estate goods (housing, land) are quasi-unique and usually scarce competition between agents Explicit explanation of the price formation process (best bid in an auction) Bid prices can be sensitive to scenarios of demand or supply surplus Estimation: no price endogeneity (spatial autocorrelation) But:
Estimates of bid function must reproduce both prices and location distribution Bid-auction is not straightforward to implement in microsimulation framework Detailed data is usually not available
Bid-auction approach to location choice
Bhi : willingness to pay of agent h for location i. Bhi f ( xh , zi , ) xh : characteristics of agent h (household, firm, …) zi : attributes of location i (housing unit, parcel of land, …)
Probability of agent h being the best bidder for a location i (Ellickson, 1981):
exp( Bhi ) Ph / i exp( Bgi ) gH
H: set of bidding agents
Bid-auction approach to location choice
Price or rent for one location:
Deterministic: bid of the winner of the auction Stochastic: expected maximum bid
ri : rent/price of i = expected value of the maximum bid: ri ln exp( Bgi ) C gH 1
H: set of bidding agents C: unknown constant
Estimation of bid-rent functions
Estimation of bid-rent functions
Rosen (1974): Prices as a function of location attributes (hedonic rent model) Ellickson (1981): stochastic bid approach, undetermined model relative prices Lerman & Kern (1983): bid approach + observed price is maximum bid absolute prices
Very detailed data is required (individual transaction prices) Assumption: groups of homogeneous bidding agents Validation only regarding rent and marginal willingness to pay for location attributes, not agent location distribution or price forecasting (Gross, 1988; Gross et al 1990; Gin and Sonstelie, 1992; McMillen 1996; Chattopadhyay 1998; Muto, 2006)
Estimation of bid-rent functions
Idea:
Assume structural relationship between expected outcome of the auction and observed (average) prices Estimate location choice model and price model simultaneously, using observed prices as indicators
Assumptions:
Auction price is a latent variable (the auction itself is a latent process) All agents are potential bidders for all locations
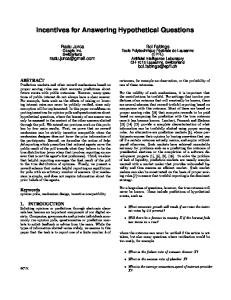
Model with price indicator Explanatory variables (xh , zi)
(latent) auction prices (ri)
Observed prices (Ri)
Auction price measurement model
Bid function (Bhi)
Observed locations (choices)
Standard Logit choice model
* Inspired by the Generalized Random Utility Model (Walker and Ben-Akiva, 2002)
Model with price indicator
Structural equation for prices: ri ln exp( Bgi ) gH 1
Measurement equation for prices:
Ri a ri ~ N (0, ) f ( Ri | ri )
Likelihood:
R a ri exp i 2 2 2 2 1
yhi L Ph / i f ( Ri | ri ) i h
Case study: Brussels
Data collected for a FP7 European Union project (SustainCity)
Census 2001 (aggregated information by zone) Household survey 1999 (~1300 observations), no detail on housing attributes Average transaction prices by commune and 2 types of dwelling (house or apartment) from 1985 to 2008 Other geographical, land use databases
1267997 households, 1274701 dwellings 157 communes 4975 zones 4 types of dwelling (with average attributes per zone)
Isolated house Semi-isolated house Joint house Apartment
Case study: Brussels Bid function specification for location (bid) choice model (Ellickson):
Case study: Brussels
Estimation performed with PythonBiogeme (Bierlaire and Fetiarison ,2010)
Case study: Brussels
Estimation performed with PythonBiogeme (Bierlaire and Fetiarison ,2010)
Case study: Brussels
Prices per commune and type (% error) (over estimation dataset)
Case study: Brussels
Prices (over estimation dataset)
Case study: Brussels
Prices (over estimation dataset)
Case study: Brussels
Prices (over estimation dataset)
Case study: Brussels (forecasting/validation)
Prices per commune and type (% error) (over full supply for 2001)
Case study: Brussels (forecasting/validation)
Number of people per commune (% error)
Case study: Brussels (forecasting/validation)
Number of people with univ degree per commune (% error)
Case study: Brussels (forecasting/validation)
Number of households with 2+ cars (% error)
Case study: Brussels (forecasting/validation)
Number of households with 0 cars (% error)
Discussion
The proposed estimation method finds estimates that reproduce the location distribution of agents and the average market prices of dwellings better than other methods Proposed method requires less detailed data more suitable for extensive land use models Well estimated bid functions (willingness to pay) allow to generate a good forecast of the transaction prices, without the need of hedonic price models this helps if we want to microsimulate using a bid approach
Bid-auction framework for microsimulation of location choice
Microsimulation with a bid approach
When bids are simulated and we get:
Spatial distribution of agents Real estate prices
But, in order to account for competition between agents for scarce goods, we need market clearing
Through hedonic price models (UrbanSim)
Individual auctions (ILUTE)
Simple but not real market clearing Expensive in computational terms
Equilibrium (MUSSA)
Aggregated approach
The market clearing problem Joint probability of household h occupying location i:
Pi, h Pi | hPh Ph | i Pi Ph | i Maximum bid probability
Pi | h Maximum surplus (utility) probability
Pi Ph
Selling probability
Locating probability 29
Re-visiting Equilibrium
In equilibrium models it’s usually assumed that supply (S) equals demand (H)
Ph Pi 1 h, i H S
Possible equilibrium conditions:
Pi, h Pi | hPh Pi 1 h
(everything is sold)
h
Pi, h Ph | i Pi Ph 1 i
i h
i
30
(everyone is located)
Re-visiting Equilibrium
Market clearing can be achieved by imposing one of the equilibrium conditions and finding prices/bids that produce them
ri : Pi | h 1 i
(prices clear the market)
h
bh : Ph | i 1 h
(bids clear the market)
i
Due to interdependence, these are usually fixed point problems
31
Re-visiting Equilibrium
If we have an auction market and the best bidder rule is observed, adjusting prices or bids is equivalent in equilibrium When market conditions change (supply, demand, etc) utility levels of the decision makers have to be adjusted, this is reflected in the level of the prices or bids idea: quasi-equilibrium 32
Quasi-equilibrium
Periodical location of new and re-locating agents, given exogenous supply Assumption: all households looking for a location are located somewhere Ph 1 h
Total supply must be greater or equal than total demand H S Not all locations are necessarily used Pi 1 i
33
Quasi-equilibrium
No equilibrium
no perfect information (aggregate supply, previous prices) No iterative negotiation/bidding No absolute adjustment of bids/prices
Instead, adjustment of “perception” of agents that goes in the direction of an equilibrium but does not solve it.
34
Quasi-equilibrium
Algorithm (in each period):
All agents H observe the market: prices and supply rit 1 , zit 1 , Si All gents (simultaneously) adjust their bids, attempting to make their expected number of winning auctions equal to one:
q(h | i ) 1
h
q(h|i): perceived probability of being the best bidder for i
iS
All agents bid at the same time for all locations prices and location distributions are defined The assignment mechanism is an auction for each location a best bidder and a price is determined 35
Quasi-equilibrium Bhi I h U h Vh ( zi ) Vh ( zi ) bh
Bid function:
Perceived probability:
exp Vh ( zit ) bht t t t 1 qh | i exp V ( z ) b r h i h i t exp( Bgi )
gH
iS
t t t 1 q(h | i) 1 bh ln exp Vh ( zi ) ri iS
Advantage: no fixed point, just evaluation of equation it is possible to apply to large populations without excessive computational cost
36
General framework Re-location models
Re-locating agents, vacated real estate
Travel times, congestion, level of service
Transport model
Located agents
Market clearing
New real estate
Real estate prices t=t+1
New agents Supply model
Firmographics
Externalities, market conditions (prices, demand/supply surplus, etc) Given for t=0
Demographics
37
Market clearing t=t+1
Externalities, prices and market conditions (t-1)
Demographics(t)
Adjustment of utility level
Re-calculation of hedonic WP (Vh)
(bh)
Simulation of location choice
Supply (t)
t=t+1
Empty units
Relocation
Location probability distribution (Ph/i)
New and Relocating agents Transaction prices (Ri)
Auction
Located individual agents and prices
Some preliminary results
Average prices per year
Average price growth: BID: 50%, HEDONIC: 7%
Observed average prices per commune
Average price growth :108%
Advantages
Agents have an individual behavior but they relate to a “higher level” market mechanism through the utility level adjustment and the simultaneous auction. Quasi-equilibrium :
Demand is not cleared: utility adjustment does NOT assure allocation Supply is not cleared System tends to equilibrium but does not clear
Adjustment of utility levels instead of prices allow to
Explain price formation (no need for hedonic price models) Detect all agents utility levels, including those not active in the market, triggering future re-location 41
Thank you
42/38
Main assumptions of the general framework
Auction market Agents adjust their utility level (individually in each period)
Time lag:
In production of real estate goods: In perception of attributes of locations (non-instantaneous)
Simultaneous (macro level) bid of all agents for all locations
to ensure location (ex-ante expectations) given market conditions: previous period rents, current supply
Location (best bidder) distributions and expected rents (Ri). No iterative transactions. Computationally simpler than transaction-specific price clearing
Microsimulation:
Actual allocation following macro distributions (simulation of auctions) Rents at micro level (ri)
43