ARTICLE
Prostate-Specific Antigen Levels as a Predictor of Lethal Prostate Cancer Katja Fall, Hans Garmo, Ove Andrén, Anna Bill-Axelson, Jan Adolfsson, Hans-Olov Adami, Jan-Erik Johansson, Lars Holmberg For the Scandinavian Prostate Cancer Group Study No. 4
Background
Rates of long-term survival among patients with untreated localized prostate cancer are high. To avoid unnecessary treatment, tools are needed to identify the small proportion of patients who are destined to develop lethal prostate cancer.
Methods
To evaluate the accuracy of early changes in prostate-specific antigen (PSA) levels as predictors of prostate cancer outcome, we assessed serial measurements of PSA level among 267 men with localized prostate cancer in a Scandinavian cohort of men who were diagnosed between 1989 and 1999 and who were managed by watchful waiting. We then 1) fitted individual regression lines to the PSA values assessed for each patient during the first 2 years of follow-up by using three different models, 2) evaluated early PSA curve characteristics as determinants of the cumulative incidence of lethal prostate cancer and calculated hazard ratios for baseline PSA value and rate of change in PSA level to prostate cancer outcome, and 3) plotted time-dependent receiver operating characteristic (ROC) curves. All P values are two-sided.
Results
During complete follow-up for a mean of 8.5 years, 34 patients (13%) died from prostate cancer, and 18 (7%) developed metastases but were still alive at end of follow-up. In a log-linear model, both PSA value at baseline (P = .05) and the rate of PSA change (P<.001) were associated with the development of lethal prostate cancer. In the ROC analysis, however, the accuracy of classifying the disease as either indolent or destined to progress was low, regardless of the cut point chosen for initial PSA level or rate of change in PSA level.
Conclusions
Although baseline PSA value and rate of PSA change are prognostic factors for lethal prostate cancer, they are poor predictors of lethal prostate cancer among patients with localized prostate cancer who are managed by watchful waiting. J Natl Cancer Inst 2007;99:526–32
A pressing clinical issue is the choice of management for men who are newly diagnosed with localized prostate cancer. The first decision to make is whether a patient would benefit most from active monitoring—treatment postponed until signs of progression—or from early radical treatment. Because of the excellent prognosis of localized prostate cancer when left untreated, the risk for overtreatment is substantial. There is, however, little empirical evidence that allows us to safely distinguish clinically insignificant prostate tumors from progressing prostate cancer among patients who potentially would benefit most from conservative management. The proposed association between prostate-specific antigen (PSA) levels and prostate cancer volume (1) predicts that the rate of PSA concentration increase over a period of time should reflect tumor growth rate. The rate of rise in PSA levels before prostate cancer treatment has indeed been correlated with prostate cancer outcome (2–4), implying that the dynamics of the early PSA curve may reflect the biologic behavior of the tumor. A sharply rising PSA curve at the beginning of the monitoring period may thus characterize a lethal tumor that warrants intensive treatment. In contrast, a less marked increase in PSA would indicate slowly 526 Articles
|
JNCI
progressing nonlethal disease for which the patient may not need radical local therapy. Yet little is known about the value of early PSA characteristics in predicting prostate cancer outcomes among patients who have clinical disease and are left without initial treatment (5). We used PSA monitoring data from the watchful waiting arm of the Scandinavian Prostate Cancer Group No. 4 trial (6,7), a
Affiliations of authors: Department of Medical Epidemiology and Biostatistics, Karolinska Institutet, Stockholm, Sweden (KF, HOA); Regional Oncological Center at Uppsala University, Uppsala, Sweden (HG, LH); Department of Urology, Örebro University Hospital, Örebro, Sweden (OA, JEJ); Department of Urology, Uppsala University Hospital, Uppsala, Sweden (ABA); Regional Oncological Center, Karolinska University Hospital, Stockholm, Sweden (JA). Correspondence to: Katja Fall, MD, PhD, Department of Medical Epidemiology and Biostatistics, Karolinska Institutet, Box 281, S-171 77 Stockholm, Sweden (e-mail:
[email protected]). See “Notes” following “References.” DOI: 10.1093/jnci/djk110 © The Author 2007. Published by Oxford University Press. All rights reserved. For Permissions, please e-mail:
[email protected].
Vol. 99, Issue 7
|
April 4, 2007
cohort of men with untreated clinically localized prostate cancer. Our aim was to examine the accuracy of early changes in PSA levels as predictors of lethal prostate cancer, here defined as the occurrence of distant metastases or of death from prostate cancer, if not preceded by clinically overt metastases.
Subjects and Methods Study Cohort The study includes a cohort of 348 men who were diagnosed with early localized prostate cancer between 1989 and 1999. These men had been randomly assigned to watchful waiting as part of a multicenter randomized clinical trial evaluating the effect of radical prostatectomy (6,7). The patients were recruited at 14 centers in Sweden, Finland, and Iceland. In brief, both arms of the trial consist of men younger than age 75 years with a primary, newly diagnosed, and untreated adenocarcinoma of the prostate [clinical stage T1b, T1c, T2 (8)]. To be eligible, patients had to have 1) an initial PSA value of less than 50 ng/mL, 2) a well- or moderately welldifferentiated tumor (nuclear grade I and II), 3) a negative bone scan, and 4) a urographic examination excluding signs of obstruction of the upper urinary tract. The cohort members did not receive any immediate treatment after their diagnosis. In the case of local progression, transurethral resection was the recommended treatment. Hormonal therapy was suggested as treatment for disseminated disease. All diagnostic biopsies were reevaluated and graded according to the Gleason system (9,10). The ethics committees at all participating centers approved the initial study protocol and its amendments (Research Ethics Committee, Örebro, Sweden, DNR 251/89). All patients provided written informed consent. Inclusion Criteria Our aim was to analyze PSA follow-up data during the first 2 years after diagnosis as predictors of subsequent lethal prostate cancer, defined as the occurrence of distant metastases or as death from prostate cancer, if not preceded by clinically overt metastases. Thus, patients who were diagnosed with distant metastases or who died within 2 years following randomization were excluded from all analyses. A recorded baseline PSA value within 6 months before or after the randomization date was required, as was at least one additional PSA test carried out within 2 years from randomization and no less than 6 months after the baseline assessment. The final cohort of 267 men is shown in Fig. 1. Follow-up and Outcome All patients were followed regularly with clinical examinations and blood tests semiannually during the first 2 years and annually after that. Bone scans and chest radiographs were carried out once per year until 1997; after that, bone scans were performed biannually and chest radiographs were obtained annually only for the first 2 years of follow-up. We achieved complete follow-up through December 31, 2003, at which time all medical records were reviewed for new events. Men undergoing treatment with curative intent (radical prostatectomy or radiotherapy, n = 16) did not contribute to follow-up after the date of treatment. jnci.oxfordjournals.org
CONT E XT AND CAVE AT S Prior knowledge Although patients with untreated localized prostate cancer may have high rates of long-term survival, many undergo treatment. Study design Prospective analysis to determine the specificity and sensitivity of prostate-specific antigen (PSA) level and its rate of change per year (PSA velocity) in predicting lethal prostate cancer among a cohort of men who were diagnosed with localized prostate cancer and underwent watchful waiting rather than treatment. Contributions Although PSA value at the time of prostate cancer diagnosis and its rate of change were associated with the development of lethal disease after an average of 8.5 years after diagnosis, the accuracy of predicting aggressive disease was low. Implications Baseline PSA value and its rate of change were poor predictors of lethal prostate cancer in this cohort. Limitations There is variability in PSA measurements due to physiologic factors and differences in testing methods and the number of measurements taken.
Randomization
Watchful Waiting (n = 348)
Radical Prostatectomy (n = 347)
At least two PSA measurements within PSA evaluation period?
No (n = 47)
At least 6 months between first and last PSA measurement?
No (n = 21)
First PSA test within ± 6 months from randomization?
No (n = 7)
Outcome event during PSA evaluation period?
Yes (n = 6)
Included in analyses N = 267
Fig. 1. Flow diagram of patients included in the study. The study cohort was derived from the watchful waiting arm (N = 348) of a randomized trial comparing radical prostatectomy with watchful waiting (7). For this study, we excluded 47 patients who did not have at least two prostatespecific antigen (PSA) measurements during the 2-year PSA evaluation period and another 21 who had less than 6 months between their first and last PSA measurement. We also excluded seven patients who did not have their initial PSA test taken within 6 months of randomization (definition of start of this study) as well as six patients who experienced an outcome event during the 2-year PSA evaluation period. In total, 267 patients were included in the analyses.
JNCI
|
Articles 527
Cause of death was determined by an independent endpoint committee and was based on standardized extractions from the patient files as previously described (6). Distant metastases were considered to be present if bone scans or chest radiographs revealed metastases or if lymph nodes above the diaphragm showed evidence of disseminated disease. A patient was classified as having lethal prostate cancer when the first occurrence of metastasis was documented. Assessment of Prostate-Specific Antigen Characteristics We examined PSA levels during an evaluation period of 2 years after diagnosis because we believe this length of time to be the longest that clinicians would be willing to delay reevaluation of the treatment decision. Serum PSA levels were assessed with standard commercial assays in use at each center at the time. Because secondary treatments may cause transient changes in PSA levels, measurements made after the introduction of any type of secondary treatment (orchiectomy, gonadotropin-releasing hormone analogs, antiandrogens, estramucin sulfate, estrogen, and transurethral resection of the prostate; n = 25) during the 2-year evaluation period were ignored. Statistical Methods First, linear regression was applied—using three different models— to fit individual regression lines to the PSA values assessed for each patient during the 2-year PSA evaluation period. In the first analysis, we fit the regression lines to the PSA measurements to obtain individual estimates of baseline PSA (ng/mL) and PSA velocity (PSAV) (ng/mL per year) (11). In the second analysis, we fit the regression lines to the logarithm of PSA to obtain individual estimates of baseline log PSA and relative PSAV (relative PSAV = log PSA/PSA) (5). The third analysis accommodates the possible exponential increase in PSA levels among men with untreated prostate cancer (12). In this analysis, we used log-linear regression with an enforced positive slope to obtain estimates of baseline PSA and relative PSAV. In this model, the relative PSAV corresponds to PSA doubling time (PSADT = log 2/relative PSAV). Second, we used these three models to characterize the association between PSA changes and the cumulative incidence of lethal prostate cancer (13). The cumulative incidence was modeled in a cumulative incidence regression model (14). Death from other causes and treatment with radical prostatectomy or radiotherapy with curative intent were considered to be competing risks in the regression models. The timescale in the regression model was set to zero at the end of the 2-year PSA evaluation period. In the regression models, both tumor stage (T1b, T1c, versus T2) and grade (Gleason score 2–6 versus 7 and 8–9) were evaluated as categorical variables, whereas PSA value at baseline and rate of PSA change were considered both as continuous (Table 2) and categorical (Table 3, cut points derived from the receiver operating characteristic [ROC] curve) variables. We calculated hazard ratios to estimate the relative risk for development of lethal disease, with associated 95% confidence intervals (CIs), for all covariates using proportional hazards in the cumulative incidence regression model. Proportionality was verified by visual inspection. Two-sided P values were used in all analyses; P values less than .05 were considered statistically significant. 528 Articles
|
JNCI
Table 1. Characteristics of 267 patients with localized prostate cancer (T1b, T1c, T2, M0, Nx) left without initial treatment who were diagnosed between 1989 and 1999 and followed through 2003* Characteristic Metastasis Alive at end of follow-up Prostate cancer death Other cause of death Free of metastases at the end of follow-up Alive Other cause of death Curative treatment Age at baseline, y <60 60–64 65–69 ≥70 Tumor stage at baseline T1b T1c T2 Missing Gleason score at baseline 2–6 7 8–9 Unknown† PSA level at baseline, ng/mL‡ <4 4–6.9 7–9.9 10–20 >20 Mode of detection of tumor PSA screening Coincidental TURP Symptoms Other Missing No. of PSA analyses within first 2 y 2 3 4–5 ≥6 TURP during year 0–2 No Yes Hormonal treatment None During year 0–2 After 2 y
N
%
57 18 34 5 210 161 33 16
21.3 6.7 12.7 1.9 78.7 60.3 12.4 6.0
42 81 98 46
15.7 30.3 36.7 17.2
70 28 171 1
26.2 10.5 64.0 0.4
166 63 16 22
62.2 23.6 6.0 8.2
46 48 45 80 48
17.2 18.0 16.9 30.0 18.0
14 76 34 106 36 1
5.2 28.5 12.7 39.7 13.5 0.4
9 30 179 49
3.4 11.2 67.0 18.4
254 13
95.1 4.9
121 14 132
45.3 5.2 49.4
* The study cohort was derived from the watchful waiting arm of a randomized trial comparing radical prostatectomy to watchful waiting (7). Mean ± standard deviation time of follow-up was 8.53 ± 2.7 years. PSA = prostate-specific antigen, TURP = transurethral resection of the prostate; T = tumor; N = node; M = metastasis; TNM stage defined as in (8). † Diagnosis based on cytologic examination only or biopsy could not be retrieved. ‡ Single measurement at time of randomization.
In addition to describing the prognostic value of early PSA characteristics in terms of absolute and relative risks of metastasis or death, we investigated the ability of these characteristics to correctly distinguish patients who developed lethal disease from Vol. 99, Issue 7
|
April 4, 2007
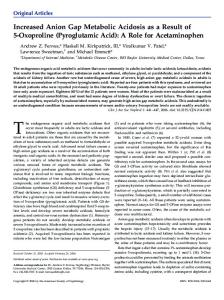
Fig. 2. Distribution of prostatespecific antigen (PSA) level at baseline and relative PSA velocity for 267 patients with localized prostate cancer (T1b, T1c, T2, M0, Nx) left without initial treatment, who were diagnosed between 1989 and 1999 and followed through 2003. A) Patients with lethal prostate cancer, B) patients with no events before end of follow-up, and C) patients who died of other causes or were subject to curative treatment.
patients who did not. Thus, we calculated ROC curves. Because the fate of a number of patients was still unknown at the end of follow-up, the accuracy of PSA level at baseline and rate of PSA change as decision tools for intervention could not be illustrated by means of traditional ROC curves (i.e., plots of sensitivity versus 1 − specificity for various cutoff values). Instead, we used time-dependent ROC curves, with a span of n = 5%, to assess the prognostic capability of these variables, such that the probability of developing a future event (lethal prostate cancer) is replaced by an estimate originating from the survival function (15). The presented cut points were chosen to exemplify values with high, medium, and low sensitivity and specificity. All statistical computations were performed using the statistical program package R (16).
Results During follow-up, 34 (13%) of the 267 men died from prostate cancer, all of whom had first developed clinically detectable distant metastases (Table 1). In addition, 18 (7%) patients developed metastases but were still alive at the end of follow-up. Another 33 (12%) men had died from other causes and 161 (60%) were still alive without any sign of distant metastases. The mean ± standard deviation (SD) duration of follow-up from the date of randomization was 8.5 ± 2.7 years. The approximation of the PSA curves was based on a mean ± SD of 4.6 ± 1.2 measurements per patient (range = 2–10). The mean ± SD of PSA value at baseline was 12.0 ± 10 ng/mL. We observed better performance and a more appropriate scaling (by evaluation of residual plots) in the models that were based on the logarithm of the individual PSA values (models 2 and 3) than in the model that was based on the direct PSA measurements (model 1). Therefore, the latter was not used further in the analyses. Estimates from model 2 were used to plot patients who developed lethal disease (Fig. 2, A) in a diagram of baseline log PSA value versus relative PSAV. The same plot was made for those who had no events during follow-up (Fig. 2, B) and for those who were censored because they died from other diseases during follow-up or underwent radical prostatectomy or radiotherapy with curative intent (Fig. 2, C). Although time-to-event data are not presented jnci.oxfordjournals.org
in Fig. 2, the scattering of data in the upper right portion of panel A, compared with that in panels B and C, suggests a possible association between increasing intercepts and slopes with occurrence of lethal disease. However, the overlap between the distributions of data points when comparing the data in Fig. 2, A–C also suggests that early PSA characteristics may not distinguish prostate cancer outcomes with high accuracy. Characteristics of the Prostate-Specific Antigen Curve and Relative Risk of Lethal Prostate Cancer We calculated the relative risks of a fatal outcome (metastases or death) among men who were diagnosed with localized prostate cancer (Table 2). Both PSA level at baseline and rate of change in PSA level during the first 2 years of follow-up were statistically significantly associated with lethal prostate cancer in the ageadjusted analyses based on model 2. PSAV remained statistically significantly associated with outcome after adjusting for all other covariates in all three models, whereas the association with PSA value at baseline disappeared. We observed similar results after restricting the data to include only patients with a Gleason score less than 7 (data not shown). Theoretically, patients who start with a higher PSA value at baseline might also systematically have a higher or lower rate of change in PSA than those who have a low PSA value at baseline. However, the cumulative incidence regression analyses showed no strong or statistically significant interaction between these entities in any of the models (data not shown). Accuracy of Early Prostate-Specific Antigen Curve Characteristics as Predictor of Prostate Cancer Outcome To explore the accuracy of PSA and early PSA changes as a classifier of lethal and nonlethal prostate cancer, we assessed timedependent ROC curves at 6 and 10 years after randomization for model 2 (Fig. 3). Models 1 and 3 yielded ROC curves with similar characteristics (data not shown). No single cut point for any measure of baseline PSA or relative PSAV yielded high sensitivity combined with high specificity. For example, a baseline PSA value of 10 predicted lethal prostate cancer within 6 years from randomization with a sensitivity of 0.69 and a specificity of 0.58, whereas a cutoff of relative PSAV of 0.14 (which corresponds to PSADT = 5) JNCI
|
Articles 529
Table 2. Adjusted and unadjusted relative risks (RRs) and 95% confidence intervals (CIs) for early prostate-specific antigen (PSA) characteristics in relation to lethal prostate cancer among all study patients (n = 267) Model
Characteristic
1) Linear regression 2) Log-linear regression 3) Log-linear regression with enforced positive slope
RR (95% CI)
PSA level at baseline, per 1 ng/mL increase PSA velocity (ng/mL per year), continuous PSA level at baseline‡, continuous Relative PSA velocity§, continuous PSA level at baseline‡, continuous Relative PSA velocity§, continuous Initial PSA, per 1 ng/mL increase Age at diagnosis (y), continuous Gleason score 2–6 7 8–9 Missing T stage T1b T1c T2
to to to to to to to to
P*
RR (95% CI)†
(0.97 (1.03 (1.00 (1.98 (1,00 (2.18 (1.00 (0.91
1.04) 1.04) 1.54) 7.04) 1.03) 8.45) 1.04) 1.01)
.73 <.001 .05 <.001 .06 <.001 .07 .08
0.99 1.03 1.17 3.56 1.01 4.40 1.02 0.96
(0.97 (1.02 (0.95 (1.79 (0.99 (2.13 (0.99 (0.91
1.00 2.51 3.18 2.05
(referent) (1.37 to 4.62) (1.32 to 7.67) (0.82 to 5.13)
.003 .01 .13
1.00 2.20 3.70 2.07
(referent) (1.2 to 4.05) (1.65 to 8.28) (0.82 to 5.24)
0.91 (0.5 to 1.66) 0.41 (0.1 to 1.68) 1.00 (referent)
.77 .22
to to to to to to to to
P*
1.01 1.03 1.24 3.73 1.01 4.29 1.02 0.96
1.01) 1.04) 1.45) 7.11) 1.02) 9.10) 1.04) 1.01)
.46 <.001 .15 <.001 .39 <.001 .18 .086
.011 .0014 .12
1.02 (0.56 to 1.83) 0.39 (0.09 to 1.64) 1.00 (referent)
.96 .20
* P values (two-sided) were calculated using Wald’s test. † Adjusted for age, Gleason score, tumor (T) stage, and measure of slope or baseline PSA value from corresponding model. Relative risks for Gleason score and T stage were adjusted for PSA value and slope from the log-linear regression model. ‡ One unit increase equals a doubling of the PSA value. § Relative PSA velocity = log PSA/PSA, one unit increase.
yielded a sensitivity of 0.69 and a specificity of 0.57. Restricting the analyses to those with a Gleason score of less than 7 did not improve the accuracy of the tests (data not shown). As indicated by the ROC curves, no cut points (for PSA concentration or PSAV) allowed division of the patient cohort into two groups with clearly different treatment needs. The diagnostic likelihood ratio, an indicator of how much more likely a positive test is to be found in someone with as opposed to without the outcome in question, was less than 2.0 at all tested cut points (Table 3). Cumulative Incidence of Lethal Prostate Cancer Among Patients With High and Low Baseline Prostate-Specific Antigen Values and High and Low Rates of Change in Prostate-Specific Antigen Levels To investigate the accuracy of PSA and relative PSAV in predicting lethal prostate cancer further, we calculated the cumulative inci-
Discussion In this prospectively followed cohort of patients who were diagnosed with localized prostate cancer and managed by watchful waiting, we found that early characteristics of the PSA curve may
0.8
0.6
0.6
0.4 0.2
|
JNCI
10 years from start of study
1.0
0.8
0.4 0.2
0.0
0.0 0.0
0.2
0.4
0.6
1-specificity
530 Articles
B
6 years from start of study
1.0
sensitivity
sensitivity
A Fig. 3. Time-dependent receiver operating characteristic curves demonstrating accuracy of baseline levels of prostate-specific antigen (PSA) and PSA doubling time (PSADT) (as derived from model 2) as tests for lethal prostate cancer among patients diagnosed with localized prostate cancer between 1989 and 1999, managed by watchful waiting. Assessment at A) 6 and B) 10 years of follow-up from start of study (=time of randomization). Baseline PSA (black line), PSA = 7 ng/mL (black square), PSA = 10 ng/mL (black diamond), and PSA = 14 ng/mL (black triangle); relative PSA velocity (gray line), PSADT = 10 years (gray square), PSADT = 5 years (gray diamond), and PSADT = 3 years (gray triangle).
dence of lethal prostate cancer at three selected cut points for each variable (Table 3). For example, the 6-year cumulative incidence was 7% among men with a PSADT of 5 years or more and 17% among men with a PSADT of less than 5 years, corresponding to a relative risk of 2.6 (95% CI = 1.5 to 4.5). Thus, although the rate of PSA change clearly was positively associated with increased risk for prostate cancer death, 7% of the men classified as “low risk” in this example would still die from prostate cancer. Restricting the analyses to patients with a Gleason score of less than 7 yielded similar results (Table 3).
0.8
1.0
0.0
0.2
0.4
0.6
0.8
1.0
1-specificity
Vol. 99, Issue 7
|
April 4, 2007
Table 3. Cumulative incidence of lethal prostate cancer among 267 patients with localized prostate cancer (T1b, T1c, T2, M0, Nx), stratified by value of PSADT and baseline PSA level* All
Value PSADT ≥ 3 PSADT < 3 PSADT ≥ 5 PSADT < 5 PSADT ≥ 10 PSADT < 10 Baseline PSA Baseline PSA Baseline PSA Baseline PSA Baseline PSA Baseline PSA
< 14 ≥ 14 < 10 ≥ 10 <7 ≥7
n
%
182 85 143 124 105 162 173 84 140 117 98 159
68.2 31.8 53.6 46.4 39.3 60.7 67.3 32.7 54.5 45.5 38.1 61.9
Cumulative 6-y incidence (95% CI) 0.07 0.21 0.07 0.17 0.09 0.13 0.08 0.20 0.07 0.17 0.07 0.14
(0.04 to 0.12) (0.13 to 0.32) (0.03 to 0.12) (0.12 to 0.26) (0.05 to 0.17) (0.09 to 0.20) (0.05 to 0.13) (0.13 to 0.3) (0.04 to 0.13) (0.11 to 0.25) (0.04 to 0.15) (0.1 to 0.21)
Gleason score < 7 Positive diagnostic likelihood ratio 1.9 1.6 1.2 1.7 1.6 1.3
n
%
124 42 95 71 69 97 117 49 94 72 67 99
74.7 25.3 57.2 42.8 41.6 58.4 70.5 29.5 56.6 43.4 40.4 59.6
Positive diagnostic likelihood ratio
Cumulative 6-y incidence (95% CI) 0.05 0.10 0.04 0.09 0.06 0.06 0.05 0.09 0.04 0.09 0.04 0.08
(0.02 (0.04 (0.02 (0.04 (0.02 (0.03 (0.02 (0.03 (0.02 (0.04 (0.01 (0.04
to to to to to to to to to to to to
0.11) 0.26) 0.12) 0.19) 0.16) 0.14) 0.12) 0.22) 0.11) 0.19) 0.14) 0.16)
1.8 1.5 1.0 1.3 1.5 1.2
* T = tumor; N = node; M = metastasis; TNM stage defined as in (8); PSADT = prostate-specific antigen doubling time (years); PSA = prostate-specific antigen (ng/mL); CI = confidence interval.
herald progression to metastatic lethal prostate cancer. In this study, both baseline PSA and rate of change in PSA during the first 2 years of follow-up carried prognostic information. However, despite extensive exploration of different statistical models, we could not substantiate any PSA curve characteristic as a good classifier of who would develop lethal disease and who would not. Thus, our findings raise the question of whether early PSA characteristics are suitable and safe as decision tools for therapeutic intervention among low-risk patients managed with active monitoring. Strengths of our study include its prospective design, large size, complete follow-up, and standardized classification of deaths with blinding for any antecedent treatment (6,7). In addition, our study included predominantly patients with clinically significant disease, which allowed us to use informative outcomes. In contrast, cohorts with mostly PSA-detected disease may observe so few prostate cancer deaths that PSA has to be used as a surrogate endpoint rather than a potential determinant of the outcome. Finally, there are only a few existing cohorts of patients who are managed by watchful waiting. The natural variability in PSA measurements is well documented and includes both analytic and biologic components. Analytic variation depends on assay performance, sample handling, and laboratory processing (17). Biologic variation relates to individual factors, such as PSA metabolism, growth of the benign prostate, inflammation, renal elimination, sexual practices, and physical activity (18,19). Changes in PSA levels may also occur as a result of secondary treatment. Thus, a limitation of any study of PSA changes over time is the uncertainty associated with assessing these variables. We took measures to avoid the influence of treatment on PSA by disregarding PSA measurements made after the onset of any secondary therapy as we estimated the rate of PSA change for each patient. A larger number of measurements will reduce the uncertainty associated with the assessment of early PSA curve characteristics. Our linear regression estimates, based on the initial 2 years of follow-up, included at least four PSA measurements in the majority jnci.oxfordjournals.org
of patients (85%). Any misclassification in these variables is unlikely to differ between those who eventually develop lethal disease and those who do not. One concern was that the frequency of measurements (and thus the precision in the estimated PSAV) would differ according to outcome and thereby introduce bias. In these data, however, neither rate of PSA change nor progression to lethal disease was associated with the number of measurements. Nondifferential misclassification may still have diluted the results and thereby impaired the performance of the ROC curve. Similar problems would nevertheless be encountered in any routine clinical practice. Progression-free survival in patients with localized prostate cancer who are managed through watchful waiting is high (20,21), and clinicians currently lack tools to distinguish lethal prostate cancer from less lethal disease at the time of diagnosis. As a result, many prostate cancer patients undergo aggressive local treatment without any survival benefit. To reduce such overtreatment, management by active surveillance with selective delayed intervention based on early PSA changes has been proposed (22). We designed our analyses to test this approach with the assumption that 2 years may be a reasonable time to defer the choice of primary curative treatment. The plot of baseline PSA values against relative PSAV (Fig. 2) demonstrated a considerable overlap of data points representing patients who developed lethal disease and those who did not. The lack of clear discriminating patterns results in a ROC curve that is close to the diagonal. Indeed, no single cut point yielded high sensitivity in predicting the outcome, combined with high specificity. Use of early PSA characteristics in a clinical setting would therefore require a trade-off between the two measures. However, because a considerable number of metastases and deaths occurred also in the “low-risk” group (as defined by measures of PSA regardless of cut point) over time, it is clear that clinical decision making should not be dependent on the use of early PSA curve characteristics alone. We examined whether PSAV may vary in importance depending on the baseline PSA level, but there was no clear interaction between the two variables. Hence, the slope of the PSA curve JNCI
|
Articles 531
appears to carry similar prognostic information regardless of baseline PSA. As a corollary, our findings should be generalizable also to other settings, such as screening. In addition, the results seemed independent of Gleason score—a fact that further underpins their generalizability. Although differences in patient selection and study design make comparisons across studies difficult, our results are consistent with recent studies that have demonstrated an association between increasing prediagnostic (20) and pretreatment (2–4) PSAV and lethal prostate cancer. However, our study addresses a different issue that relates to the choice of cancer therapies in general. Therapeutic decisions are often based on whether the patient has a high- or low-risk disease, as defined by prognostic factors. Nevertheless, these prognostic factors—even if associated with rather high relative risks—are seldom accurate tests of disease progression or death within a certain period. We conclude that PSA measurement is associated with prostate cancer prognosis and continues to be an important monitoring tool. However, early PSA characteristics perform poorly in distinguishing those who develop a lethal prostate cancer from those at low or no risk of disease progression. Therefore, better decision tools are needed for active monitoring of patients with early disease. References (1) Stamey TA, Yang N, Hay AR, McNeal JE, Freiha FS, Redwine E. Prostate-specific antigen as a serum marker for adenocarcinoma of the prostate. N Engl J Med 1987;317:909–16. (2) D’Amico AV, Chen MH, Roehl KA, Catalona WJ. Preoperative PSA velocity and the risk of death from prostate cancer after radical prostatectomy. N Engl J Med 2004;351:125–35. (3) D’Amico AV, Renshaw AA, Sussman B, Chen MH. Pretreatment PSA velocity and risk of death from prostate cancer following external beam radiation therapy. JAMA 2005;294:440–7. (4) Sengupta S, Myers RP, Slezak JM, Bergstralh EJ, Zincke H, Blute ML. Preoperative prostate specific antigen doubling time and velocity are strong and independent predictors of outcomes following radical prostatectomy. J Urol 2005;174:2191–6. (5) Vollmer RT, Egawa S, Kuwao S, Baba S. The dynamics of prostate specific antigen during watchful waiting of prostate carcinoma: a study of 94 Japanese men. Cancer 2002;94:1692–8. (6) Holmberg L, Bill-Axelson A, Helgesen F, Salo JO, Folmerz P, Haggman M, et al. A randomized trial comparing radical prostatectomy with watchful waiting in early prostate cancer. N Engl J Med 2002;347:781–9. (7) Bill-Axelson A, Holmberg L, Ruutu M, Haggman M, Andersson SO, Bratell S, et al. Radical prostatectomy versus watchful waiting in early prostate cancer. N Engl J Med 2005;352:1977–84. (8) Sobin L, Wittekind C. TNM classification of malignant tumours. 6th ed. New York (NY): Wiley-Liss; 2002. (9) Gleason DF, Mellinger GT. Prediction of prognosis for prostatic adenocarcinoma by combined histological grading and clinical staging 1974. J Urol 2002;167(Pt 2):953–8; discussion 959. (10) Gleason DF, Mellinger GT. Prediction of prognosis for prostatic adenocarcinoma by combined histological grading and clinical staging. J Urol 1974;111:58–64. (11) Carter HB, Morrell CH, Pearson JD, Brant LJ, Plato CC, Metter EJ, et al. Estimation of prostatic growth using serial prostate-specific antigen measurements in men with and without prostate disease. Cancer Res 1992;52:3323–8.
532 Articles
|
JNCI
(12) Schmid HP, McNeal JE, Stamey TA. Observations on the doubling time of prostate cancer. The use of serial prostate-specific antigen in patients with untreated disease as a measure of increasing cancer volume. Cancer 1993;71:2031–40. (13) Kalbfleisch JD, Prentice RL. The statistical analysis of failure time data. New York (NY): John Wiley; 2002. (14) Fine J, Gray R. A proportional hazards model for the subdistribution of a competing risk. J Am Stat Assoc 1999;496–509. (15) Heagerty PJ, Lumley T, Pepe MS. Time-dependent ROC curves for censored survival data and a diagnostic marker. Biometrics 2000;56: 337–44. (16) Ihaka R, Gentleman R. R: a language for data analysis and graphics. J Comput Graph Stat 1996;5:299–314. (17) Piironen T, Pettersson K, Suonpaa M, Stenman UH, Oesterling JE, Lovgren T, et al. In vitro stability of free prostate-specific antigen (PSA) and prostate-specific antigen (PSA) complexed to alpha 1-antichymotrypsin in blood samples. Urology 1996;48(Suppl)81–7. (18) Bruun L, Becker C, Hugosson J, Lilja H, Christensson A. Assessment of intra-individual variation in prostate-specific antigen levels in a biennial randomized prostate cancer screening program in Sweden. Prostate 2005; 65:216–21. (19) Tchetgen MB, Oesterling JE. The effect of prostatitis, urinary retention, ejaculation, and ambulation on the serum prostate-specific antigen concentration. Urol Clin North Am 1997;24:283–91. (20) Johansson JE, Andren O, Andersson SO, Dickman PW, Holmberg L, Magnuson A, et al. Natural history of early, localized prostate cancer. JAMA 2004;291:2713–9. (21) Albertsen PC, Hanley JA, Fine J. 20-year outcomes following conservative management of clinically localized prostate cancer. JAMA 2005;293: 2095–101. (22) Klotz LH, Choo R, Morton G, Danjoux C. Expectant management with selective delayed intervention for favorable-risk prostate cancer. Can J Urol 2002;9 Suppl 1:2–7.
Notes This study was supported by grants from the Swedish Cancer Society and the National Institutes of Health. K. Fall was partly supported by a Postdoctoral Traineeship Award from the US Department of Defense. K. Fall and H. Garmo had full access to all the data in the study and take responsibility for the integrity of the data and the accuracy of the data analysis. The participants in the Scandinavian Prostate Cancer Group Study No. 4 were as follows: Protocol Committee—H.-O. Adami and J.-E. Johansson; Steering Committee—H.-O. Adami, A. Bill Axelson, L. Holmberg, J.-E. Johansson (principal investigator), and B.-J. Norlén; Statistical Analysis—H. Garmo, K Fall, L. Holmberg; Manuscript Preparation—K. Fall, H. Garmo, L. Holmberg, O. Andrén, and H.-O. Adami; Monitoring—A. Bill-Axelson and B. Gobén; Study Group, Recruitment, and Data Collection: Borås, Sweden—S. Bratell; Eskilstuna, Sweden—T. Lindeborg; Helsinki, Finland—M. Ruutu and J. Salo; Linköping, Sweden—A. Spångberg; Lund, Sweden—P. Elfving; Reykjavik, Iceland—G. Einarsson; Stockholm, Sweden—J. Adolfsson, P. Ekman, P.-O. Hedlund, and H. Wikström; Uleåborg, Finland—O. Lukkarinen; Uppsala, Sweden—A. Bill-Axelson, M. Häggman, and B.-J. Norlén; Västerås, Sweden— L. Karlberg; Växjö, Sweden—G. Hagberg; Örebro, Sweden—S.-O. Andersson and J.-E. Johansson; Reference Pathologists—C. Busch (chair), M. de la Torre, A. Lindgren, and S. Nordling; End Point Committee—J.-E. Damber, Department of Urology, University Hospital, Göteborg, Sweden; A. Lindgren, Department of Pathology, University Hospital, Uppsala, Sweden; E. Varenhorst (chair), Department of Urology, University Hospital, Linköping, Sweden. Manuscript received September 20, 2006; revised January 19, 2007; accepted February 15, 2007.
Vol. 99, Issue 7
|
April 4, 2007