Tumor diffusion and metabolism in head and neck cancer: pretreatment multimodality imaging with DW-MRI and 18F-FDG PET J. F. Jansen1, H. Schoder2, Y. Lu2, H. E. Stambuk2, D. Srisaranard2, N. Y. Lee2, S. G. Patel2, J. P. Shah2, J. A. Koutcher2, and A. Shukla-Dave2 1 Maastricht University Medical Center, Maastricht, Netherlands, 2MSKCC, NY, NY, United States Introduction For the study of tumor microenvironment characteristics, the application of multimodality imaging (MMI) techniques can yield information on metabolism and biology [1]. Whole body Diffusion Weighted Imaging (DW-MRI) is increasingly becoming popular in the oncological setting for the detection and staging of metastatic disease [2]. This application allows DW-MRI to enter the territory traditionally held by 18F-Fluorodeoxyglucose (18F-FDG) positron emission tomography (PET). This is not surprising, considering the noninvasive and cost-effective nature of MRI. However, it is important to investigate whether these two techniques are complementary, or whether they provide independent information on tumor microenvironment. This study focuses on pretreatment MMI data obtained with DW-MRI (not whole body) and 18F-FDG PET in advanced head and neck cancer (HNC) patients for more precise assessment of tumor biology and metabolism in vivo. Additionally, the effect of different pathology such as squamous cell carcinoma (SCC) and lymphoepithelioma (LE) cancer is investigated. Material and Methods Patients 42 newly diagnosed HNC patients with metastatic nodes (M/F: 30/12, age: 60±18y, primary cancer: 31 oropharynx; 11 nasopharynx) were included. Thirty-six patients had SCC, and six patients had LE at pathology. Tumor diffusion and metabolism was assessed with DW-MRI and 18F-FDG PET imaging prior to chemo-radiation therapy or surgery. MRI MRI was performed on a 1.5 Tesla GE Excite scanner using an 8-channel neurovascular phased-array coil. The protocol consisted of MR imaging covering the entire neck or oral cavity/tongue. DWI images were obtained by using single-shot spin-echo echo-planar imaging. Parameters: TR = 4000 ms, TE = 85-98 ms, averages = 4, slice/gap thickness = 5.0/0 mm, FOV = 20-26 cm, matrix =128x128, and 3 directions, b values: 0, and 1000 s/mm2. PET PET examinations were performed on either GE or Siemens combined PET/CT scanners. Before the PET examination, patients fast for at least 6 hours. Patients were injected with 12–15 mCi of 18F-FDG intravenously. After a 45- to 60- minute uptake period, a PET/CT study was acquired with the patient in the same treatment position. Analysis Image processing was performed using Matlab and SPM. Gaussian smoothing was applied on all images with a FWHM of 3 mm. For each patient, masks were created using MRIcro, to select regions of interest (ROI) of the neck nodes. ROIs were manually drawn by an experienced neuro-radiologist on the b=0 image. Tumor volume was calculated from total voxel size. Fits were performed on a voxel-by-voxel basis using: ln[S(1500)]=ln[S(0)]-1500·ADC, where S is the signal intensity, and ADC is the apparent diffusion coefficient (10-3mm2/s). Histogram analysis was performed on all pixels within the ROI, which yielded the mean and standard deviation (std) of the distribution of all pixels. 18F-FDG images were transferred to a workstation for image analysis. 18F-FDG uptake by the tumor was assessed by an experienced nuclear medicine physician. Semi-quantitative analysis included calculation of standardized uptake value (SUV) measurements and total lesion glycolysis (TLG, = SUV*volume). Additionally, as a secondary measure, relative measures rADCmin (ADCmin/ADCmean) and rSUVmax (SUVmax/SUVmean) were calculated [3]. Statistical analysis Independently for each pathology (SCC and LE), Spearman correlation coefficients between all DW-MRI and 18F-FDG PET measures were calculated in SPSS 17.0 (p<0.05 = statistically significant).
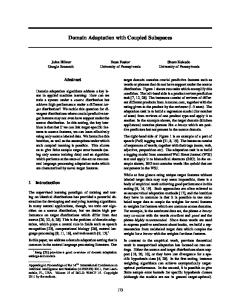
Figure 1: Corresponding multimodality images of a patient with tonsil SCC (M/44y). (A) T2fatsat, with node marked in red. (B) DW-MRI b=0 image, and (C) matching 18F-FDG PET image.
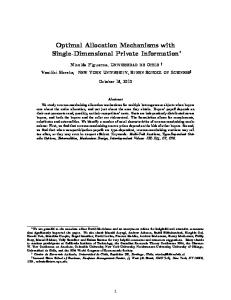
Results and Discussion For the primary measures, the only significant correlation in the 36 SCC nodes was between tumor volume (MRI) and TLG (ρ=0.57, p = 0.0001), which is in accordance with literature [4]. No significant correlations for primary measures were found in LE. As there is no evidence of significant correlation between diffusion measures (DW-MRI) and glucose metabolism (18F-FDG PET), the two techniques seem to provide independent information for both SCC and LE, not surprising given their completely different biophysical and biochemical foundation. When the secondary measures rADCmin and rSUVmax were added to the correlation analysis, various significant correlations were observed. SCC: rSUVmax with ADCmean (ρ=0.40, p = 0.016, see figure 2), and rSUVmax with std(ADC) (ρ=0.433, p = 0.047). LE: rSUVmax with ADCmean (ρ=0.83, p = 0.042, see figure 3). These results indicate (both for SCC and LE), that a higher average molecular motion (ADC) is associated with rSUVmax, which can be interpreted as a measure for tumor heterogeneity [3]. Possibly, necrotic tissue might underlie this correlation, as necrosis leads to higher ADC vales, and more heterogeneous regions. Finally for SCC, rSUVmax is associated with std(ADC), which is consistent with the notion that both are measures for tumor heterogeneity [5]. The associations between DW-MRI and 18F-FDG were not distinctly different for SCC and LE, i.e. similar trends were obtained for the two different pathologies. It seems that DW-MRI and 18F-FDG might not be useful to differentiate SCC from LE. However, as the LE group only contained 6 subjects, it is hard to make definite conclusions. Conclusion In head and neck cancers, DW-MRI and 18F-FDG seem to provide independent information on tumor microenvironment for both SCC and LE. However, information regarding the heterogeneous nature of tumors, obtained using the two techniques, seems to be complementary. Acknowledgement: This research was supported by NIH RO1-CA 115895 References [1] Plathow, J Nucl Med. 2008 49:43S; [2] Chen, Magn Reson Imaging. 2010 28(5):613; [3] Ho, Eur J Nucl Med Mol Imag. 2009 36:200; [4] Burri, Int J Radiat Oncol Biol Phys 2008 71:682; [5] Lee, Ultrasound Med Biol. 2006 32:1817. ρ = 0.83 p = 0.042
ρ = 0.40 p = 0.016
Figure 2: Correlation between rSUVmax and ADCmean for SCC.
Proc. Intl. Soc. Mag. Reson. Med. 19 (2011)
Figure 3: Correlation between rSUVmax and ADCmean for LE.
2446