PREDICTION OF NETWORK LOAD IN BUILDING AUTOMATION Mario Neugebauer, J¨ orn Pl¨ onnigs, Klaus Kabitzsch
Dresden University of Technology Institute for Applied Computer Science Dresden, Germany
Abstract: The process of designing building automation networks is a very challenging task due to the inherent complexity. During the design process performance evaluation is essential for high reliability and cost efficiency. Therefore, no tool is available up to now, although in other fields of research sophisticated methods for analyzing the system performance exist. In this paper we introduce a method that comprehensively integrates the entire system to evaluate the performance fast and autonomous. By approximating the environment, automatically modelling the network components and analyzing the interrelations we achieve not only a specific load prediction, but also suggestions c for optimization. Copyright 2003 IFAC Keywords: Performance Evaluation, Fieldbus, Load Forecasting
1. INTRODUCTION Today, it becomes more and more common to apply fieldbus control systems for complex tasks in building automation. The need to provide different features cause service providers to mount their devices on one fieldbus system. Interoperability guidelines and standardization for building automation fieldbusses make it easy to install components independent of their functionality. This flexibility definitely is an advantage. Trades can act without the overhead of centralized coordination during the design phase, but each service provider can have different demands of bandwidth. Dimensioning the network can only be performed insufficiently if integration is done uncoordinatedly. In current practice it turns out that particular system integrators need to do the overall integration and bear the responsibility for the entire network functionality. Proper working of the building automation network needs to be assured
over the whole life-cycle of the fieldbus network. But, how about the tools for the integration? Manifold techniques for performance evaluation of networks already exist; even tools for analyzing IT-infrastructures are available. Also, the behavior of the building, has been examined in detail before. Further, design databases for implementing building automation networks are established. Unfortunately, there is no tool known which comprises all those features. We propose to cope with that insufficiency by merging all methods. The outcome will be a tool, able to perform the following tasks: • • • • •
assure sufficient use of medium identify dangerous load scenarios improve iteratively network performance assure long-term reliability parameterize for synergies
To reach those goals, the complexity of the entire network has to be reduced. Therefore, high demands according to formal analytics need to be
met. This means to analyze the actual network as well as the environment. In addition, the results need to be abstracted for ease of use and there should not be any extraordinary hardware demands. We propose automatic load calculation for large size building networks, with more than 100 nodes and several channels. On the one hand, it is inaccurate to use strong, abstract static methods. On the other hand, detailed analysis is not recommended to be done by hand. Thus, there is a need for an automatable algorithm. To establish a basis for our work we will analyze the research done in the area of network load prediction. Subsequently, in the third part, a new concept for comprehensive network performance prediction will be proposed. Thereby, we will attempt to cope with the insufficiencies that occur in other approaches. In the fourth section we will discuss the mentioned concept based on an implementation for a certain fieldbus system. 2. RELATED WORK 2.1 Basic Load Calculation In (Schmalek, 1995) the performance evaluation has been done for fieldbusses (i.e. LonTalk). The load behavior of networks of different sizes has been analyzed, but the network performance was not investigated starting with the load assumptions of real networks with different load behavior of the nodes. Beside these works research for load prediction in LON has been done by Florstedt within a diploma thesis in 1999 (see (Florstedt, 1999)). This work comprises an approach to implement a tool for load prediction in field bus networks and resulted in a prototyped software package. It provided the ability to build and configure a simple field bus network (based on the LonWorks standard) and to perform a static load prediction. The network structure has to be managed in text files without support. Based on this proposal for solution we will build a more complex and efficient tool. 2.2 Simulation of Fieldbus Systems In (Schwarz and Donath, 1997) and (Donath et al., 1997) a detailed example of a small automation task is discussed. As a basis for the whole simulation the hardware modeling language VHDL is used. With the results from (Miskowicz et al., 2002) we can get an idea of the channel behavior in different load scenarios (e.g. throughput, collision rate, etc.). If we consider all parameters influencing the channel load as the input space,
then all points in this space (and the corresponding channel reactions) cannot be determined in a reasonable time frame. The simulation approach has certain disadvantages. First of all, achieving resonable results is always extremly time-consuming, especially for large-size networks. Furthermore, the networks of interest have to be edited without support. For fast performance evaluation of fieldbus networks in building automation, the estimation by simulation is inappropriate.
2.3 Commercial Tools for IT-infrastructures HyPerformix (Inc., 2002) and OPNET Guru (OPNET Technologies, 2003) are representative software packages in this area. With these products it is possible to perform an evaluation of an enterprise-wide network structure. The ITinfrastructure can be modeled, managed, analyzed and optimized comprehensively. User models and a wide range of hardware models are available to emulate and finally predict the performance of a future IT-infrastructure. The existing tools cannot be adapted to the domain of fieldbus networks for building automation. But, we want to pick up the idea of all-inclusive-prediction and bear it in mind for our further work.
2.4 Queuing Networks Queuing network analysis is a well-known technique to estimate the performance of systems. As long as the process to investigate is in some way to model in queues, this powerful analysis method can help to design, gain experience about and optimize it. The main idea of this theory is to describe the system with interconnected queues and servers. Of course, for large systems the representing queuing model becomes rather large as well. To cope with these problems, tools for the automated queuing network analysis can be used. One example is the function library PDQ (pretty damn quick)(Gunther, 2000). It provides the ability to compute relatively large queuing networks in a short time. Though, generating and specifying a model is rather circumstantial. It has to be done in C-files. As a result of the computation, PDQ offers manifold information about the analyzed system (e.g. utilization of the servers, residence times and delays). But only with the knowledge of the environmental behavior and the corresponding impact on the queuing model, common-sense results can be achieved.
2.5 Traffic analysis and generation Performance estimation for a wide range of networks is only as good as the traffic models, presumed for the application domain. As an example of traffic characterization in a different application domain the approach in (ETSI, 1998) remains to be mentioned. Another approach to generate traffic for experimental purposes is to simulate the process (building with physical properties). In (Metzger, 1999) for instance, a new method for the generation of flexible and complex simulations is described. Research done in the area of building simulation delivers comprehensive results for physical building behavior. Though, simulating or measuring the physical network environment is too complex. Therefore, generalized models of the physical behavior are needed for further application in the all-inclusive performance evaluation.
3. CONCEPT In our (all-inclusive) approach we want to meet the following boundary conditions: • specialized in building automation • advanced standardization of the devices and fieldbusses • large-size networks that are only automatically processable • no specialized or extraordinary hardware demands and fast computation • easy to use with minimized pre-editing by the user We propose a new method for performance evaluation of large-size networks. Our approach (see Figure 2) is based on a simple assumption: the mean load Lmean of a channel results from the number of messages ni,j sent by the ith connected device via the j th output connection and their individual message sizes si,j over a representative period of time T . It results in
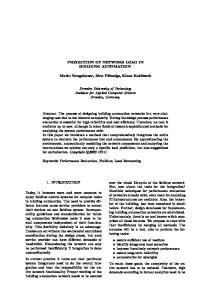
For a calculation based on this assumption comprehensive information about the network is needed. First, the logical topology of the network has to be known. The physical dimension of the network is negligible as long as the maximum transmission time is much smaller than the sending time of a message and physical closed loops are excluded. Normally these demands are fulfilled in CSMA based networks. To calculate the load automatically it is recommendable to generate a database ((1) in Figure 2) containing the logical topology of the network, for example extracted from an existing network design database. The inherited logical network topology needs to be analyzed (3) to restore the way each message takes from the sender device to a destination device. Furthermore, it is necessary to know the size of each sent message. In common building automation systems the message size is standardized. Based on these facts it is possible to group the message types in size classes with determined sizes. Additionally, it is necessary to know the arrival rate of each class. Normally a generalized one is used (see (Gunther, 2000)), but in the focus of building automation a more accurate arrival rate estimation (2) is possible. It can be deduced from the behavior of the used devices since it depends on known physical processes. Devices can be classified by their input-output arrival rate relation in three classes, load sources (output arrival rate is independent from the input), load processors (output arrival rate depends on the device input) and load sinks (only input). For example, a sensor typically is a load source, an event based controller a typical load processor and an actuator a load sink. This classification enables
load source
Lmean =
1 T
ND NX out,i X
si,j · ni,j ,
(1)
load processor
load sink
Fig. 1. classification of devices
i=1 j=1
with ND for the number of devices connected to the channel and Nout,i for the corresponding number of connections, going out from this device. In queuing network calculation (see 2.4 above) the message number normalized to the time is called arrival rate λi,j , which is to determine by λi,j =
ni,j . T
(2)
a bottom-up calculation for the whole network, as long as it is possible to estimate the load sources. However, the estimation of the arrival rate for load sources is difficult as the behavior of sensors among others depends on the environment. To estimate the arrival rate for all load sources of a building a complex environment model is needed. This model depends furthermore on the load sinks (e.g. HVAC units). Such a complex dynamic model extends automatic load calculation.
A collection of representative static cases is more functional. The load calculation (4) of a network can be done from the resulting arrival rates, message size classes and the logical network topology easily.
Netplan experiment
Besides this load calculation the collected information can be used in a classical queuing network (5) (see 2.4). With the help of this model, the average transmission time of a message can be calculated. Both models result in an abundance of data, no system integrator can cope with. Hence, the system needs to analyze the results (6) and extract the critical states, for example overloaded channels. Nevertheless, the resulting complexity enables more than just load analysis. Advanced predictions can be made, such as instable closed loop controls or wrong network parameterization. And, as the system possesses the complexity, it can suggest solutions as well. This data mining should be fast and reliable. 4. CASE STUDY Currently, we are implementing the concept presented before for the LonTalk protocol in a project named NetPlan. LonTalk (ANSI/EIA 709.1; ENV 13154-2) has been developed in the late 80’s and has grown to one of the most popular building automation bus systems since then. It implements all 7 OSI layers as the only one beneath them. Beside the LonTalk protocol specification (see (LonTalk Protocol Specification, 1994)) some recommended standards exist. The LonMark Interoperability Association dedicated itself to elaborate standardized interfaces based on Standardized Network Variable Types and standardized behaviors with Functional Profiles (see (Dietrich et al., 2001)). The dataflow chart and the functional blocks of our tool is shown in Figure 2. It represents the concept introduced in section 3. The single steps will be explained in more detail in the following subsections. 4.1 Import to the NetPlan Database A LON network can be developed using different software tools (see (St¨ ocklhuber, 1999)). A growing number of them use the standardized LNS database developed by Echelon. To offer an open interface for these tools we establish our approach on this database. The whole network topology is imported from the LNS database in an internal NetPlan Database. This separated database enables us to store results and allows the user to
LNS
design
1
import to NetPlan database
devices, device classes, network variables 2
bindings, channels, routers
3
arrival rate estimation
binding segmentation
arrival rate per binding
connections per binding 4
system integrator
load calculation load per binding, device, channel
load per connection 5
6 engineering suggestion
engineering consulting delay time per message
queuing network analyzer
Fig. 2. dataflow chart of the implementation experiment in our network, without changing the real one.
4.2 Arrival Rate Estimation The network topology represented in the LNS database uses an application layer model including Network Variables and bindings to connect them. These Network Variables are normally Standardized Network Variable Types. Therefore, their size is known and enables categorization in size classes. For each Network Variable of each device the arrival rate needs to be approximated. In the first step, this is done for the load sources, after classification of the network devices in load sources, load processor and load sinks. Most of them use the parameter MinSendTime TminS , MaxSendTime TmaxS and SendOnDelta d to influence their sending behavior. The SendOnDelta describes how much the input signal has to change for a new message. The MinSendTime is the minimum time that has to pass between two messages; the MaxSendTime is the maximum time without a message and enables a heartbeat cycle. The arrival rate results from these parameters in � �� � 1 1 |∆| λ = min . (3) ; max ; TminS TmaxS d The adjusted values of TminS , TmaxS and d are stored in the LNS database. Only the absolute
rise |∆| of the input signal needs to be determined. This has been done for some typical and special cases of characteristic input signals in building automation, e.g. outside temperature, humidity. These characteristics have to be associated to the Network Variables, by analyzing the relations between Functional Profiles and Standardized Network Variables Types. The arrival rate can be automatically estimated for all load processors and load sinks by input superpositioning.
4.4 Load Calculation Load calculation can be done easily when the communications and arrival rates are known. Summation of the used connections (Equation 1) leads to specific load for all channels. Vertical summation over all channels in Figure 4 leads to the following result for the load at all channels: L1 = λ1,2 s1,2 + λ2,1 s2,1
(4)
L2 = λ1,2 s1,2 + λ2,1 s2,1 + λ3,2 s3,2 + λ3,4 s3,4 + λ4,3 s4,3
4.3 Binding Segmentation
A message between two devices can be transmitted in large networks over many channels. This transmission is controlled by routers. The information about the way a message takes, is not accessible in the LNS database and needs to be reengineered. We use the recommended routing algorithm in (LonTalk Protocol Specification, 1994) to rebuild the routing tables of the routers. After this, each binding is separated into communications. A communication is a directed connection between two network elements in the same channel involved in the transmission of a message over a network (e.g. two routers in one channel (see Figure 3)). device X
(6)
channel 3
channel 1
channel 2
L3 = λ1,2 s1,2 + λ2,1 s2,1 + λ3,2 s3,2 .
The application layer model needs to be transferred to a physical layer model to analyze the load on the physical channels. This is done in the binding segmentation.
binding
(5)
1
2
1
2
Binding 1
Binding 2
2
3 3
4
3
4
Binding 3
Fig. 4. load superpositioning
device Y
4.5 Queuing Network Analysis
5
Y 4
channel 3
channel 1
3
router B
6
X device X
2
Y device Y
1
channel 2
X
router A
communications
Fig. 3. binding segmentation Additionally each sent application layer message can release protocol messages, as acknowledges, authentications or repetitions. These responses can be directed toward the information sender. For each protocol message the way it takes is rebuilt with communications as well. In the end, a single binding can result in up to (3 · 127 · 255)+1 (authentication; 127 group members; 255 channels) communications, with different message sizes and directions, representing the transmitted messages in all channels on physical layer.
With the results of the binding segmentation a complete queuing model will be built. Therefore, each component of the network (all devices, network elements, channels) is described in a service center, consisting of queues and servers. The several parts are connected properly to achieve a comprehensive representation as a queuing model for the calculation of the network performance (e.g. processing times, transfer delays times).
4.6 Engineering Consulting All available results need to be reduced to the important facts. This is done with a set of simple rules applied on the results. The remaining simplified output is presented to the user. He will be supported by a cause analysis and appropriate solutions. Independently he can investigate in more details.
5. CURRENT STATE AND FURTHER WORK At the moment we are still implementing the introduced concept. The first prototype of the load calculation has been proved in some test cases but a broad practical validation needs to be completed. Detailed research in the area of automatic association of the arrival rates to devices (see 4.2) is needed. Also, the queuing network model needs to be adapted to our requirements. The rules for Section 4.6 are only rudimentarily defined and need to be specified. We plan to detect the following things: • • • • • •
top 10 of the load producing devices top 10 of the network bottle necks wrong parameters violated transfer time demands stability in cyclic closed loop controls detection of logical and load loops
Particularly, the stability of closed cycle controlling in event based network and controllers needs more investigation.
6. CONCLUSION With our concept the mean load in each network element can be calculated automatically and fast. The included queuing network analyzing estimates even the mean delay time of each message and the queue length. An efficient data mining reduces the results to the important facts. But, our concept of the all-inclusive-prediction offers more than simple performance evaluation. It can automatically detect problems and assist a system integrator to solve and avoid them. We think we will be able to: • • • • •
optimize positioning of routers tune device parameters to reduce load optimize parameters to fulfill time demands optimize controllers for better performance optimize network for use or emergency cases
This supports a system integrator in analyzing and optimizing his network and last but not least to save money.
7. ACKNOWLEDGEMENT The project, the present report is based on, was promoted by the Federal Ministry of Education and Research under the registration number 13N8177. The authors bear all the responsibility for contents.
REFERENCES Dietrich, Dietmar, Dietmar Loy and Hans-J¨ org Schweinzer (2001). Open Control Networks. Kluwer Academic Publishers Boston. London. Donath, Ulrich, Peter Schwarz, U. Hartenstein and Klaus Kabitzsch (1997). Simulationsunterst¨ utzung f¨ ur den Entwurf von Feldbussystemen. In: Proc. FeT 97 Conference Fieldbusystems in Applications. Wien. pp. 263– 270. ETSI (1998). Universal Mobile Telecommunications System; Selection procedures for the choice of radio transmission technologies of the UMTS. Technical report. ETSI. Florstedt, Thomas (1999). Erstellung und Implementation von Algorithmen zur Vorhersage der Bandbreitenauslastung innerhalb von verteilten Rechnersystemen. Master’s thesis. Dresden University of Technology, Institute for Applied Computer Science. Gunther, Neil J. (2000). The Practical Performance Analyst. iUniverse.com Inc.. Lincoln, Nebraska. Inc., HyPerformix (2002). http://www.ses.com. LonTalk Protocol Specification (1994). 3.0 ed.. Palo Alto. www.echelon.com. Metzger, Andreas (1999). An Interlink of Building Control Prototypes and the Lightning Simulation Lumina. Technical report. University of Kaiserslautern. Kaiserslautern. Miskowicz, Marek, Maria Sapor, Marcin Zych and Wojciech Latawiec (2002). Performance Analysis of Predictive p-Persistent CSMA Protocol for Control Networks. In: 4th IEEE International Workshop on Factory Communication Systems. V¨ asteras, Sweden. pp. 249– 256. OPNET Technologies, Inc. (2003). http://www.opnet.com. Schmalek, Richard (1995). Analyse des Zeitverhaltens von LONWorks. In: Automatisierungskonzepte mit dezentraler Intelligenz (LONWORKS), Workshop und Ausstellung. Dresden, Germany. Schwarz, Peter and Ulrich Donath (1997). Simulation-based Performance Analysis of Distributed Systems. In: International Workshop Parallel and Distributed Real-Time Systems. pp. 244–249. ¨ St¨ ocklhuber, Andreas (1999). Eine Ubersicht u ¨ber die wichtigsten LON-Programmiertools. In: de-Special: Bussysteme f¨ ur die Geb¨ audeinstallation. pp. 143–146. H¨ ultig & Pflaum Verlag GmbH & Co Fachliteratur KG. M¨ unchen / Heidelberg.