Neuron, Vol. 44, 877–888, December 2, 2004, Copyright ©2004 by Cell Press
Prediction Error during Retrospective Revaluation of Causal Associations in Humans: fMRI Evidence in Favor of an Associative Model of Learning Philip R. Corlett,1 Michael R.F. Aitken,2 Anthony Dickinson,2 David R. Shanks,3 Garry D. Honey,1 Rebekah A.E. Honey,1 Trevor W. Robbins,2 Edward T. Bullmore,1 and Paul C. Fletcher1,* 1 Brain Mapping Unit Department of Psychiatry University of Cambridge School of Clinical Medicine Addenbrooke’s Hospital Cambridge CB2 2QQ United Kingdom 2 Department of Experimental Psychology University of Cambridge Downing Street Cambridge CB2 3EB United Kingdom 3 Department of Psychology University College London Gower Street London WC1E 6BT United Kingdom
Summary Associative learning theory assumes that prediction error is a driving force in learning. A competing view, probabilistic contrast (PC) theory, is that learning and prediction error are unrelated. We tested a learning phenomenon that has proved troublesome for associative theory —retrospective revaluation—to evaluate these two models. We previously showed that activation in right lateral prefrontal cortex (PFC) provides a reliable signature for the presence of prediction error. Thus, if the associative view is correct, retrospective revaluation should be accompanied by right lateral PFC activation. PC theory would be supported by the absence of this activation. Right PFC and ventral striatal activation occurred during retrospective revaluation, supporting the associative account. Activations appeared to reflect the degree of revaluation, predicting later brain responses to revalued cues. Our results support a modified associative account of retrospective revaluation and demonstrate the potential of functional neuroimaging as a tool for evaluating competing learning models. Introduction Associative and rule-based accounts compete in trying to explain how people detect and assess the strength of relationships in the environment (Allan, 1993; Price and Yates, 1995). Associative theories (e.g., Rescorla and Wagner, 1972) assume that learning is driven by a prediction error generated either by the unexpected *Correspondence:
[email protected]
occurrence of an outcome or by its unexpected omission. This mechanism is thought to play a role not only in behavioral conditioning but also in predictive and causal learning in humans (De Houwer and Beckers, 2002; Dickinson, 2001). Conversely, under a rule-based scheme such as probabilistic contrast (PC) theory (Cheng and Novick, 1992; Cheng, 1997), humans are assumed to be intuitive statisticians. They encode representations of event frequencies during learning and combine that information according to an arithmetic rule to arrive at a causal judgment. Expected and unexpected events contribute equivalent frequency information. Recent fMRI studies have provided neurobiological support for error-dependent associative accounts of causal learning (Fletcher et al., 2001; Turner et al., 2004). Associative accounts are, however, challenged by demonstrations that causal judgments can be revalued retrospectively. Suppose that I learn that a meal consisting of chicken and fish causes an allergic response and then I make some causal inference about the allergenic potential of both foods. If, in a subsequent meal, I eat chicken alone and do not experience the reaction, then I may adjust upwards my rating of the allergenic potential of the absent food (fish) to reflect the fact that this food must have caused the allergy following the meal of both chicken and fish. Such an increment in the response to the absent cue is an example of unovershadowing because it is assumed to reflect a release from the overshadowing that occurred between the foods during the initial compound meal. Conversely, if I find that eating the chicken alone causes the allergic reaction, there would be grounds for decreasing my belief in the allergenic potential of the absent fish on the assumption that the presence of the chicken in the initial compound meal was sufficient to cause the reaction. This form of causal inference is called backward blocking, because the causal attribution to the chicken alone retrospectively blocks the attribution to the fish. There is good evidence for the occurrence of both of these forms of retrospective revaluation in human causal learning (Van Hamme and Wasserman, 1994; Shanks, 1985), although the absolute magnitude of the unovershadowing can be greater than that of backward blocking (Larkin et al., 1998; Aitken and Dickinson, 2004). While the phenomena are easily explained by PC theory, they pose problems for standard associative accounts, which, hitherto, had implied that error-dependent learning was applicable only to cues that are present during a trial. These problems have been dealt with by a modification of the theory (Dickinson and Burke, 1996; Van Hamme and Wasserman, 1994). This modification requires us to make three assumptions. First, eating the chicken alone retrieves a representation of the absent food, the fish, through a within-compound association established during the chicken-fish meal in order to support learning about the absent cue. Second, the presentation or omission of the allergic reaction following the chicken generates a prediction error. Finally, pairing a retrieved representation of an absent cue with a predic-
Neuron 878
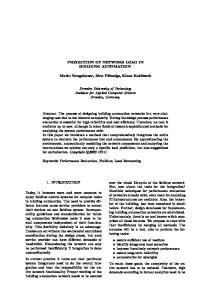
Figure 1. Schematic of Experimental Design The key event types are shown (control items are described in the text and in Table 1). During stage 1, subjects learned that certain food pairs were invariably predictive of an allergic response (jagged red outline). When subjects had learned this (across 12 trials for each food pair, with a total of six different food pairs plus control items), single items were presented during stage 2, and in each case, one of the foods from each pair was present while the other was absent. For half of these foods, an allergic reaction occurred (leading to backward blocking of the absent food), and for half, no reaction occurred (green box), leading to unovershadowing of the absent food. If retrospective revaluation had indeed occurred during stage 2, the subject would now have differing expectations about the absent foods. This would lead to different levels of prediction error depending upon whether that food was now seen to cause an allergic reaction or not. Thus, for backward blocked items (in this case bananas), an allergic response would be more surprising than for unovershadowed items (in this case cheese). Conversely, the lack of an allergic response would be more surprising for cheese than for bananas. Note that the revaluation stage engenders different expectations for items that have precisely the same degree of familiarity and associative history, meaning that we can dissociate prediction error from these frequently confounding factors.
tion error engenders the opposite change in associative strength to that produced by pairing the same prediction error with a presented cue. Therefore, any prediction error that reduces the associative strength of the chicken should, by contrast, enhance the strength and hence the causal status of the absent fish. PC theory conceives of retrospective revaluation as a process of separating the effects of confounding causes in light of the complete history of prior trials. This disambiguation involves partialling out the effects of alternative causes by the computation of conditional probabilistic contrasts in light of the information from all learning trials. Macho and Burkhart (2002) suggest that judges implicitly follow a qualitative version of these computations. Importantly, whether an event is surprising or not is immaterial. The current event-related fMRI study was devised to explore the brain basis for retrospective revaluation in an effort to evaluate these models. Our design used a variation of a standard two-stage retrospective revaluation design (e.g., Dickinson and Burke, 1996). In a threestage procedure, subjects were required to learn about the allergenic potentials of various imaginary meals. In the first stage, cooccurrence of a particular compound food cue with an outcome (allergic response) engenders standard learning of a causal relationship. In the second stage, one of the foods from the compound is presented alone either with an allergic response (backward blocking)
or without the response (unovershadowing). Under a rule-based account, such as the PC model, no trial type is specially privileged, and the subjects merely update their representation of outcome frequencies in light of the training trials. Probabilistic contrast models, therefore, do not predict a unique neural signature for trials on which retrospective revaluation occurs. In contrast, associative theory posits prediction error as part of this process.
Table 1. Experimental Design Stage 1 (12)
Stage 2 (6)
Stage 3 (6)
A1B1⫹ A2B2⫹ C1D1⫹ C2D2⫹ E1F1⫺ E2F2⫺ I⫹ J⫺
A1⫹ A2⫹ C1⫺ C2⫺ F1⫺ F2⫺ I⫹ J⫺
B1⫹b B2⫺a D1⫹a D2⫺b F1⫺ F2⫺ I⫹ J⫺
Each letter represents a different food picture (counterbalanced across subjects); ⫹ indicates the presence of an allergic reaction, and ⫺ indicates the absence of an allergic reaction. Numbers in parentheses indicate the number of repetitions of each trial type for that stage. a Confirmation of learned expectancy. b Violation of learned expectancy.
fMRI and Associative Mechanisms of Causal Learning 879
Figure 2. Behavioral Results (A) Stage 1: prelearning. The average responses for two types of meal from stage 1 are shown across the twelve trials (x axis). The y axis reflects the type of response multiplied by a measure of the confidence with which it was made (expressed as the number of milliseconds for which subjects held down the response button, divided by 4000 [the total number of milliseconds during which a response could be made]). For each subject, the responses from the second to the twelfth trial were normalized with respect to the response (necessarily a guess) made on trial one. Standard error bars are shown. The graph shows that subjects learned to predict appropriately with high confidence by the end of this learning period. (B) Stage 2: retrospective revaluation (unovershadowing and backward blocking). Averaged combined predictive and confidence measures were calculated (as for [A]) for the six trials. It can be seen that subjects began with a tendency to predict an allergic response (unsurprisingly given the pretraining for these items). This effect strengthened for the backward blocking condition (chilies) and reversed for the unovershadowing condition (hamburger). (C) Predictive responses to first presentation of revalued items during stage 3. The impact of stage 2 can be seen. Bars show the prediction, multiplied by confidence (with the standard error of the mean). The impact of stage 2 revaluation is seen in the different height of the bars. This impact was primarily upon confidence: following the backward blocking condition, subjects predicted an allergic response but did so with less confidence than following unovershadowing. (D) New learning of revalued items across stage 3 when paired with an allergic reaction. (E) New learning of revalued items across stage 3 when paired with no allergic reaction.
Our attempt to distinguish between these two explanatory approaches to retrospective revaluation is based on the assumption that the hemodynamic response in a specific area of right lateral prefrontal cortex (PFC) reflects the occurrence of prediction errors (Fletcher et al., 2001; Turner et al., 2004). In these two previous studies, we observed that activation here in association with two different causal learning paradigms can be predicted by formal associative learning theory, being greatest at the outset of learning, attenuating with time, and re-evoked when learned contingencies are violated (Fletcher et al., 2001). Moreover, we have shown that the right frontal activation that is engendered by violated expectation is not explicable in terms of item or cueoutcome configuration novelty (Turner et al., 2004). We thus use right lateral PFC activation as a signature for
the occurrence of prediction error, and our findings would be consistent with an associative, rather than a rule-based, account if the following observations were made: first, retrospective revaluation should be accompanied by prediction error and should therefore activate this brain area. An absence of this activation would not favor an associative account of revaluation. Second, retrospective revaluation should set up modified views of the allergenic potential of the absent, revalued foods. Therefore, in a modification of the standard design, we added a third stage in which the absent foods were presented once again, this time alone. The revaluative process during stage 2 should have engendered differing expectations to backward blocked and unovershadowed foods, and we tested the brain response as a function of whether these expectations were met or
Neuron 880
violated. We predicted a response in right lateral PFC to such violations. Finally, the use of fMRI offers us an opportunity to relate the magnitude of revaluationdependent brain activity during the revaluation stage to that found during the subsequent violation stage. The task design is summarized in Figure 1 and Table 1. Results Behavioral Results Subjects’ predictive responses for each of the stages and conditions are summarized in Figure 2. Figure 2A confirms that subjects quickly learned to make correct positive or negative predictions during the first two stages. When to-be-revalued items were presented in stage 2, there was a tendency to a positive prediction on initial trials, which rapidly changed to strong negative prediction for the unovershadowing condition. At stage 3, we were especially interested in the initial predictions accompanying items that had been absent, but revalued, during stage 2. The prediction is that unovershadowed items should be accompanied by a stronger initial prediction of an allergic response than backward blocked items. Figure 2C shows the subjects’ mean predictive responses for the first trial of each type. The unovershadowed item engendered an apparently stronger prediction of an allergic response than the backward blocked item. A paired Student’s t test (df ⫽ 1,12) showed a trend for a difference (one-tailed p ⫽ 0.08). (We note too that, in a follow-up drug study using the same paradigm, subjects on placebo showed this difference between responses to unovershadowed and backward blocked items [p ⬍ 0.05].) Figures 2D and 2E show the changing predictive responses to retrospectively revalued cues across stage 3, depending upon whether they were accompanied by an allergic reaction (Figure 2D) or not (Figure 2E). FMRI Results Brain Activations Accompanying Retrospective Revaluation at Stage 2 Combined Retrospective Revaluation versus Controls. Table 2 summarizes regions showing greater activation for retrospective revaluation (unovershadowing plus backward blocking) than for control items. Within the set of regions of interest, activations surviving the chosen threshold were observed in PFC (right and left), anterior cingulate gyrus, ventral striatum, and substantia nigra. Figure 3 shows the location of the frontal, anterior cingulate, and striatal regions, together with plots of parameter estimates across the key activation and control conditions. Direct Comparison between Unovershadowing and Backward Blocking. Table 3 summarizes regions showing differential responses to backward blocking and unovershadowing. Note that, while activation in ventral striatum was greater for unovershadowing, no regions showed significantly greater activation for backward blocking. Combined Retrospective Revaluation versus Retrieval of Within-Compound Associations. Right prefrontal and ventral striatal activations were significantly greater for both backward blocking and for unovershadowing com-
Table 2. Retrospective Revaluation Activations: Stage 2 Region
x
y
z
Z Score
Retrospective revaluation (combined) versus controls Regions within fronto-striatal mask Anterior cingulate gyrus Left Right Caudate nucleus Left Right Left nucleus accumbens Prefrontal cortex Left Right Substantia nigra
⫺6 12
31 27
33 32
5.5 4.6
⫺14 14 12 ⫺16
17 8 21 9
⫺1 ⫺2 ⫺1 ⫺10
4.7 3.3 3.3 4.1
⫺40 ⫺46 46 57 14
3 28 30 25 ⫺20
29 21 19 25 ⫺5
4.5 4.3 3.9 3.4 4
Additional regions outside fronto-striatal mask Lateral parietal cortex Left Right Cerebellum Left Right Lateral prefrontal cortex (ventral) Left Right Precentral gyrus
⫺26 32
⫺72 ⫺56
39 38
4.9 6.2
⫺28 36
⫺77 ⫺62
⫺24 ⫺30
6 6
⫺38 30 ⫺32
19 25 ⫺3
⫺3 ⫺7 57
5.6 4.9 4.5
Coordinates (Talairach and Tournoux, 1988) converted from MNI space using a nonlinear transformation (www.mrc-cbu.cam.ac.uk/) and Z scores are shown for masked and unmasked comparisons.
pared to the trials engaging retrieval of within-compound associations. This is evidence that activation in these regions does not simply reflect the fact that subjects were being confronted with a single food that had, in the earlier trial, been paired with a companion food. These findings are reported in Table 3. Brain Activations during Stage 3 as a Function of Prior Retrospective Revaluation Main Effect of “Surprise.” Table 4 and Figure 4 indicate loci (within the right PFC region of interest) of activations accompanying the violation of revaluation-engendered predictions. As can be seen (Table 4 and Figure 4A), right PFC showed a main effect of this violation for the combination of post-unovershadowing and post-backward blocking prediction error. Direct Comparisons of the Effects of Expectancy Violation following Unovershadowing and Backward Blocking. On closer examination of the data, the main effect of surprise was carried almost completely by right PFC response to the nonoccurrence of allergic reaction in unovershadowed items. The direct comparison of the post-unovershadowing and post-backward blocking prediction error trials indicated that the former produced significantly greater activation in this region than did the latter (see Table 4 and Figure 4B). Figure 5 shows the relative locations of right PFC activation occurring at the time of unovershadowing (stage 2) and in association with post-unovershadowing prediction error. The degree of overlap in this region is striking.
fMRI and Associative Mechanisms of Causal Learning 881
Figure 3. Regions Showing Activation during Retrospective Revaluation at Stage 2 (A) Mask comprising regions of interest. This was generated using the “Pickatlas” tool (Maldjian et al., 2003) implemented in SPM2. The mask comprised right and left middle frontal gyrus, anterior cingulate cortex, striatum, and substantia nigra. (B) Group statistical parametric map, created using a contrast between all retrospective revaluation events (backward blocking plus unovershadowing) versus control items. Areas of significant activation (FDR: p ⬍ 0.05) are rendered onto structural MRI in standard space. A transverse slice at 19 mm above the AC-PC plane was chosen in order to show right prefrontal activations. The graph to the right shows parameter estimates from the voxel of maximal activation (x, y, z ⫽ 46, 30, 19). Activation in each of the two key conditions (backward blocking and retrospective revaluation) and their respective control tasks are shown relative to the fixation (“null”) events. (C) Group statistical map prepared as above. A coronal section 31 mm anterior to the ACPC plane was chosen to show anterior cingulate activation. On the right, parameter estimates from the voxel of maximal activation (x, y, z ⫽ ⫺6, 31, 33) in left anterior cingulate cortex are plotted. (D) Group statistical map prepared as above. A transverse section 1 mm below the AC-PC plane was chosen to show activation in the head of the caudate nucleus. On the right, parameter estimates from the voxel of maximal activation (x, y, z ⫽ ⫺14, 17, ⫺1) in left caudate are plotted. (E) Group statistical map prepared as above. A transverse section 10 mm below the ACPC plane was chosen to show activation in the left nucleus accumbens (note also activation in substantia nigra). On the right, parameter estimates from the voxel of maximal activation (x, y, z ⫽ ⫺16, 9, ⫺10) in left nucleus accumbens are plotted.
Investigating the Relationship between Neural Responses in Retrospective Revaluation at Stage 2 and Those Associated with Subsequent Violation at Stage 3 Our stage 3 index of the impact of retrospective revaluation indicated strongly that prediction error-dependent right PFC activation was found only following unovershadowing. We therefore restricted this analysis to the unovershadowing condition. We obtained subject-specific effects for unovershadowing (versus its control) from stage 2 and entered these into a simple regression model to identify where the magnitude of stage 3 postunovershadowing prediction error (versus its control condition) was predicted by the magnitude of the activation accompanying unovershadowing at stage 2. This was done for the right PFC and left ventral striatum maxima. (As we note in the Experimental Procedures, right PFC data from one subject were excluded because
this subject was suspected to be an outlier.) As is shown in Figure 5B, subjects showing greater activity in both regions at stage 2 also showed greater surprise-dependent activation at stage 3 (see Table 5 for coordinates of local maxima). Discussion There is good evidence that activation in both right lateral PFC (Fletcher et al., 2001; Turner et al., 2004) and ventral striatum (O’Doherty et al., 2003; McClure et al., 2003) signify the occurrence of prediction error. Thus, the observation of both during the retrospective revaluation trials has important implications for the psychological processes mediating retrospective revaluation, providing support for the modified associative account of human causal learning. The link between error-depen-
Neuron 882
Table 3. Differences between Retrospective Revaluation Activations: Unovershadowing and Backward Blocking at Stage 2 Region
x
y
z
Z Score
Unovershadowing ⬎ backward blocking Nucleus accumbens Caudate nucleus Left Right Substantia nigra
⫺18 3 ⫺10 0
⫺11 2.5 ⫺6 2.4
⫺14 14 12 ⫺10
18 22 6 ⫺18
5 4 ⫺4 ⫺8
2.2 2.2 2.1 2.1
—
—
—
Backward blocking ⬎ unovershadowing —
Unovershadowing ⬎ within-compound association retrieval Right lateral frontal cortex Caudate nucleus Left Right Nucleus accumbens Left Right
36
32
42
2
⫺14 8 14 22
⫺2 0
2.1 3
⫺18 4 16 13
⫺10 2.6 ⫺10 2.7
Backward blocking ⬎ within-compound association retrieval Right lateral frontal cortex
42 32
Nucleus accumbens Left
20 30
⫺14 10
28 36
3.2 3.2
⫺10 2.4
We also report direct contrasts between the two retrospective revaluation conditions and the within-compound retrieval condition.
dent brain activation and unovershadowing is further strengthened by the observation that stage 2 activations in right PFC predicted the ways in which subjects subsequently responded to the revalued cues. That is, at stage 3, if they had shown a higher degree of right frontal activation on unovershadowing trials during the prior stage 2, they showed a greater level of error-dependent right PFC activation when the consequent expectation (of an allergic response) was violated. Our interpretation is based upon previous demonstrations of right PFC activation in response to trials where, according to associative theory, there should be prediction error-dependent learning. The use of a mask derived from previous data makes us confident that the PFC
Table 4. Prediction Error-Dependent Activations at Stage 3 Region
x
y
z
Z Score
All “surprising” outcomes (post-backward blocking plus postunovershadowing) Right middle frontal gyrus Right middle/inferior frontal gyrus
44 36 34
27 32 15
26 17 25
2.6 2.3 2.1
30 31 13
15 39 37
2.8 2 2.9
Surprise following unovershadowing alone Right middle frontal gyrus Right middle/inferior frontal gyrus
38 44 32
Surprise following unovershadowing versus surprise following backward blocking Right middle/inferior frontal gyrus
42 28
26 17
13 27
2.1 2
activation observed in this study overlaps with the region identified by previous studies, although these studies explored different associative learning phenomena (Fletcher et al., 2001; Turner et al., 2004). In our previous studies, we referred to this region as right dorsolateral prefrontal cortex (DLPFC). We should point out that, while the main foci of error-dependent activation lie in DLPFC, activations reported here extend more ventrally into inferior frontal sulcus. For the purpose of interpretation, the critical observation is that we have used masking to ascertain that the region overlaps with that identified in our most recent study (Turner et al., 2004). However, in this instance, since the activations extend ventrally, we feel that it is more prudent to refer to the activation as lateral prefrontal. Of course, we must acknowledge that many previous cognitive activation studies have produced activation in right PFC (e.g., see Duncan and Owen, 2000; Fletcher and Henson, 2001), and, largely, the activation patterns have not been interpreted in terms of error-dependent learning. There are thus other possible interpretations for the right PFC activation occurring during stage 2. While we believe that our previous data have provided a strong link between this region and prediction error, and while the observation of right PFC activation at stage 3 of the current experiment also provides strong evidence in favor of this position, we must ultimately be cautious in drawing too specific an inference. Nevertheless, the accompanying ventral striatal activation in response to retrospective revaluation trials provides further evidence for the occurrence of prediction error at this stage. Moreover, the fact that both lateral PFC and ventral striatal activation are predictive of later surprisedependent frontal activation provides further support for our position. Standard associative learning models (e.g., Rescorla and Wagner, 1972), cannot account for learning about absent cues. Modifications are required (Dickinson and Burke, 1996; Van Hamme and Wasserman, 1994). One such modification is the formation and retrieval of withincompound associations. With reference to our study, during stage 1 associations are formed between foods presented in pairs, such that when one cue is presented, a representation of the absent-but-expected cue is retrieved from associative memory. This, of course, might mean that activations could reflect the retrieval of withincompound associations rather than prediction error. However, we link our right lateral PFC activation to errordependent learning in particular, since we observed that using a control task in which within-compound associations were also likely to be retrieved (i.e., using a food at stage 2 that had previously been paired with another food in stage 1; see F1⫺ and F2⫺ in Table 1), this comparison yielded activation in the predicted region of right lateral frontal cortex. This observation shows that the pattern of activation in right lateral PFC and ventral striatum does indeed reflect prediction error rather than within-compound associative retrieval. It is significant that unovershadowing, as assessed by violation-dependent brain activations at stage 3, was more marked than backward blocking. It seems that unovershadowing is a more profound form of revaluation, a suggestion that is in keeping with previous behavioral work (Larkin et al., 1998) and with the predictions
fMRI and Associative Mechanisms of Causal Learning 883
Figure 4. Regions Showing Activation in Response to Prediction Error during Stage 3 (A) Group statistical parametric map, created using a contrast between all cue-outcome pairings during stage 3 in which the stage 2 retrospective revaluation would be expected to result in a prediction error and all of those in which it would not. That is, we combined post-unovershadowing surprise and post-backward blocking surprise and compared these with post-unovershadowing and post-backward blocking “nonsurprise.” This contrast was confined to a region of interest generated by our previous studies identifying right PFC responses to prediction error (see text). Areas of significant activation (p ⬍ 0.01, uncorrected for multiple comparisons) are rendered onto structural MRI in standard space. Sections were chosen at x, y, z ⫽ 34, 15, 25 in order to show right PFC activation. (B) Graph of parameter estimates from the voxel at coordinates shown in (A). Activation in each of the surprise conditions (backward blocking and retrospective revaluation) and their respective, matched-outcome control tasks are shown relative to the fixation (“null”) events. It can be seen that the activation in this region appears greater during prediction error trials following unovershadowing: an effect that proved significant on direct comparison (shown in [C]). (C) Regions showing greater magnitude of prediction error-related right PFC activation following unovershadowing (versus its control) at stage 2 than following backward blocking (versus its control). Activation (p ⬍ 0.01, uncorrected for multiple comparisons) is rendered onto structural MRI in standard space. Sections were chosen at x, y, z ⫽ 42, 26, 13 in order to show the region of right PFC maximally differentiating these two conditions. (D) Graph of parameter estimates from the voxel at coordinates shown in (B).
made by a mechanistic account of associative learning theory: the modified Standard Operating Procedure (SOP) model (Dickinson and Burke, 1996). This model postulates excitatory and inhibitory associations that act in opposition to produce learning. A recent simulation of SOP-based revaluation (Aitken and Dickinson, 2004) indicates a more profound effect in unovershadowing than in backward blocking in keeping with our behavioral and imaging observations. While providing support for modified associative accounts, our observations are problematic for alternative accounts of causal learning in general and retrospective revaluation in particular. The alternative theoretical analyses offered by probabilistic contrast models (Cheng
and Novick, 1992; Cheng, 1997) assume that causal judgments conform to normative models of causal inference based upon the assessment of the probabilities of the outcome conditional upon the presence and absence of a cue. Although these theories are not process models, the implication is that causal judgments are based on memories of cue-outcome conjunctions and disjunctions that are then deployed through the probabilistic contrast rules at the time of judgment. Within such a model, learning trials that generate prediction error are not specially privileged, and therefore there is no reason to expect that they should be marked by a common neural signature. One other influential explanation of retrospective re-
Neuron 884
Figure 5. Relationship between Retrospective Revaluation Activations at Stage 2 and Subsequent Surprise-Dependent Activations at Stage 3 (A) Rendering of activations at stage 2 (all retrospective revaluation versus control) and surprise-dependent activations at stage 3 (postunovershadowing only). (B) (Left panel) Regions in which surprise-dependent activation (post-unovershadowing) at stage 3 is predicted by the level of unovershadowingrelated ventral striatal activation at stage 2 (shown in red) and unovershadowing-related right PFC activation (shown in green). Right panels show intersubject correlations between stage 2 ventral striatal activation and stage 3 right PFC activation (upper graph) and between stage 2 right PFC activation and stage 3 right PFC activation (lower graph).
valuation is called into question by the present findings. An account in terms of comparator theory (Denniston et al., 2001; Melchers et al., 2004) would propose that mere contiguity between a cue and outcome is sufficient for learning to proceed but that such learning is not expressed unless the cue has appreciably higher associative strength than its comparator stimulus (the learning context or another cue that was presented simultaneously with the cue in question). In the case of a blocking experiment, this means that the cue is blocked because its association with reinforcement is weaker than the association of its comparator stimulus (the other element of the compound) with reinforcement. The problem with this account is that it fails to explain the occurrence of the brain signature for prediction error observed in stage 3. At stage 3, all of the relevant cues (B1, B2, D1, D2; see Table 1) will have identical associative
Table 5. Relationships across Subjects between Unovershadowing-Related Activations at Stage 2 and Error-Dependent Activations at Stage 3 Region
x
y
z
Z Score
Magnitude of surprise-dependent activation (unovershadowing) predicted by accumbens activation at stage 2 Right middle frontal gyrus
30 40
24 16
23 43
3.5 3
Magnitude of surprise-dependent activation (unovershadowing) predicted by right PFC activation at stage 2 Right middle frontal gyrus
34 40
36 33
29 35
2.8 2.8
strengths, as they were all treated identically in stage 1. On the theory, despite these comparable associative strengths, they evoke different levels of responding (i.e., B ⬍ D), because B is compared with a strong comparator cue (A) while D is compared with a weak one (C). However, at stage 3 it is the cues’ associative strengths that determine the learning process, and, being identical, no differential surprise effect (B1⫹ and D2⫺ ⬎ B2⫺ and D1⫹) can therefore be predicted. It is intriguing that, in addition to the observations of revaluation-dependent changes in right PFC, a direct comparison of stage 2 retrospective revaluation trials with the respective control conditions showed, for both backward blocking and unovershadowing, ventral striatal activity. The majority of learning experiments producing activation in striatal regions have used explicitly rewarding outcomes (O’Doherty et al., 2003; McClure et al., 2003). While our stimuli were not explicitly rewarding, there is more recent evidence to suggest that, even in the absence of explicit reward, attentional salience is associated with nucleus accumbens activation (Zink et al., 2003; Aron et al., 2004). Our previous reports of prediction error-dependent activation have focused on right PFC, using conservative region of interest-based analyses. In the more recent study (Turner et al., 2004), we reported that, at a more lenient threshold, errordependent super-learning was associated with caudate and accumbens activation. There is thus accumulating evidence that more “cognitive” (i.e., less affective) associative learning may depend upon ventral striatal activity. As with right PFC, ventral striatal activity accompanying revaluation during stage 2 was a predictor of
fMRI and Associative Mechanisms of Causal Learning 885
violation-dependent right PFC at stage 3. Once again, this effect was seen for unovershadowing but not backward blocking, in keeping with the predictions made by the modified SOP model above. The finding that both the striatum and PFC are involved in the processing of prediction errors accords with the electrophysiological recordings from the primate substantia nigra and ventral tegmentum by Schultz and colleagues (Schultz, 1998; Schultz and Dickinson, 2000), which suggest that the activity of the dopamine cells encodes prediction errors. As the PFC and striatum are primary targets of the dopamine projections, the present findings reinforce the idea that error-driven learning is mediated by dopamine-modulated processing in the striatum and PFC. Although dopamine activity has not been reported under retrospective revaluation, Waelti et al. (2001) found that dopamine activity tracked the prediction errors generated by a forward version of the blocking and overshadowing contingencies used in the present study. Thus, since retrospective revaluation is accompanied by right lateral-frontal activation, we conclude that prediction error-related processes were active at revaluation. This finding strongly favors associative theories (such as Dickinson and Burke, 1996) over probability contrast theories (such as Macho and Burkhart, 2002), a distinction that has, so far, not been possible on the basis of existing behavioral data. While the majority of functional neuroimaging work to date has focused upon locating functions within the brain, we believe that an alternative approach, and one that could prove more useful, will lie in using brain markers for processes to compare and evaluate competing accounts of how these processes contribute to behavior. The current study exemplifies this approach. Experimental Procedures Subjects Fourteen healthy, right-handed volunteers (eight female, six male) with a mean age of 25 years (standard deviation [s.d.] ⫽ 5) and a mean predicted verbal IQ of 122 (s.d. ⫽ 5) (as indexed by the National Adult Reading Test) were recruited from within the local community by advertisement. Exclusion criteria included a history of psychiatric or physical illness (particularly cardiovascular or neurological disorders), head injury, and any history of drug or alcohol dependence, as well as contraindications for fMRI scanning. The study was approved by the Local Research and Ethics Committee and was carried out in accordance with the Code of Ethics of the World Medical Association (Declaration of Helsinki). Written informed consent was given by all subjects prior to imaging. One of the volunteers subsequently found the learning task too difficult and was therefore excluded from further analysis, leaving thirteen subjects. Learning Task A within-subjects design was used. Materials consisted of food pictures previously used in behavioral and imaging experiments (Aitken et al., 2001; Turner et al., 2004). Subjects were asked to imagine themselves working as an allergist (someone trying to determine the cause of allergic reactions in people). In this task, they were to be confronted with a new patient, “Mr. X,” who suffers allergic reactions following some meals but not others. Their task was to work out which foods caused Mr. X to have allergic reactions by observing the consequences of eating various foods. Trial Structure In keeping with our previous experiments (Fletcher et al., 2001; Turner et al., 2004), the study consisted of a series of trials, each of
which had the following general structure: (1) Stimulus presentation (3000 ms). A picture of a single food or pair of foods on a white background indicating the contents of Mr. X’s meal for that trial. (2) Subject’s predictive response. During the stimulus presentation, subjects predicted whether or not an allergy would occur by means of a two-choice button box. Participants were instructed to hold the button down for longer the more confident they were of their prediction. This provided an online measure of subjects’ expectations (and learning-based changes therein). (3) Outcome presentation (1000 ms). A graphic depicting the outcome of the meal was presented. A red jagged line, encircling the words “allergic reaction,” appeared to indicate that the patient suffered a reaction; if he did not, a smooth green box appeared around the words “no reaction.” Stimuli were presented using DMDX (K.I. Forster and J.C. Forster, University of Arizona), via a mirror comfortably situated in the subject’s field of view. Trials ran successively with occasional (one per ten trials) fixation baseline events (a black cross in the center of a white screen), lasting 4 s, randomly interspersed. Experimental Structure See Figure 1 and Table 1. Each subject was trained concurrently on a number of different contingencies between foods and allergic reactions. Learning occurred over three stages. The main structure of the experiment is represented in Figure 1, which gives example stimuli. Table 1 represents the overall design of the experiment, including control trials, symbolically. Trial Sequence Trials were presented in three stages, as shown in Table 1. During each stage, all trials were presented in a randomized sequence, with the constraint that the first presentation of each trial type occurred before the second presentation of any trial type, and so forth. Individual trial types are discussed in terms of the logical roles they played in the experiment. Stage 1: Training This was a preliminary stage designed to set up the initial expectancies. The key trial types in this were four pairs of foods in which subjects learned to expect a positive cue-outcome relationship (A1B1⫹, A2B2⫹, C1D1⫹, C2D2⫹). That is, subjects learned to expect that these food pairs would always predict an allergic response. Each of the four food pairs was presented 12 times. Control trials in stage 1 consisted of either single or compound foods (I⫹, J⫺, E1F1⫺, E2F2⫺). They served two purposes: first, they were introduced to ensure that subjects must attend to the features of each stimulus to predict the allergic outcome, as not all trials at any stage were associated with an allergic reaction. In addition, the prelearning of these control cues was the basis for the control conditions at the critical stages (stages 2 and 3) of the experiment. That is, control cues from stage 1 were continued through into stage 2, where they formed the basis for the subtractive analyses aimed at identifying the effects of retrospective revaluation. The nature of these cues, and their roles, is summarized in Table 1. Stage 2: Retrospective Revaluation During this stage, single foods, one from each of the compounds presented in stage 1, were presented with or without allergic outcomes, as shown in Figure 1 and Table 1. These trials were arranged to cause retrospective revaluation of the absent but expected cues from stage 1. Retrospective Revaluation Trials. In the backward blocking condition, one cue from a pair that had previously caused an allergy (for example, with reference to Figure 1, this might be bananas and chilies, and with reference to Table 1, A1B1⫹ and A2B2⫹) was itself paired with an allergy (chilies/A1⫹, A2⫹). This was designed to result in a downwards revaluation of the allergenic status of the other cue (bananas/B1, B2). In the unovershadowing condition, one cue from a pair that had previously been paired with an allergy (referring to Figure 1, hamburger and cheese; in Table 1, C1D1⫹, C2D2⫹) was presented without an allergy outcome (hamburger/C1⫺, C2⫺). The aim was to engender an augmented expectancy that the other cue from the pair (cheese/ D1, D2) would cause an allergy. Stage 2 control trials were single foods. Those foods that had been presented alone in stage 1 continued into stage 2 (I⫹, J⫺ in
Neuron 886
Table 1). They served as control trials for backward blocking and unovershadowing. F1⫺ and F2⫺ were included to control for the retrieval of within-compound associations, which are associative links between the foods in a compound pair that serve to retrieve a representation of the absent member of the pair when the other member is presented. Within-compound retrieval is a key process in the associative account of retrospective revaluation. By contrasting trials on which revaluation occurs with those on which within-compound associations are retrieved but there is no revaluation of causal status, neural responses to associative change for an absent cue were identified. Stage 3: Violation of Learned Expectancies There were four critical conditions in stage 3, involving the items from the revaluation conditions that had not been presented during stage 2. Half of these items were presented in association with an allergic reaction, and half were presented with no allergic reaction. Critically, on some trials the outcome should violate the expectation engendered by any retrospective revaluation that had occurred during stage 2. For other items, this would fulfill the prediction engendered by revaluation. This is outlined in Figure 1: if revaluation occurs during stage 2, then presentation of the outcome during stage 3 should be more surprising following the backward blocking cue, banana, than following the cue from the unovershadowing condition, cheese. Similarly the occurrence of no reaction following cheese, should be more surprising than no reaction following banana. Thus, stage 3 enabled us to determine the brain activity during two trials in which prediction error should be larger (backward blocked items in which an allergic reaction occurred and unovershadowed items in which an allergic response did not occur; referring to Table 1, B1⫹ and D2⫺) in comparison to perfectly matched stimuli from stage 1 in which prediction error should be smaller (unovershadowed items in which an allergic reaction occurred and backward blocked items in which an allergic reaction did not occur; B2⫺ and D1⫹). Behavioral Measures When subjects made each prediction, they were instructed to hold the button down longer the more confident they felt in this prediction. This provides a more sensitive representation of how learning progresses during scanning. We used the combination of the predictive response (positive versus negative) and confidence to obtain a measure of the strength of the subjects’ belief that a cue caused, or did not cause, the allergic reaction. This was obtained by the following equation: Predictive strength ⫽ R ⫻
(length of button push) 3000
where R is the predictive response (coded by ⫹1 for prediction of an allergy and ⫺1 for prediction of no allergy). Thus, a subject who confidently predicted allergy or no allergy on a series of trials would have a high positive score or high negative score, respectively. A subject who predicted inconsistently, or with low confidence, would have a score close to zero. fMRI Data Acquisition A Bruker MedSpec 30/100 (Ettlingen, Germany) operating at 3 T was used to collect imaging data. Gradient-echo echo-planar T2*weighted images depicting BOLD contrast were acquired from 21 noncontiguous slices in a near axial plane: TR ⫽ 1.1 s; TE ⫽ 27.5 ms; flip angle ⫽ 66; in-plane resolution ⫽ 3.1 ⫻ 3.1 mm; matrix size 64 ⫻ 64; field of view 20 ⫻ 20 cm; bandwidth 100 kHz. A total of 705 volumes per subject were acquired in stage 1 (data not further reported), and 893 were acquired across stages 2 and 3 (21 slices each of 4 mm thickness; interslice gap 1 mm). The first 6 volumes were discarded to allow for T1 equilibration effects, leaving 887 volumes. fMRI Data Analysis fMRI data were analyzed using statistical parametric mapping in the SPM2 program (Wellcome Department of Cognitive Neurology, London, UK). Images were realigned, spatially normalized to a standard template, and spatially smoothed with a Gaussian kernel (8 mm). The time series in each session were high-pass filtered (to a
maximum of 1/120 Hz), and serial autocorrelations were estimated using an AR(1) model. The average hemodynamic response to each event type was designated as occurring at the presentation of the outcome stimulus (i.e., when subjects were informed whether or not an allergic reaction had occurred for that trial) and modeled using a canonical, synthetic hemodynamic response function (Friston et al., 1998). This function was used as a covariate in a general linear model, and a parameter estimate was generated for each voxel for each event type. The parameter estimate, derived from the mean least-squares fit of the model to the data, reflects the strength of covariance between the data and the canonical response function for a given condition. Individuals’ contrast images, derived from the pairwise comparisons between these events and baseline fixation tasks, were then entered into a second level group analysis using an ANOVA model with nonsphericity correction. For the stage 2 effects, this ANOVA modeled the two retrospective revaluation conditions (unovershadowing and backward blocking) and the two control tasks. For stage 3, the two surprising conditions (surprising outcome and surprising nonoutcome) together with the two unsurprising conditions were included in the ANOVA. Within these models, pairwise comparisons, as detailed below, were carried out in which t values were calculated for each voxel treating intersubject variability as a random effect. The t values were transformed to unit normal Z distribution to create a statistical parametric map for each of the planned contrasts. Thresholding Strategy In order to maximize sensitivity in this analysis while minimizing the risk of type I error, we confined the critical analyses to a number of regions of interest. For the analyses of stage 2 activation (i.e., at the time of the putative retrospective revaluation), our mask consisted of lateral PFC (middle and inferior frontal gyri), anterior cingulate cortex, and striatal structures. These regions were selected on the basis of previous studies exploring prediction error-dependent learning (Fletcher et al., 2001; Turner et al., 2004; O’Doherty et al., 2003; McClure et al., 2003). While our two previous studies (Fletcher et al., 2001; Turner et al., 2004) most strongly implicated right lateral PFC, activation was also observed in left PFC and anterior cingulate, and these regions were therefore included in the mask. In addition, ventral striatal activation was observed at a reduced threshold in the latter study, and this, together with the clear implication of ventral striatum in the work of O’Doherty et al. and McClure et al., led us to include ventral striatum among the regions of interest. Finally, we included substantia nigra in the mask in view of the projections from this region to ventral striatum and frontal cortex and the implications of these projections in prediction error (Schultz, 1998). The mask was generated with the PickAtlas tool implemented in SPM2 (Maldjian et al., 2003), and its extent is shown in Figure 3. A false discovery rate (FDR) (Benjamini and Hochberg, 1995; Genovese et al., 2002) threshold of p ⬍ 0.05 was set. For the stage 3 contrasts, we were interested solely in a prediction error contingent upon violation of revaluation-engendered expectations. Our contrasts were confined to the region of right PFC that we have previously implicated in prediction error processing (Fletcher et al., 2001; Turner et al., 2004). We obtained the median coordinates (40, 25, 27) from the set of maxima identified by the contrasts in our two previous studies (Fletcher et al., 2001; Turner et al., 2004) and defined a sphere (radius 12 mm) around this location. Planned contrasts were thresholded at p ⬍ 0.01 (uncorrected). This highly restrictive analysis reflected the fact that we wished to use stage 3 activations as an index of retrospective revaluation at stage 2, and therefore this analysis was based solely upon the specific link between prediction error and right PFC identified by our previous work. However, in the interests of completeness, we also carried out unmasked analyses at stage 3 using FDR protection. (No activations survived this threshold, and therefore discussions of stage 3 effects are restricted to right PFC.) Planned Comparisons Brain Activations Accompanying Retrospective Revaluation at Stage 2 Combined Retrospective Revaluation versus Controls. We determined brain regions showing an increased response to the com-
fMRI and Associative Mechanisms of Causal Learning 887
bined unovershadowing and backward blocking condition. With reference to Table 1, these are A1⫹, A2⫹, C1⫺, C2⫺ versus I⫹, F1⫺, F2⫺. Direct Comparison between Unovershadowing and Backward Blocking. Comparing backward blocking trials (with the relevant control trials subtracted), i.e., [A1⫹, A2⫹ versus I⫹], with unovershadowing trials (minus their controls), i.e., [C1⫺, C2⫺ versus F1⫺, F2⫺] identifies regions in which brain responses are greater to backward blocking. The reverse shows regions that are differentially sensitive to unovershadowing. Combined Retrospective Revaluation versus Retrieval of WithinCompound Associations. Trials that were theoretically accompanied by retrospective revaluation (A1⫹, A2⫹, C1⫺, C2⫺) were compared with trials upon which there was an equivalent retrieval of withincompound associations (F1⫺, F2⫺) without the revaluation of the causal status of the absent cues. This contrast should identify the neural correlates of causal revaluation of absent cues proper. Right PFC Activation at Stage 3 Occurring as a Consequence of Retrospective Revaluation during Stage 2 Main Effect of “Surprise.” The retrospective revaluation process in stage 2 should have engendered a modified expectancy of the causal strength of items that had been presented in stage 1 but absent in stage 2. Re-presenting these stimuli singly in stage 3 enabled us to determine brain responses to violations of this modified expectancy. Critically, for each of the “surprise” trials, there was a perfectly matched control condition. Thus, following stage 2, unovershadowed items should be accompanied by the expectation of an allergic reaction. In the case of D2⫺ (see Table 1), no reaction occurred, and this expectation was violated. This event was compared directly with a less surprising nonoccurrence of allergic reaction arising when an item had been subject to backward blocking (B2⫺). Likewise, following backward blocking, the relatively surprising event should be when a backward blocked item is accompanied by an allergic reaction (as was the case with B1⫹). This could be compared with the presence of an allergic reaction accompanying presentation of an unovershadowed item (D1⫹). (Note that the experimental design provides control trials that are matched in terms of familiarity and cue-outcome configuration for each of the surprise trials.) Direct Comparisons of the Effects of Expectancy Violation following Unovershadowing and Backward Blocking. This comparison reflects the interaction between the subsequent effects of the two retrospective revaluation conditions. That is, the question posed was whether expectancy violation of an unovershadowed stimulus (D2⫺ versus D1⫹) produced different levels of activation than expectancy violation of a backward blocked item (B1⫹ versus B2⫺). Investigating the Relationship between Neural Responses at Retrospective Revaluation and Those at the Subsequent Violation Stage Key regions showing activation responses during the retrospective revaluation stage should, if they reflect revaluation processes, predict the magnitude of prediction error when revaluation-engendered activations are violated at stage 3. We therefore evaluated correlations (across subjects) between revaluation activations at stage 2 and surprise-dependent activation in the right PFC region of interest at stage 3. In performing this analysis, one subject was formally identified as an outlier using a criterion of a value lying above two standard deviations from the group mean. This subject was removed from further analysis. The regression analysis was run using the remaining 12 subjects.
Acknowledgments This work was supported by the Wellcome Trust. We are grateful to members of the Wolfson Brain Imaging Center (Cambridge). The work was completed within the MRC Centre for Behavioral and Clinical Neuroscience (Cambridge).
Received: August 11, 2004 Revised: September 24, 2004 Accepted: November 9, 2004 Published: December 1, 2004
References Aitken, M.R., and Dickinson, A. (2004). Simulations of a modified SOP model applied to retrospective revaluation of human causal learning. Learn. Behav., in press. Aitken, M.R., Larkin, M.J., and Dickinson, A. (2001). Re-examination of the role of within-compound associations in the retrospective revaluation of causal judgements. Q. J. Exp. Psychol. B 54, 27–51. Allan, L.G. (1993). Human contingency judgments: Rule-based or associative? Psychol. Bull. 114, 435–448. Aron, A.R., Shohamy, D., Clark, J., Myers, C., Gluck, M.A., and Poldrack, R.A. (2004). Human midbrain sensitivity to cognitive feedback and uncertainty during classification learning. J. Neurophysiol. 92, 1144–1152. Benjamini, Y., and Hochberg, Y. (1995). Controlling the false discovery rate: a practical and powerful approach to multiple testing. J. Royal Statistical Soc. B 85, 289–300. Cheng, P.W. (1997). From covariation to causation: A causal power theory. Psychol. Rev. 104, 367–405. Cheng, P.W., and Novick, L.R. (1992). Covariation in natural causal induction. Psychol. Rev. 99, 83–120. De Houwer, J., and Beckers, T. (2002). A review of recent developments in research and theories on human contingency learning. Q. J. Exp. Psychol. 55B, 289–310. Denniston, J.C., Savastano, H.I., and Miller, R.R. (2001). The extended comparator hypothesis: learning by contiguity, responding by relative strength. In Handbook of Contemporary Learning Theories, R.R. Mowrer and S.B. Klein, eds. (Mahwah, NJ: Erlbaum), pp. 65–117. Dickinson, A. (2001). Causal learning: An associative analysis. Q. J. Exp. Psychol. 54B, 3–25. Dickinson, A., and Burke, J. (1996). Within-compound associations mediate the retrospective revaluation of causality judgements. Q. J. Exp. Psychol. 37B, 397–416. Duncan, J., and Owen, A.M. (2000). Common regions of the human frontal lobe recruited by diverse cognitive demands. Trends Neurosci. 23, 475–483. Fletcher, P.C., and Henson, R.N. (2001). Frontal lobes and human memory: insights from functional neuroimaging. Brain 124, 849–881. Fletcher, P.C., Anderson, J.M., Shanks, D.R., Honey, R., Carpenter, T.A., Papadakis, N., and Bullmore, E.T. (2001). Responses of human frontal cortex to surprising events are predicted by formal associative learning theory. Nat. Neurosci. 4, 1043–1048. Friston, K.J., Fletcher, P., Josephs, O., Holmes, A., Rugg, M.D., and Turner, R. (1998). Event-related fMRI: characterizing differential responses. Neuroimage 7, 30–40. Genovese, C.R., Lazar, N.A., and Nichols, T. (2002). Thresholding of statistical maps in functional neuroimaging using the false discovery rate. Neuroimage 15, 870–878. Larkin, M.J., Aitken, M.R.F., and Dickinson, A. (1998). Retrospective revaluation of causal judgments under positive and negative contingencies. J. Exp. Psychol. Learning Mem. Cognit. 24, 1331–1352. Macho, S., and Burkhart, J. (2002). Recursive retrospective revaluation of causal judgments. J. Exp. Psychol. Learn. Mem. Cogn. 28, 1171–1186. Maldjian, J.A., Laurienti, P.J., Kraft, R.A., and Burdette, J.H. (2003). An automated method for neuroanatomic and cytoarchitectonic atlas-based interrogation of fMRI data sets. Neuroimage 19, 1233– 1239. McClure, S.M., Berns, G.S., and Montague, P.R. (2003). Temporal prediction errors in a passive learning task activate human striatum. Neuron 38, 339–346. Melchers, K.G., Lachnit, H., and Shanks, D.R. (2004). Within compound associations in retrospective revaluation and in direct learning: A challenge for comparator theory. Q. J. Exp. Psychol. 57B, 25–53. O’Doherty, J.P., Dayan, P., Friston, K., Critchley, H., and Dolan, R.J. (2003). Temporal difference models and reward-related learning in the human brain. Neuron 38, 329–337.
Neuron 888
Price, P.C., and Yates, J.F. (1995). Associative and rule-based accounts of cue interaction in contingency judgment. J. Exp. Psychol. Learn. Mem. Cogn. 21, 1639–1655. Rescorla, R.A., and Wagner, A.R. (1972). A theory of Pavlovian conditioning: variations in the effectiveness of reinforcement and nonreinforcement. In Classical Conditioning II: Current Research and Theory, A.H. Black and W.F. Prokasy, eds. (New York: AppletonCentury-Crofts), pp. 64–99. Schultz, W. (1998). Predictive reward signal of dopamine neurons. J. Neurophysiol. 80, 1–27. Schultz, W., and Dickinson, A. (2000). Neural coding of prediction errors. Annu. Rev. Neurosci. 23, 473–500. Shanks, D.R. (1985). Forward and backward blocking in human contingency judgement. Q. J. Exp. Psychol. 37B, 1–21. Talairach, J., and Tournoux, P. (1988). Co-Planar Stereotaxic Atlas of the Human Brain (New York: Thieme Medical Publishers). Turner, D.C., Aitken, M.R.F., Shanks, D.R., Sahakian, B.J., Robbins, T.W., Schwarzbauer, C., and Fletcher, P.C. (2004). The role of lateral frontal cortex in causal associative learning: exploring preventative and super-learning. Cereb. Cortex 18, 872–880. Van Hamme, L.J., and Wasserman, E.A. (1994). Cue competition in causality judgments: The role of nonpresentation of compound stimulus elements. Learn. Motiv. 25, 127–151. Waelti, P., Dickinson, A., and Schultz, W. (2001). Dopamine responses comply with basic assumptions of formal learning theory. Nature 412, 43–48. Zink, C.F., Pagnoni, G., Martin, M.E., Dhamala, M., and Berns, G.S. (2003). Human striatal response to salient nonrewarding stimuli. J. Neurosci. 23, 8092–8097.