The Economic Journal, 118 (June), F174–F184. Ó The Author(s). Journal compilation Ó Royal Economic Society 2008. Published by Blackwell Publishing, 9600 Garsington Road, Oxford OX4 2DQ, UK and 350 Main Street, Malden, MA 02148, USA.
PREDICTING THE QUALITY AND PRICES OF BORDEAUX WINE* Orley Ashenfelter Bordeaux wines have been made in much the same way for centuries. This article shows that the variability in the quality and prices of Bordeaux vintages is predicted by the weather that created the grapes. The price equation provides a measure of the real rate of return to holding wines (about 2–3% per annum) and implies far greater variability in the early or Ôen primeurÕ wine prices than is observed. The analysis provides a useful basis for assessing market inefficiency, the effect of climate change on the wine industry and the role of expert opinion in determining wine prices.
Red wines have been produced in the Bordeaux region of France in much the same way, for hundreds of years. Yet, there are differences in quality and price from year to year that can sometimes be quite large. Until very recently, these quality differences have been considered a great mystery. In this article I show that the factors that affect fluctuations in wine vintage quality can be explained in a simple quantitative way. In short, I show that a simple statistical analysis predicts the quality of a vintage, and hence its price, from the weather during its growing season. Along the way, I show how the aging of wine affects its price, and under what circumstances it pays to buy wines before they are at their best for drinking. Since this procedure for predicting wine quality has now been in use for over a decade, I also provide an appraisal of its successes (and failures) and a discussion of the role this information has played in the evolution of the wine trade. When a red Bordeaux wine is young it is astringent and most people will find it unpleasant to drink. As a wine ages it loses its astringency. Because Bordeaux wines taste better when they are older, there is an obvious incentive to store them until they have come of age. As a result, there is an active market for both younger and older wines. Traditionally, what has not been so obvious is exactly how good a wine will be when it matures. This ambiguity leaves room for speculation and, as a result, the price of the wine when it is first offered in its youth will often not match the price of the wine when it matures. The primary goal in this article is to study how the price of mature wines may be predicted from data available when the grapes are picked, and then to explore the effect that this has on the initial and final prices of the wines. A secondary goal is to show how this straightforward hedonic method has now been used in many other grape growing regions to quantify the role the weather plays in determining the quality of wine vintages. The study of how wine vintages are priced provides a fascinating window on the operation of a market that has high visibility in many countries. In more recent years, as concerns and evidence regarding global warming have mounted, the role of the weather in determining wine quality and prices has taken on greater urgency. Climate change will no doubt affect wine production with, as Jones et al. (2005) show, winners * The author thanks the Editor of this Journal and an anonymous referee for helpful comments. All interpretations and any errors are the author’s sole responsibility. [ F174 ]
[ J U N E 2008 ]
F175
PREDICTING THE QUALITY
and losers. The evidence on wine prices and weather provides one avenue for calibrating who the winners and losers are likely to be and how much they may win or lose.
1. Vineyards and Vintages The best wines of Bordeaux are made from grapes (typically cabernet sauvignon and merlot) grown on specific vineyard properties and the wine is named after the property, or chateau, that controls where the grapes are grown. In fact, knowledge of the chateau (essentially the vineyard) and vintage provides most of the information needed to know the quality of the wine. That is, if there are ten vintages and six chateaux, there are, in principle, 60 different wines of different quality. It might seem a daunting task to determine the quality of each wine. However, knowing the reputations of the six chateaux and the ten vintages gives sufficient data to determine the quality of all 60. In other words, good vintages produce good wines in all vineyards and the best wines are produced in the best vineyards in all vintages. Although this point is sometimes denied by those who produce the wines, and especially by the sellers of young wines, it is easy to establish its truth by reference to the prices of the mature wines. To demonstrate the point, Table 1 indicates the market price in the early 1990s in London of six Bordeaux chateaux from the ten vintages from 1960 to 1969. These chateaux were selected because they are large producers and their wines are sold very frequently. A blank in the Table indicates that the wine had not appeared in the market in some time. (Lower quality vintages are typically the first to leave the market.) The vintages from 1960 to 1969 are selected because by now these wines are fully mature and there is no remaining uncertainty about their quality. From Table 1, one can see that knowledge of the average price of the vintage (shown in the last column) and knowledge of the average chateau price (shown in the last row) tells much about the price of each wine. For example, by examining the last column of Table 1 it is clear that 1961 was the best year in this decade and that it was followed by Table 1 London Auction Prices for Mature Red Bordeaux Wines Chateaux (Vineyards) Vintage
Lafite
Latour
1960 1961* 1962* 1963 1964* 1965 1966* 1967* 1968 1969 Average
494 4,335 889 340 649 190 1,274 374 223 251 1,504
464 5,432 1,064 471 1,114 424 1,537 530 365 319 1,935
Cheval Blanc 486 3,534 821 1,125 1,260 441 274 1,436
Cos d’Estournel
Montrose
Pichon Lalande
1,170 521 251 315
1,125 456
1,579 281
350
546 213
482 236
410 258 734 243
123 553
84 530
152 649
Notes. Prices are for wines auctioned in 1990 to 1991, and are shown in $US per dozen bottles. Ó The Author(s). Journal compilation Ó Royal Economic Society 2008
Average 479 4,884 977 406 882 307 1,406 452 294 285
F176
THE ECONOMIC JOURNAL
[JUNE
1966, and then 1962 and 1964 in quality (and price). There would be no dispute about this ranking from wine lovers anywhere in the world. Likewise, in the bottom row the average prices by chateau indicate that Latour is the most outstanding chateau in the group. Finding the 1961 Latour entry in the Table, reveals that indeed, this is the best wine of the decade in this group. In fact, a more advanced statistical analysis reveals that information on chateau and vintage alone explain over 90% of the variation in the prices. In short, there is not much room for other factors to play a very big role in price determination. A ranking of the chateaux in order of quality based on their prices would be Latour, Lafite, Cheval Blanc, Pichon-Lalande, Cos d’Estournel, Montrose. In fact, as Edmund Penning-Rowsell (1985) points out in his classic book The Wines of Bordeaux, the famous 1855 classification of the chateaux of Bordeaux into quality grades was based on a similar assessment by price alone. Surprisingly, the 1855 classification ranks these chateaux in only a slightly different order: Lafite, Latour, Pichon-Lalande, Cos d’Estournel, and Montrose.1 Likewise, a ranking of the quality of the vintages based on price alone would be 1961, 1966, 1962, 1964, and 1967. The remaining vintages (1960, 1963, 1965, 1968, and 1969) would be ranked inferior to these five, and perhaps because of this fact, many of the wines from these inferior vintages are no longer sold in the secondary market. As is apparent from Table 1, there are two natural dimensions on which to search for hedonic determinants of wine quality: the vintage and the vineyard. In climatological terms it is natural to associate the first with ÔweatherÕ variability from year to year and the second with ÔclimateÕ variability across vineyards. In what follows I focus on the weather and thus on the factors that determine the nature and quality of the wines from particular vintages in Bordeaux. However, there is now considerable research on the climate factors that are the determinants of vineyard quality. Some of the earliest work dates back to the pioneering viticulturalists Amerine and Winkler (1944), who mapped the nascent grape growing regions of California. Gladstones (1992) provided a more nuanced analysis for key Australian vineyards. Econometric analyses using data from vineyards in France (Combris et al., 1997; Jones and Storchmann, 2001), California (Haeger and Storchmann, 2006) and Germany (Ashenfelter and Storchmann, 2006) all show that heat retention and drainage (to remove excess water when it exists) are key determinants of vineyardsÕ prices and wine quality. Typically, the cooler sites in hot regions and the warmer sites in cool regions are the best but the ideal conditions vary according to the type of grape.
2. Returns to Holding Bordeaux Wine It is natural to wonder why wines from the same chateau, made by the same winemaker, and made in the same manner could have such varying prices as indicated by Table 1. Apparently, there must be some difference generated by the different vintages in which the wines were made. There are two natural explanations. First, the older wines have been held longer and this requires a payoff to the investment that has been made in foregoing the consumption of the wines. 1
Cheval Blanc was not ranked in 1855.
Ó The Author(s). Journal compilation Ó Royal Economic Society 2008
2008 ]
F177
PREDICTING THE QUALITY
ln of price
4.6
2.3 1950
1955
1960 1965 1970 Year of Vintage
1975
1980
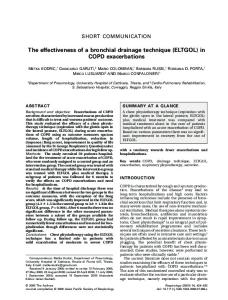
Fig. 1. Red Bordeaux Wine Prices, Relative to 1961 Vintage
To test this hypothesis I have constructed an index of the price of a portfolio of wines from each vintage displayed in Figure 1.2 Figure 1 provides a graphical representation of the results. Since these points represent the average across many chaˆteaux in a given year, the price differences represent differences that are due only to the vintage in which the wines were produced. Figure 1 is a scatter diagram of the price of the wines of a vintage against the vintage year. Examining either the data points or the Ôbest-fit-lineÕ, it is apparent that there is a negative relationship between the two variables. The slope of the best-fit-line line is 0.035 and, as I have learned from further experimentation, as long as the sample includes at least 20 vintages, a slope of around 0.03 is invariably obtained. This means that the older a wine, the greater is its value. However, as can be seen in Figure 1, this also clearly leaves much variation in average prices across vintages that is unexplained.
3. Vintages and the Weather It is well known that the quality of any fruit, in general, depends on the weather during the growing season that produced the fruit. What is not so widely understood is that in some localities the weather will vary dramatically from one year to the next. In California, for example, it never rains in the summer and it is always warm in the summer. There is a simple reason for this. In California a high-pressure weather system settles each summer over the California coast and produces a warm, dry growing season for the grapes planted there. In Bordeaux this sometimes happens – but sometimes it does not. Australia is an intermediate case, where summers are usually dry, though not always. Summers in Bordeaux can be hot and dry, hot and wet, cool and dry, and, most unpleasant of all, cool and wet. In general, high quality vintages for Bordeaux wines 2 In the remainder of the article I use an index based on the wines of several chateaux as a measure of the price. See Ashenfelter, et al. (1995). The chateaux are deliberately selected to represent the most expensive wines (Lafite, Latour, Margaux, Cheval Blanc) as well as a selection of wines that are less expensive (Ducru Beaucaillou, Leoville Las Cases, Palmer, Pichon Lalande, Beychevelle, Cos d’Estournel, Giscours, GruaudLarose, and Lynch-Bages). A different selection of chateaux for the portfolio would have very little effect on the results.
Ó The Author(s). Journal compilation Ó Royal Economic Society 2008
F178
[JUNE
THE ECONOMIC JOURNAL
0 78 77 14.5
56 63
72
61
62 80 57 67 79
54 74
53 66 70 71
64 73
18.5
55 58
75
52
69
59
Summer Temperature
76
65 68 60 350
Harvest Rain
Above Average Price Below Average Price
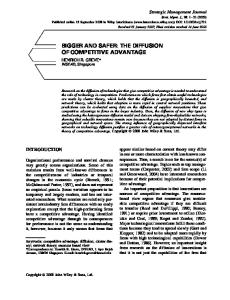
Fig. 2. Bordeaux Summer Temperature and Harvest Rain, 1952–1980
correspond to the years in which August and September are dry, the growing season is warm, and the previous winter has been wet. Except in places where irrigation is common to make up for low winter rainfalls, this finding will not surprise winemakers anywhere in the world. Figure 2 establishes that it is hot, dry summers that produce the vintages in which the mature wines obtain the higher prices. This Figure displays for each vintage the summer temperature from low to high as you move from left to right, and the harvest rain from low to high as you move from top to bottom. Vintages that sell for an above average price are displayed with dark points, and vintages that sell for a below average price are displayed with light points. If the weather is the key determinant of wine quality, then the dark points should be in the northeast quadrant of the diagram and the light points should be in the southwest quadrant of the diagram, and the other two quadrants should have a mixture of dark and light points. It is apparent that this is precisely the case. Even anomalies, like the 1973 vintage, tend to corroborate the fact that the weather determines the quality of the wines, because although the wines of this vintage, which are of somewhat above average quality, have always sold at relatively low prices, insiders know that they are often bargains (and indeed I have bought and consumed a lot of them!) Ideally, the weather’s effect on wine quality and price could be tested with a controlled laboratory experiment. However this is obviously not feasible as there is no way to control the weather in France (yet!). This inability to create a controlled experiment leads to the use of so called Ônatural experimentsÕ. A natural experiment is a set of circumstances that occurs naturally (or at least is external to our control) and exhibits sufficient variation to identify the causal effects of interest. The case of weather in Bordeaux presents a very nice natural experiment. The weather differs sufficiently from year to year and the quality of the grapes is recorded sufficiently (through wine prices) to measure weather’s true effects on quality. Ó The Author(s). Journal compilation Ó Royal Economic Society 2008
2008 ]
F179
PREDICTING THE QUALITY
Table 2 Regressions of Log Wine Price on Climate Variables Independent variables Age of vintage Average temperature over growing season (April–September) Rain in August Rain in the months preceding the vintage (October–March) Average temperature in September R-squared Root mean squared error
(1) 0.0354 –
(0.0137)
(2)
(3)
0.0238 0.6160
(0.0072) (0.0952)
0.2400 0.6080
(0.0075) (0.1160)
– –
0.00386 0.00117
(0.00081) (0.00048)
0.00380 0.00115
(0.00095) (0.00051)
– 0.212 0.575
– 0.828 0.287
0.0077 0.828 0.293
(0.0565)
Notes. All regressions are of the (logarithm of) the price of different vintages of a portfolio of Bordeaux chateau wines on climate variables, using as data the vintages of 1952–80, excluding the 1954 and 1956 vintages, which are now rarely sold; all regressions contain an intercept, which is not reported. Standard errors are in parentheses.
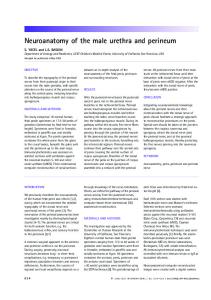
The result of a regression of the prices of the wines on the weather variables is reported in Table 2.3 Although the weather data are taken from a single station in Merignac, a part of the Bordeaux region, Lecocq and Visser (2006) have shown that the weather variability across components of the small Bordeaux region are so similar that more detailed data add little to the analysis. The results indicate that in a model that includes four variables, the age of the vintage, the average temperature over the growing season (April–September), the amount of rain in September and August, and the amount of rain in the months preceding the vintage (October–March), about 80% of the variation in the average price of Bordeaux wine vintages is explained. Analysis of the effects of age alone produces a model that explains only slightly more than 20%, suggesting that the weather is an extremely important determinant of the quality of a wine vintage and its price at maturation. With this model, it is possible to predict the relative price at which the new vintage should be sold as soon as the growing season is complete. The basic idea for these predictions is displayed in Figure 3. This Figure adds to Figure 2 the data for the vintages from 1981–2003 but keeps the axes in the same place, based on the historical normal rainfall and temperature data. Two things are immediately apparent from Figure 3. First, all but one of these recent vintages (1986) was produced by a growing season that was warmer than what is historically ÔnormalÕ. Indeed a test of whether the mean temperature in the later period is different from the mean temperature in the earlier period strongly rejects equality in favour of warmer temperatures in the later period. On the other hand, the average rainfall during the harvest in later period shows no difference from ÔnormalÕ. Indeed, the prevalence of such warm weather in the summer in the last two decades no doubt accounts, in part, for the deeply held conviction that many Europeans hold that global warming is already upon us. This unusual run of extraordinary weather has resulted in a huge quantity of excellent red Bordeaux wines. Although it is rarely remarked upon by anyone but economists, global warming creates both winners and losers. 3 All analyses use as data the vintages of 1952–1980, excluding the 1954 and 1956 vintages, which are now rarely sold.
Ó The Author(s). Journal compilation Ó Royal Economic Society 2008
F180
[JUNE
THE ECONOMIC JOURNAL
Harvest Rain 85
0 78
62 80
77 14.5
56 63
72 54
57 67 79
75 58
52
03
00
66 53 70 64 81 84 71 73 87 55 83
86 74
61 88
90 89
01 02
82 59
95
91
98
97 19.5 18.5 Summer Temperature
94 69 65 68 60
76
96
99
93
92
350
1981–2003 Fig. 3. Rainfall and Temperature in Bordeaux: 1952–2003
Second, the weather that created the vintages of 1989, 1990, 2000 and 2003 appears to be quite exceptional by any standard. Indeed, the question must be asked, is it appropriate to predict that the wines of these vintages will be of outstanding quality when the temperature that produced them is so far outside the normal range? Before making the predictions for 1989 or 1990 I asked the late Lincoln Moses, a distinguished Stanford statistician, for advice. Moses suggested two informal tests. (a) Would the last major Ôout of sampleÕ prediction have been correct? The idea here is to use the past to indirectly test the ability of the relationship to stretch beyond the available data. In fact, the last major Ôout of sampleÕ prediction for which all uncertainty had been resolved was the vintage of 1961, which had the lowest August–September rainfall in Bordeaux history. Just as the unusual weather predicted, the market (see Table 1), and most wine lovers, have come to consider this an outstanding vintage. (b) Was the warmth of the 1989 and 1990 growing seasons in Bordeaux greater than the normal warmth in other places where similar grapes are grown? The idea here is to determine whether the temperature in Bordeaux is abnormal by comparison with grape growing regions that may be even warmer. In fact, the temperature in 1989 or 1990 in Bordeaux was no higher than the average temperature in the Barossa Valley of South Australia or the Napa Valley in California, places where high quality red wines are made from similar grape types. Based on these two informal tests, I decided in 1991 to predict that both the 1989 and 1990 vintages in Bordeaux were likely to be outstanding. Ironically, many professional wine writers did not concur with this prediction at the time. In the years that have Ó The Author(s). Journal compilation Ó Royal Economic Society 2008
2008 ]
PREDICTING THE QUALITY
F181
followed minds have been changed; and there is now virtually unanimous agreement that 1989 and 1990 are two of the outstanding vintages of the last 50 years. Among current vintages, Figure 3 indicates that the 2000 and 2003 vintages are in a league similar to the outstanding vintages of 1989 and 1990. And what does the wine press say about these vintages? It is not hard to find out, as these wines have been advertised for sale over the last several years using the fantastic praise heaped upon them. For example, Robert Parker widely considered the most influential taster says, Ô2000 is the greatest vintage Bordeaux has ever produced. Remarkably consistent from top to bottom, there has never been a year where so many exceptional wines were produced.Õ He is no less ecstatic about the 2003 vintage. And yet we learned this without tasting a single drop of wine. In recent years the hedonic approach to analysing wine vintages has been applied in several other areas, including Australia (Ashenfelter and Byron, 1995; Wood and Anderson, 2006) and Italy (Corsi and Ashenfelter, 2001). Fair (2002) even reports a series of independent tests of the ex post forecasting ability of the weather model for Bordeaux, concluding that it provides accurate predictions so long as the purpose is to drink (as opposed to collect) the wines. One of the most interesting issues raised by the study of these hedonic models of vintage quality is the role it implies for expert opinion in the determination of wine prices. Ian Ayes recent book, Super Crunchers (2007), is an exploration of this topic using examples from several fields of economics including the study of wine pricing. Related papers include those by Ashenfelter and Jones (2000) and Ali et al. (2008). Although it is difficult to summarise the conclusions of this ongoing area of research, there is evidence that ÔexpertÕ opinion that is unrelated (that is, orthogonal) to the fundamental determinants of wine quality plays a role in determining wine prices, at least in the short run. This naturally raises the unresolved question of just what determines the ÔdemandÕ for expert opinion.
4. Market Inefficiency Given that the weather plays such a large role in determining the quality and prices of the mature wines of a vintage, does the market take account of this information when the young wines are priced? In short, were the relative prices of the vintages when they were first sold at market good forecasts of the relative prices of the wines when they matured, and if so, were these forecasts as good as the predictions made using the data on weather alone? Table 3 reveals the answer to both of these questions. The entries for each of the vintages in the Table are index prices of the wines in the market in each calendar year from 1971 to 1989. The index method used here is to simply put the price of the wine relative to the Ôbenchmark portfolioÕ listed in column 1 of the Table.4 For example, in Table 3 an entry of 1.0 would represent a vintage with equal value to the benchmark portfolio in a given year and an entry of 0.5 would be a vintage with half the value of the benchmark portfolio. In the bottom row of the Table is listed the predicted relative 4 The benchmark portfolio is the average price of the wines from the 1961, 1962, 1964 and 1966 vintages. This is done for statistical ease, and these vintages were chosen for their superior quality.
Ó The Author(s). Journal compilation Ó Royal Economic Society 2008
F182
[JUNE
THE ECONOMIC JOURNAL
Table 3 Relative Prices per Case of Wines from a Portfolio of Bordeaux Chateaux Vintage Year of Sale
Benchmark Portfolio* 1961 1962 1963 1964 1965 1966 1967 1968 1969 1970 1971
1971 £54 1972 £97 1973 £119 1974 £85 1975 £76 1976 £109 1977 £165 1978 £215 1979 £274 1981 £296 1982 £420 1983 £586 1985 £952 1986 £888 1987 £901 1988 £854 1989 £1,048 Predicted Price**
1.68 1.58 1.62 1.31 1.65 1.67 1.67 1.67 1.61 1.75 1.80 1.77 2.19 2.10 2.11 2.01 2.09 1.74
0.79 0.76 0.71 0.77 0.77 0.83 0.83 0.76 0.73 0.62 0.71 0.53 0.53 0.56 0.56 0.56 0.61 0.72
0.41 0.26 0.28 0.39 0.29 0.30 0.26 0.26 0.20 0.22 0.15 0.10 0.12 0.25 0.21 0.28 0.29
0.76 0.70 0.74 0.84 0.78 0.66 0.63 0.65 0.66 0.70 0.60 0.59 0.50 0.54 0.53 0.61 0.53 0.76
0.27 0.24 0.35 0.29 0.26 0.18 0.23 0.04 0.18 0.18 0.21 0.17 0.14 0.19 0.16
0.79 0.96 0.93 1.08 0.60 0.65 0.87 0.91 1.00 0.93 0.89 1.11 0.78 0.80 0.80 0.82 0.77 0.78
0.77 0.62 0.78 0.57 0.51 0.50 0.45 0.49 0.47 0.39 0.36 0.30 0.30 0.32 0.34 0.27 0.49
0.28 0.30 0.31 0.23 0.23 0.25 0.24 0.25 0.17 0.18 0.11 0.15 0.19 0.23 0.24 0.21
0.75 0.70 0.70 0.41 0.36 0.36 0.31 0.29 0.29 0.24 0.21 0.14 0.19 0.20 0.20 0.18 0.29
0.83 0.88 0.84 0.69 0.70 0.70 0.71 0.82 0.77 0.91 0.68 0.65 0.64 0.67 0.66 0.6
0.61 0.54 0.51 0.53 0.50 0.52 0.55 0.48 0.46 0.46 0.49 0.58 0.43 0.53
1972
0.30 0.44 0.32 0.25 0.23 0.22 0.19 0.20 0.13 0.14 0.18 0.17 0.15 0.014
Notes. *Prices are per case of a portfolio of Bordeaux chateaux relative to the price of a ÔbenchmarkÕ portfolio of wines for the vintages of 1961, 1962, 1964 and 1966. **Predicted prices are fitted from the earlier regression of prices on age and weather.
price of the vintage as taken from the model created earlier using weather and age to predict the price at maturation. The data in Table 3 confirm two remarkable facts. First, most of these older vintages began their lives in the auction markets at prices that are far above what they will ultimately fetch. For instance, the bottom row of the Table indicates that, based on the weather, the wines of a vintage like 1967 would have been expected to sell for about one-half the price of an average of the wines from the 1961, 1962, 1964 and 1966 vintages (the benchmark portfolio). But in fact, the wines entered the auction markets in 1972 at about 50% more than expected, and slowly drifted down in relative price over the years. Second, the Table confirms that the prices predicted by our model are remarkably good indicators of the prices at which the mature wines will ultimately trade. Additionally, it should be mentioned that the model was fit from an entirely different set of data than the set presented above. This eliminates the possibility that this model only performs well because it simply predicts information that it essentially already knows. One interesting way to see the inefficiency in the wine market is to compare the prices of the vintages of 1962, 1964, 1967, and 1969 in calendar year 1972. As the weather data in Figure 2 indicate, and the prediction in the bottom row of Table 3 confirms, in 1972 one should have expected that the 1962 and 1964 vintages would sell for considerably more than the vintages of both 1967 and 1969. In fact, in 1972 these four vintages fetched nearly identical prices, in sharp contrast to what the weather would have indicated. However, by around 1979 the prices of the 1969s and 1967s had fallen to around what would have been predicted by the weather. Ó The Author(s). Journal compilation Ó Royal Economic Society 2008
2008 ]
PREDICTING THE QUALITY
F183
It is apparent from Table 3 and from the above example that most vintages are overpriced when the wines are first offered on the auction market and that this state of affairs often persists for ten years or more following the year of the vintage. Remarkably, the over-pricing of the vintages is especially apparent for those vintages that, from the weather, we would predict to be the poorest. This suggests that, in large measure, the ability of the weather to predict the quality of the wines is either unknown or ignored by the early purchasers and sellers of the wines. One of the most fascinating surprises with respect to vintage pricing is provided by the 1982 vintage. As the data in Figure 3 indicate, this was a warm year, although not especially a dry one and the wines should be good. However, what has happened to these wines is quite remarkable, with their prices virtually taking on a life of their own. Today, the wines from this vintage are priced at double and triple the prices of the superior 1989 and 1990 vintages, and there is no indication – yet – that there will be any correction soon. That there is something odd about the vintage is attested to by the current state of the auction markets, where huge quantities of 1982s are put up for sale at current prices but where no one wants to part with their 1983s or 1985s. This suggests that the auction market may have evolved to include two classes of buyers, those who buy for the wine and those simply looking for a status symbol. The sellers of the 1982s are the former, while the buyers are the latter. The 1982 vintage phenomenon raises serious problems for those who would like to invest in wine but not consume it. How does one predict that a vintage will become a status symbol? For those who consume their wines, anomalies like 1982 cause no problem – they simply buy the wines based on fundamentals and then drink the wines that do not appreciate in price and sell those that do. Wine investors do not, sadly, have the more pleasant half of these two options.
5. Conclusion There is much variability in the prices of mature Bordeaux wines but, as shown, much of it can be explained. First, much of this variability can be explained once the vintage of the wine and its producer is known. Second, a straightforward statistical analysis of the weather in which a vintage is grown and consideration of its age can be used to describe much of the variability in prices across vintages. Finally, the historical reputation of the chateau that produced the wine explains much of the remaining variability in prices. But why does the market for immature red Bordeaux wines appear to be so inefficient when the market for mature wines appears to be so efficient? There may be several related explanations. The current Bordeaux marketing system has the character of an agricultural income stabilisation system and this may be its purpose. For growers to maintain the same income from year to year the price of the young wines must be inversely related to the quantity produced and independent of the quality. In other words, the fewer grapes they produce, the more money they need per grape to maintain the same income; quality must be kept independent of the price or their income would be subject to volatility. Although the actual pricing of young Bordeaux wines falls short of this ideal, it is clearly closer to it than would occur if purchasers used the information available from the weather for determining the quality of the wines. The producers do attempt to raise prices when crops are small, despite the evidence Ó The Author(s). Journal compilation Ó Royal Economic Society 2008
F184
THE ECONOMIC JOURNAL
[ J U N E 2008 ]
that the quantity of the wines (determined by the weather in the spring) is generally unrelated to the quality of the wines (determined mainly by weather in the remainder of the year). Moreover, it is common for the proprietors to claim that each vintage is a good one, independent of the weather that produced it. Indeed, there is no obvious incentive for an individual proprietor to ever claim anything else! A more fundamental question arises about the motives of the early purchasers of the wines. Why have they ignored the evidence that the weather during a grape growing season is a fundamental and easily measured determinant of the quality of the mature wines? And will they continue to do so as the evidence for the predictability of the quality of new vintages accumulates?5 Princeton University
References Ali, H., Lecocq, S. and Visser, M. (2008). ÔThe impact of gurus: Parker grades and ÔÔen primeurÕÕ wine pricesÕ, Economic Journal, this issue. Amerine, M. and Winkler, M. (1944). ÔComposition and quality of musts and wines of California grapesÕ, Hilgardia, vol. 15, pp. 493–675. Ashenfelter, O., Ashmore, D. and Lalonde, R. (1995). ÔBordeaux wine vintage quality and the weatherÕ, Chance, vol. 8(4), pp. 7–13. Ashenfelter, O. and Byron, R.P. (1995). ÔPredicting the quality of an unborn GrangeÕ, Economic Record, vol. 71, pp. 40–53. Ashenfelter, O. and Jones, G. (2000). ÔThe demand for expert opinions: Bordeaux wineÕ, Cahier Scientifique de l’Observatoire des Conjonctures Vincoles Europeenenes, vol. 3 (March) pp. 1–17. Ashenfelter, O. and Storchmann, K. (2006). ÔUsing a hedonic model of solar radiation to assess the economic effect of climate change: the case of Mosel valley vineyardsÕ, NBER Working Paper No. 12380 (July). Combris, P., Lecocq, S. and Visser, M. (1997). ÔEstimation of a hedonic price equation for Bordeaux wine: does quality matter?Õ, Economic Journal, vol. 107, pp. 390–402. Corsi, A. and Ashenfelter, O. (2001). ÔPredicting Italian wine quality from weather data and expert’s ratingsÕ, in (M. Pichery and M. Terraza, eds.), Oenometrie IX. 9th Annual Meeting of the Vineyard Data Quantification Society in Montpellier, Cahier Scientific No. 4, Montpellier. Fair, R. (2002). Predicting Presidential Elections and Other Things, Stanford, CA: Stanford University Press. Gladstones, J. (1992). Viticulture and Environment, Adelaide, South Australia: Winetitles. Haeger, J. and Storchmann, K. (2006). ÔPrices of American pinot noir wines: climate, craftsmanship, criticsÕ, Agricultural Economics, vol. 35, pp. 67–78. Jones, G. and Storchmann, K. (2001). ÔWine market prices and investment under uncertainty: an econometric model for Bordeaux Cru ClassesÕ, Agricultural Economics, vol. 26, pp. 114–33. Jones, G.V., White, M.A., Cooper, O.R. and Storchmann, K. (2005). ÔClimate change and global wine qualityÕ, Climatic Change, vol. 73(3), pp. 319–43. Lecocq, S. and Visser, M. (2006). ÔSpatial variations in weather conditions and wine prices in BordeauxÕ, Journal of Wine Economics, vol. 1, pp. 114–24. Penning-Rowsell, E. (1985). The Wines of Bordeaux, San Francisco, CA: The Wine Appreciation Guild. Wood, D. and Anderson, K. (2006). ÔWhat determines the future value of an icon wine? new evidence from AustraliaÕ, Journal of Wine Economics, vol. 1(2), pp. 141–61.
5
There is some slowly accumulating evidence that today wine critics make fewer prognostications that are as wildly inaccurate as used to be the case. That is, their prognostications about ÔimportantÕ vintages may be less wildly inaccurate today. Still, there are exceptions, such as the 1997 vintage – which is probably the only seriously under-priced vintage currently available. An even greater puzzle is posed by how one explains why, if wine critics simply do as well as those who read the weather, there is a demand for their services. Ó The Author(s). Journal compilation Ó Royal Economic Society 2008