A FIELD STUDY ON COOPERATIVENESS AND IMPATIENCE IN THE TRAGEDY OF THE COMMONS Ernst Fehr and Andreas Leibbrandt1 August 18, 2010
Abstract: This paper examines the role of cooperativeness and impatience in the exploitation of common pool resources (CPRs) by combining laboratory experiments with field data. We study fishermen whose main, and often only, source of income stems from the use of fishing grounds with open access. The exploitation of a CPR involves a negative interpersonal and inter-temporal externality because individuals who exploit the CPR reduce the current and the future yield both for others and for themselves. Economic theory – which assumes the existence of general across-situational traits – thus predicts that fishermen who exhibit more cooperative and less impatient behavior in the laboratory should be less likely to exploit the CPR, which our findings confirm. We thus corroborate economic theory and extend the scope of other-regarding preference theories to crucial economic decisions with lasting consequences for the people involved. In addition, we establish cooperativeness and impatience as two distinct traits related to resource conservation in the field and validate laboratory preference measures.
Keywords: cooperation, common pool resource, experiments, generalizability, impatience, methodology JEL Classifications: B 4, C 9, D 8, O1
1
Corresponding author: Andreas Leibbrandt. University of Chicago, Department of Economics,1126 E 59th Street, Chicago, IL 60637. Email:
[email protected] and Workshop in Political Theory and Policy Analysis, Indiana University. Ernst Fehr: Institute for Empirical Research in Economics, University of Zurich, Blumlisalpstrasse 10, CH-8006 Zurich, Switzerland. Email:
[email protected]. ACKNOWLEDGEMENTS: We would like to thank Carina Cavalcanti for excellent assistance in the field and Björn Bartling, Gary Charness, Uri Gneezy, John List, Raul Lopéz-Péréz, Michel Maréchal, Frans van Winden and the conference and seminar participants in Berkeley, Mannheim, San Diego, Washington, and Zurich for helpful comments. Financial support by the EU Research Network ENABLE (MRTN-CT-2003-505223) is gratefully acknowledged.
Standard economic theory hypothesizes that there is little cooperation in sustaining common pool resources (CPRs) where individual and collective interests are in conflict with one another. The standard assumption of pure self-interest implies that natural resources like fishing grounds or rain forests are overexploited, and that we are often trapped in an inevitable process that ends in the “Tragedy of the Commons” (Hardin, 1968). An additional aggravating factor for resource conservation is the propensity to discount future outcomes. The more impatient resource users are, the more they exploit natural resources.2 Interestingly, observations from the laboratory paint a more optimistic picture with respect to cooperation in social dilemmas. Considerable evidence now shows that some individuals are cooperative and voluntarily sustain CPRs or public goods in the laboratory (Andreoni 1988, Walker, Gardner, Ostrom, 1990; Ostrom, Walker, Gardner, 1992; Andreoni, 1995; Ledyard, 1995; Cardenas, 2000; Fehr and Gächter 2000 and 2002; Casari and Plott, 2003; Croson, 2007; Charness and Villeval, 2009), suggesting that some individuals have other-regarding preferences (Andreoni, 1990; Rabin, 1993; Fehr and Schmidt, 1999; Bolton and Ockenfels, 2000; Charness and Rabin, 2002; Dufwenberg and Kirchsteiger, 2004; Sobel, 2005; Falk and Fischbacher, 2006; Segal and Sobel, 2007). There is also laboratory evidence that individuals differ with regard to their degree of impatience (Benzion, Rapoport, Yagil, 1989; Ashraf, Karlan, Yin, 2006). In view of the key role that economic theory assigns to individuals‟ preferences in the exploitation of CPRs, we examine whether laboratory other-regarding and time preference measures predict fishermen‟s propensity to exploit a CPR that constitutes their main, and often only, source of income. This is a nontrivial task because it requires both laboratory preference measures and field data from the same group of fishermen. The problem is that all sorts of factors – such as reputational incentives, budget, or information constraints – often
2
Farzin (1984) shows that this statement holds as long as the capital requirements for exploiting natural resources are low. If capital requirements are high, however, impatient individuals might shy away from investing in technology that facilitates the exploitation of natural resources and thus be less likely to exploit natural resources. Capital requirements are very low in our setting.
1
confound field measures of preferences, while several factors specific to the laboratory environment but not present in naturally occurring situations might influence laboratory behavior (List, 2006). Moreover, prominent scholars have suggested that preferences are “constructed” and highly context-specific (e.g. Kahneman et al., 1993; Loewenstein and Issacharoff, 1994; Schkade and Payne, 1994; Slovic, 1995; Kahneman, 1996; Hoeffler and Ariely, 1999; Frederick, Loewenstein, O‟Donoghue, 2002). To quote Tversky and Thaler (1990, p. 210): “People do not possess a set of pre-defined preferences for every contingency. Rather, preferences are constructed in the process of making a choice or judgment. Second, the context and procedures involved in making choices or judgments influence the preferences that are implied by the elicited responses. In practical terms, this implies that behavior is likely to vary across situations that economists consider identical.”3 Therefore, if we can show that laboratory measures of other-regarding and time preferences nevertheless significantly predict fishermen‟s behavior in the field, we can kill several birds with one stone. First, we corroborate economic theories that predict the relevance of individuals‟ preferences for the exploitation of CPRs. Second, we extend the scope of other-regarding preference theories to crucial economic decisions with lasting consequences for the people involved. Third, we identify two distinct traits, namely cooperativeness and impatience, that are related to resource conservation in the field. And finally, we demonstrate the value of laboratory preference measures for a better understanding of field behavior. We achieve these goals with the help of two unique data sets that relate individual laboratory behavior with the fishermen's individual decisions pertaining to the use of certain fishing instruments. Our study takes place in Brazil and involves shrimpers and fishermen
3
Beliefs in the context-dependence of preferences have been fueled by the observation of preference reversals across different elicitation methods. For an examination of the preference reversal phenomenon see, Plott and Grether (1979), for example.
2
who live off their catch from a lake. As there is free access to the lake, they face a CPR dilemma in their daily lives. There is suggestive evidence that fishermen in this setting differ in their level of cooperation for sustaining fishing grounds, i.e. they use different fishing instruments that allow them to influence the proportion of the catch consisting of small shrimp/fish which have not yet reached fertility (Cavalcanti, 2003). We have data from shrimpers (collected 2008) and fishermen (collected 2006), and both include information about the extent to which the fishermen's chosen fishing instruments exploit the CPR, as well as their decisions in two laboratory experiments: a public goods experiment where free-riding is the dominant strategy, and a time preference experiment. Economic theories of other-regarding preferences predict that individuals who exhibit a higher propensity to cooperate in the public goods experiment in the laboratory (i.e. those who demonstrate cooperativeness) and those who show more patience in the time preference experiment should use fishing instruments that are less likely to exploit the CPR for the following reasons: (i) a higher current exploitation reduces other fishermen's current yield. Thus, ceteris paribus, other-regarding fishermen will impose fewer current negative externalities on others; and (ii) a higher current exploitation (in terms of small shrimp/ fish that have not yet reached fertility) also reduces the future yield both for others and for themselves.4 Therefore, more cooperative and less impatient individuals will impose fewer (current and future) negative externalities on others and on themselves. To provide a rigorous test of whether cooperativeness and impatience are relevant in the field, we use laboratory preference measures that differ from the field context in important ways. First, the fishermen face a CPR problem in the field, while subjects play a public goods game in the laboratory – a difference that is likely to weaken the behavioral link between the 4
Individual fishermen tend to fish the same spots over extended periods of time, and the fishermen seem to respect this allocation of spots to individuals. This means that they are able to establish weak property rights, implying that they also harm themselves in the future if they catch infertile animals. However, due to the mobility of fish and shrimp throughout the fishing grounds, they obviously also harm other fishermen.
3
two situations (Andreoni, 1995).5 Second, the cooperation problem in the field is embedded in the natural frame of the environment the subjects face every day, while the public goods game was one-shot and framed in an abstract way as a transfer of money from a private account to a group account. This makes it more difficult for the subjects to behave according to their preexisting preferences because subjects may not fully grasp the prevailing incentives in novel situations (Plott, 1996).6 Third, our experimental time preference measure is related to time preferences within a day, while the time preferences involved in the common pool resource problem relate to months, years, or even decades. Fourth, our time preference measure is based on inter-temporal choices about chocolate and mineral water, while the inter-temporal trade off in the CPR problem concerns current versus future yield of shrimp and fish. Despite these widely different contexts, we find that these laboratory measures of other-regarding and time preference in both data sets are important predictors of individual behavior in real world CPRs. In line with the predictions, we observe that more cooperative and patient shrimp fishermen use shrimp traps with bigger holes where small shrimp – which have not yet reached reproductive maturity (i.e., “infertile” shrimp) – can escape (see Figure A in the appendix), and more cooperative and patient fishermen who catch fish use fishnets with larger mesh sizes in which only bigger fish are caught (see Figures B and C in the appendix). Thus we provide evidence that cooperativeness and impatience are traits that are not so strongly context dependent as to render the typical economic preference approach meaningless. Note that the behavior in the laboratory public goods and time preference experiments is predicted to be independent because time preferences cannot play a role in the public goods 5
For evidence in support of Andreoni‟s finding see e.g. Anderson et al. (2008). Plott (1996) proposes the “discovered preference hypothesis” as an alternative to the “constructed preference hypothesis”. Plott defends the economic view of stable preferences across contexts and argues that subjects only need to “discover” their pre-existing preferences through experience. Plott therefore favors stationary replication of experimental situations because this provides the best chance for subjects to discover their preferences in the course of an experimental session. 6
4
experiment. We indeed find that fishermen who are impatient in the time preference experiments are neither more nor less likely to cooperate in the public goods experiments. Our study thus finds that both cooperativeness and impatience are independently related to resource conversation in a naturally occurring field situation. There are several field studies in which the observed behavioral patterns are consistent with the existence of cooperativeness (e.g. Feeny et al., 1990; Sneath, 1998; Ostrom, 1999; Bandiera, Barankay, Rasul, 2005; Ostrom and Nagendra, 2006; Mas and Moretti, 2009). However, these studies do not show a direct link between cooperativeness and the observed field behavior. In fact, they cannot exclude the possibility that social pressure or reputation effects exclusively drive cooperation behavior in the field (Kandori, 1992). Bandiera, Barankay, Rasul (2005), for example, find that fruit-pickers work less if their effort has negative externalities on their co-workers, but only in fruit fields where their co-workers can monitor them. Similarly, Mas and Moretti (2009) find that cashiers work faster if a harder-working colleague can observe them, but not if the harder-working colleague cannot observe their work speed. In addition, the field experiments by Landry et al. (2006) and DellaVigna, List, Malmendier (2009) suggests that charitable donations are not necessarily a consequence of altruism, but are often motivated by status concerns or social pressure. Only a few studies combine laboratory experiments with field observations for a better understanding of cooperation behavior in the field (Karlan, 2005; Carpenter and Seki, forthcoming; List, 2004a, 2004b, 2006; Laury and Taylor, 08; Benz and Meier, 2008). Karlan (2005) conducted economic experiments with borrowers in a Peruvian microcredit program and reports that the behavior in a trust game predicts loan repayment. Individuals who transfer less money back to their trustor in a trust game are also more likely to drop out of the program and to default on their loans. This study shows that behavior in laboratory experiments can predict field behavior. However, since many trustors knew their trustees personally in the trust
5
game Karlan presents, selfish reputation motives might have influenced back-transfers.7 List‟s (2006) study with sports card traders suggests that reputational concerns may affect cooperativeness in the field. He finds that dealers classified as “local dealers” show gift exchange behavior in the laboratory and the field, while dealers classified as “nonlocal dealers” show less overall cooperation in the field. This finding is consistent with strategic reputation building among local dealers; it is also possible, however, that local dealers care, per se, about their reputations, i.e., that their reputations have a direct effect on their utility.8 The studies by Benz and Meier (2008) and Laury and Taylor (2008) examine the link between students‟ lab behavior and their charitable contributions. This contrasts with our study which predicts the fishermen‟s resource conservation behavior in their professional activity – constituting their main source of income – with laboratory measures of impatience and cooperativeness.9 Our findings help assess the relevance of cooperativeness as well as the scope of other-regarding preference theories in naturally occurring situations. We show that there is no insurmountable gap between the laboratory and the field, even though the context in our laboratory environment differs from the field context in important ways. Our findings show that individuals‟ traits are not sufficiently malleable and context-dependent to render the economic preference approach meaningless. In addition, our evidence shows that both cooperativeness and impatience are important in understanding the exploitation of CPRs, suggesting methods for reducing their overexploitation. Overexploitation may be constrained, 7
A similar argument also applies to the public goods game in Karlan (2005) which was not played anonymously. In addition, it was a step level public good with many Nash equilibria, implying that purely selfish players have an incentive to contribute if they believe they are the pivotal players. This may be the reason why the author finds no significant relationship between the public goods game and loan repayment. 8 One important difference between our study and that of List (2006) is that we combine both laboratory and field data from the same individuals, enabling a direct study of the extent to which the laboratory preference measures predict an individual‟s field behavior. 9 The study by Carpenter and Seki (2005) suggests that cooperative fishermen – as measured by a laboratory public goods game – are more likely to self-select in groups which implemented team-based compensation and work schemes. Cooperative fishermen are more likely to work in situations where income and operating expenses are shared over a group of fishing boats than in those environments where sharing only occurs among the members of the own boat. In contrast to our study, the authors do not examine individual cooperation behavior in the field, but only aggregate productivity across the two different groups.
6
for example, with the help of economic policies that shift the perception of the cost of current overexploitation from the future to the present. The paper proceeds as follows. Section I presents the field setting and the field data. Section II presents the laboratory experiments. Section III links the behavior of shrimp fishermen in the laboratory experiments with their field behavior. Section IV provides further corroborating evidence for the role of cooperativeness and impatience in CPR conservation by linking the behavior of fishermen who catch fish in the laboratory experiments with their field behavior. Section V concludes.
7
I. Field Setting and the Data A. Field Setting Our study took place at a lake in northeastern Brazil. Several rural fishing villages 10 are situated around this lake; fishing is the main and often the only possible way of earning a living. Fishermen in this setting catch shrimp and fish on their own, sell their catch at fish markets, thus providing their family with nutrition and income. There is free access to the fishing grounds (shrimp and fishing grounds), and a fisherman‟s capital requirements are rather low. For catching shrimp, fishermen only need a small boat and shrimp traps which they manufacture from used PET bottles.11 While fishing, fishermen are typically scattered over the lake and fish at their preferred, sometimes remote spot(s). Other fishermen usually respect these spots, i.e. most fishermen do not fish at or close to another fisherman's spot. Their respect for others‟ fishing spots means that the fishing ground at this lake is not a pure CPR, but shares some features of a private property. The fishermen are aware of the fact that overfishing – for instance by using shrimp traps with small holes – has negative externalities on others12, but the private aspect of their fishing spots also means that private investments like refraining from catching small shrimp or fish affect their own chance of catching these same shrimp or fish at a larger size at the same spot in the future. There are no legal constraints on the fishing instruments we study, and there are no legal regulations concerning catching shrimp.13 In recent years, many fishermen have complained about decreasing catch rates, which they mostly blame on the overexploitation of the shrimp and fish resources, i.e., catching large amounts of infertile shrimp and fish 10
We use the term "villages" for reasons of simplicity. In this field setting, these are sometimes not villages in the ordinary sense, but rather community agglomerations with unclear borders between the neighboring community agglomerations or villages. 11 Fishermen typically use a fishnet for catching fish. The costs for a fishnet can be normally paid with the income generated from one week's catch. 12 When fishermen meet, the use of PET bottles with small holes (and fishing with fishnets with small mesh sizes) is frequently discussed and recognized as a cause of overfishing. 13 There is only one legal regulation concerning fishing, which is the prohibition of catching small fish (below 20–30 centimeters, depending on fish type). This regulation, however, is not enforced.
8
(Cavalcanti, 2003). A research project with fishermen revealed their strong concern about the excessive exploitation of shrimp resources in this field setting (Cavalcanti, Schläpfer, Schmid, 2010). Governmental and local university institutions have taken note of the severity of the situation and have initiated first steps to help sustain the fishing grounds. A management council was introduced to examine the current fishing situation.
B. Field Data In the following sections, we report the 2008 data from the fishermen catching shrimp („shrimpers‟). The 2006 data for the fishermen is presented briefly as further corroborating evidence in section IV.14 We selected community agglomerations that can be considered as traditional fishing villages and which were accessible by car. In these villages, we investigated the fishing instruments of 114 shrimpers recruited with the help of the village leaders who invited the village members to a “fishermen‟s meeting”. All 114 shrimpers agreed to participate in the experiments. In addition, all of them were also willing to answer the survey questions. We ran one experimental session in each community agglomeration, typically in a local school building. Participants were not allowed to speak with other participants during the experimental session. Participants received a code to ensure anonymity for the laboratory experiments and surveys15, and were free to leave at any point in time. The majority of our participants were male (73%), and were experienced, full-time shrimpers who generated their income mainly from shrimping. On average, the shrimpers had been in the profession for 17.4 years and their average daily working time was roughly 4 hours, not including the time spent
14 15
A more detailed analysis of the 2006 data can be found in the working paper (Fehr and Leibbrandt, 2008). At the beginning of the experimental session, each participant filled out a code form that linked his or her name to an individual code. This code, instead of the participant's name, was then used on surveys, decision sheets, and envelopes during the experiments. Only the main experimenter had access to the code forms after termination of the experimental session. Participants collected their earnings by showing their codes to the main experimenter.
9
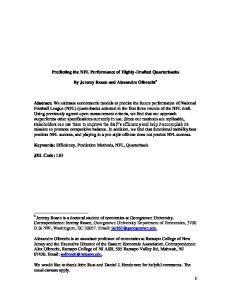
preparing and selling the shrimp. 57% derived their income exclusively from shrimping, and another 29.5% derived a small additional income from selling agricultural products. In order to control for income, we also asked participants about their monthly income. On average, they earn a monthly income of 302 Reais from all activities.16 Participants spent on average 3.4 years in school and lived in a household with 5.5 persons. 95.4% of the shrimpers only used modified PET bottles with small holes to catch shrimp.17 Summary Table A in the appendix provides an overview of the survey measures we use in our estimations. We take the shrimpers shrimp traps as a measure of their cooperativeness in sustaining the fishing grounds. Shrimpers manufacture their shrimp traps by making holes in used PET bottles. The smaller the holes in the traps, the greater the share of infertile shrimp caught in the trap (i.e. those with a length smaller than three centimeters). The average size (i.e., length) of caught shrimp is usually between two and three centimeters. For our purposes it is important to stress that even small variations in the millimeter domain make a difference as to how many infertile shrimp are caught. Thus, by varying the size of the holes in the shrimp trap, the shrimpers determine the extent to which they decrease their own and other shrimpers future yield by catching small, infertile shrimp. We collected most bottles several months after the experiment, examined one to two bottles from each of 114 shrimpers and measured five to ten holes in each bottle at the 0.1 centimeter level to construct our variable hole size.18 This variable denotes the average size of the holes in the shrimp traps for each fisherman. Figure 1 shows the distribution of hole sizes in our sample. The average hole size is 0.448 centimeters. Half of our participants use shrimp
16
The Brazilian currency is called Real (singular) or Reais (plural). 1 Real equaled US $ 0.47 in September 2008, 302.4 Reais = US $ 142.1. 17 The remaining 4.6% use two different shrimp traps at the same time (PET bottles and “bamboo baskets”). 18 Note that shrimper typically use an instrument like a pen to make holes. We find that (for a given shrimper) there is little variation in the average hole size regardless of whether we measure 5 or 10 holes per bottle. We therefore ultimately decided to measure five instead of ten holes. We have data from two bottles for 103 of the 114 shrimpers, and data from one bottle for the remaining 11 shrimpers.
10
traps with a hole size between 0.367 and 0.500 centimeters, while 90% of the average hole size lies between 0.320 and 0.580 centimeters.
[INSERT FIGURE 1 ABOUT HERE] The use of hole size as a measure of shrimpers cooperativeness in the field has several advantages compared to other indices of cooperativeness such as the catch quantity or catch composition. First, catch quantity is not an unambiguous measure of the extent to which a fisherman decreases the future yield for himself and for others because – in principle – a large quantity of shrimp caught need not contain many infertile shrimp. In fact, catching a large quantity of big shrimp may even be perceived as a skill and not necessarily as an uncooperative act among shrimpers. A small hole size, in contrast, is clearly associated with the persistent catch of small, infertile, shrimp which diminishes the future shrimp yield. In practice, a small hole size will, of course, lead to a larger quantity of shrimp caught19, but because a larger quantity of shrimp caught is a less precise indicator of cooperativeness in the field, the hole size measure is preferable. The second advantage of hole size as a measure of cooperativeness derives from the fact that the shrimp traps are durable goods that can be used over long periods of time. Thus, our hole size measure gives us a measure of cooperativeness over an extended time period. As the shrimpers do not record their catch quantity or their catch composition over time, it is impossible to collect objective data on these variables over longer time periods (i.e. several
19
Our measure of hole size is negatively related to self-reported catch quantity. In the survey, we asked fishermen to estimate how many liters of shrimp they catch in general during a good week and find that the larger the hole size, the fewer liters of shrimp the fishermen report catching (r =- 0.246, p=0.0077). In addition to the reasons given in the text, we did not use our catch quantity measure because it is self-reported and therefore imprecise. This contrasts with our hole size measure which is based on our own precise measurements.
11
months). We would instead have to rely on self-reported data which tend to be less reliable. This is another reason why we prefer the hole size measure.20 We also collected survey data regarding participant‟s perception and beliefs about current CPR exploitation in their setting which are measured on an ordinal scale. The variable field perception measures the participant‟s perception about the necessity of the introduction of an environmental program limiting the use of PET bottles with small holes. The variable field belief measures the participant‟s belief about the fraction of the other participant‟s shrimp catch that is below two centimeters. Furthermore, we measure whether participants live centrally by asking how many people live in their close neighborhood. The survey was collected on the same day the laboratory experiments were conducted. In addition, we have data on the shrimpers' cognitive ability, which we measured by giving them three Raven`s matrices to solve (the share of correct answers ranged from 32.1% with zero, 39.7% with one, 23.1% with two, and 5.1% with three).21
II. The Laboratory Experiments A. The Public Goods Experiment with Shrimpers Shrimpers took part in an anonymous laboratory public goods experiment (PGE) with comparatively high monetary stakes. The participants earned approximately 1.8 times their available daily income during an experimental session. They were divided into groups of three
and
played
this
experiment
for
one
period.
The
payoff
function
was
20
We would like to point out, however, that we also examined the relationship between the self-reported composition of the shrimp catch and laboratory measures of cooperativeness and impatience in an earlier version of this paper (Fehr and Leibbrandt, 2008). The results in the earlier version were in line with the results we present below, i.e. fishermen that are more impatient and less cooperative in the laboratory experiments had a catch composition that contained a larger share of small, infertile, shrimp. This fact supports the robustness of our findings; it is reassuring that different measures of cooperativeness in the field lead to similar results. 21 Raven`s matrices are multiple choice tests of abstract reasoning. They are widely accepted as a culture-free measure of cognitive skills. In each of our three tests, we presented participants with six segments and asked them to find the missing segment required to complete a larger pattern.
12
i xi , x j (10 xi ) 0.5 x j xi . Each participant had to decide how many out of j i ten monetary units (MUs) he wants to contribute ( xi 0,10) to a public good.22 For each unit he contributed, he increased each of his group members' monetary payoff j by 0.5 MUs, while simultaneously reducing his own balance by 0.5 MUs. For each unit one of his group members decided to contribute, his own balance was increased by 0.5 MUs. Since the participants net return from contributing was negative, selfish participants should never contribute. However, if none of the three individuals in the group decided to contribute, each of them only earned 10 MUs, compared to 15 MUs if all of them contributed all ten MUs. The experiment was framed in abstract and neutral terms. Participants decided how many of the ten MUs they want to keep in their private account and how many they want to transfer to a group account. They were given two envelopes, one containing ten MUs (i.e. their endowment on the private account) and one containing 0 MUs. The participants could transfer MUs from one envelope to the other; then they put both envelopes in a box. During the decision, the experimenter turned his back on the subject so that the participant was sure that the experimenter did not know his decision. After participants made their decisions, they were asked about their expectations of others` contributions. If they guessed another participant's contribution correctly, they could win five additional MUs. All rules were explained individually to the participants. No participant was informed about the identity and individual contribution decisions of his group members. The instructions are reproduced in the appendix. Most shrimpers do not behave completely selfishly, but contribute to the public good (only 15.8% do not contribute and 11.4% contribute only one MU). 21.1% contribute five MUs and 18.4% contribute more than five MUs. Approximately half of the participants
22
One MU always equaled one Real if the PGE was selected for payment. Participants took part in five experiments (lottery experiment, coordination experiment, charity experiment, and competition experiment out of which two experiments were paid out. Participants only knew which two experiments were actually paid out after they had played all experiments. The results from the other experiments are available upon request.
13
contribute no more than three MUs (58 out of 114). In regression Table B in the appendix, we observe that expectations about the contributions of the other group members are by far the most important variable for predicting the behavior in the PGE (t>5.05, p<0.0001) – a finding in line with earlier evidence and that suggests that many individuals are conditionally cooperative (Fischbacher, Gächter, Fehr, 2001, Keser and van Winden, 2002; Frey and Meier, 2004; Shang and Croson, 2008). In addition, we find that two control variables are at least marginally significant in models 1 and 4. We observe that more experienced shrimpers contribute more (t>1.79, p<0.076), and that shrimpers who report a higher monthly income contribute more (t>1.90, p<0.061). We control for these variables in the following regressions.
B. The Time Preference Experiment with Shrimpers At the beginning of the experimental session, we implemented a time preference experiment (TPE) to obtain a measure for impatience. In this TPE, all participants had to indicate whether they preferred two pralines immediately or three pralines at the end of the experimental session (on the same day) when they received their overall monetary payments from the experiment. The pralines (“Sonho de Valsa”) are very popular among the participants; the vast majority (97%) liked the pralines (variable name: preference for praline). We have time preference data from this experiment for 83 of our 114 shrimpers.23 61.45% are patient and prefer waiting approximately two hours until the end of the experimental session to get three pralines, while the remaining 38.55% are impatient and
23
Unfortunately, we could not play the TPE in two of our experimental sessions because the pralines were sold out in the local store.
14
prefer receiving two pralines immediately.24 In column 2 of regression Table B, we observe that none of the control variables significantly predicts the decision in the TPE.
C. The Relation between Other-Regarding Preferences and Impatience in the Laboratory Other-regarding preferences and impatience might play an important role in explaining the individual degree of CPR exploitation in the field. The laboratory provides an opportunity for deriving distinct measures for both factors. We use our PGE to obtain an individual measure of other-regarding preferences and the TPE to obtain an individual measure of impatience. Because there are no intertemporal spillovers in the PGE, measured impatience in the TPE should not predict cooperativeness in the laboratory. Our data confirm this prediction. Individuals who are impatient in the TPE are neither more nor less likely to contribute in the PGE (Fisher Exact Test, p=0.574). This is also true after controlling for covariates. In regression Table B, models 3 and 4, we observe that the impatience dummy is insignificant (p>0.276).25
III.
Predicting Cooperation in the Field with Laboratory Preference Measures
The heart of this paper uses our laboratory preference measures to predict individual levels of CPR exploitation. We use the public goods and time preference experiment to predict the average hole size in the fishermen's shrimp traps. We hypothesize (i) that fishermen who contribute more in the PGE use shrimp traps with bigger holes so that small, infertile, shrimp can escape more easily, and (ii) that fishermen who are impatient in the TPE use shrimp traps with smaller holes that are more exploitative of the fishing grounds.
24
Note that once the pralines were given to the participants, they had to be consumed right away (and typically were) because they would otherwise melt in the heat. We kept the pralines in a cooler before we distributed them to the participants. 25 The absence of a correlation between our time preference measure and our lab cooperation measure replicates the finding in an older working paper version (Fehr and Leibbrandt, 2008).
15
A. Other-regarding Preferences and Hole Size in Shrimp Traps Figure 2 provides a first insight into the relationship between contributions in the PGE and the average hole size in the shrimp traps. This figure shows the average hole size for fishermen categorized in three groups according to their level of contributions in the PGE. Fishermen with the lowest contributions (0 or 1 MUs) have the smallest hole sizes (0.413 centimeters, N=31), followed by fishermen with medium contributions (2–4 MUs, 0.443 centimeters, N=38). Fishermen with the highest contributions who contribute at least half of their endowment have substantially larger hole sizes than the other fishermen (0.482 centimeters, N=45). Overall, there is a positive and highly significant correlation between contributions in the PGE (0,1,…,10) and hole size (r=0.253, p=0.0067). We investigate whether the impact of lab cooperation on the hole size is robust to different specifications and controls in the regressions in Table 1. Model (1) shows that without using controls, each MU contributed in the public goods game (0,1,2…,10) is associated with a 0.0105 centimeter increase in average hole size (t=2.58, p=0.011), which means that a maximally cooperative fishermen uses on average 0.105 centimeter larger holes (i.e. approximately 25% larger holes) than a fully selfish fisherman who contributes nothing to the laboratory public good. Model (3) shows the effect after adding several controls. The effect is of similar size to that in Model (1) and highly significant (t=2.44, p=0.016). In model (4), we add the impatience dummy as a control variable. This leaves the size (0.0103) and the significance (t=2.51, p=0.014) of the coefficient of individual contribution levels unaffected. We introduce village/community agglomeration fixed effects in model (5) to account for potential regional differences. The coefficient of individuals‟ contributions in the PGE is slightly smaller in this regression, but still significant (t=2.21, p=0.030).
[INSERT FIGURE 2 ABOUT HERE] 16
[INSERT TABLE 1 ABOUT HERE]
B. Impatience and Holes in Shrimp Traps The evidence indicates that fishermen who are impatient in the TPE and prefer two pralines immediately over three pralines at the end of the experimental session use smaller holes in their shrimp traps than patient fishermen. The average hole size for impatient fishermen is 0.406 centimeters, whereas patient fishermen who prefer three pralines at the end of the experimental session use holes that are on average 0.457 centimeters. Regressions 2, 4, and 5 in Table 1 indicate that this difference in hole size is significant and robust to the inclusion of controls. In the absence of controls (model 2), the estimated coefficient is roughly 0.05 centimeters with a t-value of 2.19 and a p-value of 0.031. Model (4), which adds our standard control variables, leaves the size and the significance of the coefficient largely unchanged (coefficient = 0.054 centimeter, t=2.26, p=0.027). Impatience remains also significant at the 5 percent level after controlling for village fixed effects (model 5).26 27 Apart from contributions in the PGE and impatience, family size is the only significant predictor of hole size in all three models with controls (t=1.88,p<0.065). Fishermen with more children use larger hole sizes, suggesting that they are more concerned about sustainable fishing, perhaps because they want their children to be able to sustain their living as fishermen. Moreover, some variables seem to play a role for hole size, although they are not significant in all regressions. The variables field perception and years in profession are 26
We also examined whether there is an interaction effect between time and other-regarding preferences on hole size. Depending on the model specification, the interaction term is not or only marginally significant. Note that because fishermen can establish some elementary (i.e. weak) forms of property rights by using the same fishing spots for longer time periods, their time preferences can play a role in the field regardless of whether they have other-regarding preferences. 27 We also measured the role of cognitive skill in hole size. We have data on cognitive skills (measured by Raven‟s matrices) for 78 fishermen for whom we also have data on hole size as well as on other-regarding and time preferences. We find that our measure for cognitive skills is completely unrelated to hole size; this holds regardless of whether we look at the pure correlation (r=-0.01, p=0.914) or at the coefficient of this variable in our regression models (e.g. p=0.618 in model 3). The additional control for cognitive skills also leaves the effect of individual contribution levels and impatience on hole size largely unchanged (coefficient for cooperativeness=0.0097, p=0.028; coefficient for impatience=-0.0615, p=0.023 in model 4, for example).
17
significant in models 4 and 5. Fishermen who favor the introduction of an environmental program which aims to limit the use of shrimp traps with small holes tend to use larger holes in their shrimp traps. We may thus speculate that information policies intending to change fishermen's perception may be useful in mitigating CPR exploitation. Years in profession is negatively related to hole size, suggesting that policies aiming at mitigating CPR exploitation should be targeted towards more experienced fishermen in particular. The variable field belief is significant in model 4, and marginally significant in models 3 and 4. Fishermen who believe that other fishermen catch a larger fraction of small shrimp use smaller holes, which is consistent with the assumption that fishermen are also conditionally (un-) cooperative in the field. In addition, the regression table shows that male fishermen tend to use larger holes, but this effect becomes insignificant after controlling for village fixed effects. The number of shrimp traps in use that fishermen report is significantly predictive of hole size in model 3 and marginally predictive in model 4, showing that fishermen who use larger holes also tend to use fewer shrimp traps.28 We would also like to point out that the number of shrimp traps is significantly negatively correlated to laboratory cooperativeness (r=-0.137, p=0.044), and that the weekly time spent catching shrimp is also significantly negatively correlated to laboratory cooperativeness (r=-0.150, p=0.028). This shows that more cooperative fishermen not only use larger holes in their traps, but also report using fewer traps and spending less time catching shrimp.
28
Note that the number of shrimp traps in use is compared to hole size an inferior measure of CPR exploitation. First, the measure is self-reported and, second the number of shrimp traps is not informative about the catch composition, i.e. it provides no information about the fraction of small, not yet fertile, shrimp. Note also that fishermen vary the quantity of shrimp traps they use.
18
IV.
Further corroborating evidence
In this section, we provide further evidence on the role of other-regarding and time preferences for CPR conservation by examining the behavior of fishermen most of whom use fishnets to catch fish. The fishnets differ according to their mesh size, and the smaller the fishnet mesh size, the more infertile fish are caught in the fishnet.29 Thus, the same arguments that speak for hole size as a measure of cooperativeness in the field also apply for mesh size. We hypothesized that fishermen who display more cooperation in a public goods experiment use fishnets with larger mesh sizes and predict that impatient fishermen use smaller mesh sizes.
A. The 2006 Field Data We collected data on the mesh sizes of the fishnets from two sources: survey responses in 2006 and field observations in 2008. While re-visiting the fishermen in 2008, we investigated the fishnets of approximately every third fisherman who participated in 2006 and who used a fishnet (35 out of 121).30 We find that the two year old survey responses are very much in line with the recent field data (r = 0.70; p<0.0001). Figure D in the appendix illustrates the relation between the survey data and the field observations. Almost two-thirds of the fishermen use a mesh size smaller than five centimeters, with a mean of 4.42 centimeters. The most frequently used mesh sizes are 3.5, 5, and 6 centimeters. Figure E in the appendix shows the distribution of mesh sizes in our sample. 29
Note that while fishnets differ according to their mesh size, the price of the fishnet is independent of the mesh size. Fishnets with smaller mesh sizes are not more expensive than fishnets with bigger mesh sizes. If fishermen possess more than one fishnet, the variable mesh size specifies the mesh size of the fishnet that is used most frequently. Using a fishnet with a larger mesh size leads to an income reduction of approximately 8%. We asked fishermen to fill out a daily report for several weeks where they reported which mesh size they used, the amount of fish they caught, and the weight of fish caught in kilograms. Nine fishermen reported frequently using two different mesh sizes. When they use the smaller mesh size, they report catching a 21.5% larger number of fish per hour (p < 0.01) and 16% more kilograms of fish per hour (p = 0.07). If we assume that the additional fish caught with a small mesh size are all small fish that are sold at a 50% lower price (e.g., instead of a normalized price of 1 for larger fish the small fish are sold at a price of 0.5), the fishermen who use a small mesh size earn roughly 8% (0.16 x 0.5) more income per hour. A 50% lower price for small fish is a realistic assumption according to information provided by the fishermen and based on our own observations. 30 Typically, we went to the fishermen's houses or to the lake and asked them to show us their fishnets.
19
The fishermen also took part in a laboratory public goods and time preference experiment played anonymously (PGE 06 and TPE 06). In the PGE 06, fishermen had to decide how many of seven MUs they contributed to a public good in each of five different periods. The group size was four and stable during all periods. Because the fishermen‟s net return from contributing to the public good was negative, never contributing anything was always in their material interest if the selfishness and rationality of all individuals was common knowledge. The more cooperative the fishermen are, however, the more we expect them to contribute. 87% contributed in the first period, with almost half of the fishermen contributing between three and five units. Contributions declined continuously in the remaining four periods. In the TPE 06, fishermen had to indicate whether they preferred one bottle of mineral water immediately or two bottles the next day. If they preferred the good immediately, the fishermen received it right after the experiment. If they preferred two units of the good the next day, we distributed vouchers with which they could collect their good the next day at the village leader's house. The village leader was elected by the residents and is usually considered an extraordinarily trustworthy person.31 We observe that 59.6% were impatient and preferred one bottle of mineral water immediately. As in our 2008 laboratory experiments, we find no significant relationship between cooperativeness and impatience in the 2006 experiments.
31
In practice, we had the strong impression that the participating fishermen were confident about receiving their good (the next day). Nevertheless, before individuals made their choice in the TPE, we assured them that they would receive their good. We also asked many participants if they were concerned about not receiving their good – which was not the case. Participating fishermen also had the possibility of seeing the experimenters give the village leaders the mineral water for distribution on the next day. After the experiments, we asked the village leader whether all participants collected their goods – which was the case. When we re-visited the participants, none complained about not receiving her/his good.
20
B. Cooperativeness, Impatience, and Fishnet Mesh Size We find a highly significant positive relationship between behavior in the PGE 06 and mesh size. The correlation between contributions in the PGE 06 and mesh size is 0.31 (Pearson, p=0.0004). If we perform a median split and divide the fishermen into two equally sized groups according to their contributions in the first period of the PGE32, we observe that those who are less cooperative and who contribute less than five MUs (N=61) use an average mesh size of 4.03 centimeters (the mode in this group is 3.5 centimeters with 25 of the 61 subjects choosing the mode), whereas those who are more cooperative and contribute at least five MUs (N=62) use an average mesh size of 4.73 centimeters (there are two modes at 5 and 6 centimeters in this subgroup with 15 subjects each choosing the mode). The difference in mesh size between the low and the high contributors is significant at any conventional level (t=-3.891, p=0.0002) and substantial.33 In regression Table 2, we use two OLS models to predict the mesh size. In model (1), we use the behavior in our two laboratory experiments as independent variables and control for several socio-economic and fishing related measures and for village fixed effects. We find that the individual levels of contributions in the first period of the PGE 06 are positively related to fishnet mesh size. Each MU contributed in the first period of the PGE is associated with a 0.133 centimeter larger mesh size (t=2.72, p=0.008). In model (2), we only use the small sub-sample of 35 fishermen where we observed the fishnets and we control for the significant covariates from model (1). We still find a marginally significant relationship for cooperativeness (t=1.80, p = 0.083).
32
The results are similar if we use the average contributions in all five periods as a measure instead of the contribution in the first period (see Fehr and Leibbrandt, 2008). 33 While it is difficult to find an exact correlation between a one centimeter difference in mesh size with respect to the size of fish ultimately caught (since this depends on the type of fish), the fishermen estimate this to be approximately 3–7 centimeters. Note as a rough reference point that small fish below the legal minimum size (20–30 centimeters depending on fish type) are frequently caught in fishnets with mesh sizes smaller than five centimeters.
21
We also find a negative effect of impatience on mesh size in model (1). Fishermen who are impatient and prefer one bottle of mineral water immediately over two bottles tomorrow use 0.366 centimeter smaller mesh sizes (t=1.99, p=0.049). In our smaller subsample with only those fishermen for whom we directly observed the fishnets (model 2), the coefficient for impatience is even larger (t=1.86, p=0.074). [INSERT TABLE 2 ABOUT HERE] The regressions in Table 2 also show that the variable field perception which we measured in a survey plays an important role in both models. Fishermen who reported already perceiving a relatively small mesh size as harmful tend to use larger mesh sizes. In addition, we find that the variable field belief is significant in both models. It turns out that if a fisherman reports being more pessimistic about the other fishermen's exploitation levels, the more likely he is to use a small mesh size.
V.
Conclusion
In this paper, we show that cooperativeness plays an important role in economic decisions with lasting consequences in naturally occurring situations. We find in two different data sets that shrimpers and fishermen who behave more prosocially in a public goods experiment use fishing instruments that are less likely to exploit the fishing grounds. At the same time, we show that impatience plays a significant role in cooperation in the field; in both data sets, fishermen who are impatient in a time preference experiment use fishing instruments that are more likely to exploit the fishing grounds. We establish a link between laboratory and field behavior, even though there are important contextual differences between the lab and the field environment. Subjects play a one-shot public goods game in the lab, while they face a permanent common pool resource problem in the field; the lab experiment is framed in
22
abstract terms, while subjects face the cooperation problem in its naturally occurring frame in the field; and we elicited time preferences over hours and days in the lab, while individuals‟ time preferences over weeks, months, and years matter in the field. The fact that we nevertheless find a robust and significant link between our laboratory preference measures and our field measures challenges the view that preferences are so highly context-dependent as to render the economic preference approach useless. This of course does not imply that we should not be very cautious when extrapolating laboratory experiments measuring economic preferences (for an overview see Levitt and List, 2007). While we should take care when extrapolating economic preferences, we believe that our results also may have important implications for policymakers, managers, and social scientists. They provide empirical evidence that taking impatience into account is useful when designing policy measures, as it is an obstacle in implementing resource preserving policies. Likewise, knowledge about the conditional nature of fishermen‟s cooperativeness may be useful, i.e., their conditional willingness to cooperate in concrete situations, even if cooperation goes against their immediate self-interest. Thaler and Benartzi (2004) designed the Smart commitment mechanism which helped impatient employees who lack self-control increase their future savings. We imagine a similar mechanism for promoting resource conservation which would incorporate both the propensity to discount future outcomes as well as the propensity to cooperate voluntarily (if others cooperate as well). Individuals could be approached to commit in advance to change their behavior towards a more sustainable use of resources, but this commitment would only become binding if a specified majority of the other resource users also were to commit. For example, the fishermen could commit (e.g., by signing a contract with an environmental agency) to exchange their fishnets with small mesh size for fishnets with bigger mesh size in the future if a specified majority of the other fishermen were also 23
willing to commit to this policy. This proposal takes advantage of the conditional nature of fishermen‟s willingness to cooperate and furthermore reduces the perception of the cost of cooperation by shifting the fishnet exchange into the future. Thus, impatient individuals who lack self-control and conditionally cooperative individuals would be more likely to commit to this policy than to an alternative policy requiring unconditional cooperation and imposing the cost of cooperation in the current period. Similar mechanisms could be applied to other settings as well. For example, policymakers could ask commuters in metropolitan areas to commit to buy a one-month ticket for public transportation for the following year as soon as a sufficient number of commuters were also willing to keep this commitment.
24
REFERENCES
Anderson, Steffen; Bulte, Erwin; Gneezy, Uri and List, John. “Do Women Supply More Public Goods than Men? Preliminary Experimental Evidence from Matrilineal and Patriarchal Societies”, American Economic Review Papers & Proceedings, 2008, pp. 376-381. Andreoni, James. “Why Free Ride – Strategies and Learning in Public Goods Experiments”, Journal of Public Economics, 1988, 37(3), pp. 291-304. Andreoni, James. “Impure Altruism and Donations to Public Goods: A Theory of WarmGlow Giving?”, Economic Journal, 1990, 100(401), pp. 464-477. Andreoni, James. “Warm-Glow Versus Cold-Prickle: The Effects of Positive and Negative Framing on Cooperation in Experiments”, Quarterly Journal of Economics, 1995, 110(1), pp. 1-21. Ashraf, Nava; Karlan, Dean and Yin, Wesley. “Tying Odysseus to the Mast: Evidence from a Commitment Savings Product in the Philippines”, Quarterly Journal of Economics, 2006, 121(2), pp. 635-672. Bandiera, Oriana; Barankay, Iwan and Rasul, Imran. “Social Preferences and the Response to Incentives: Evidence from Personnel Data”, Quarterly Journal of Economics, 2005, pp. 917-961. Benz, Matthias and Meier, Stephan. “Do People Behave in Experiments as in Real Life? Evidence from Donations”, Experimental Economics, 2008, 11(3), pp. 268-81. Benzion, Uri; Rapoport, Amnon and Yagil, Joseph. “Discount Rates Inferred From Decisions: An Experimental Study”, Management Science, 1989, 35, pp. 270-84. Bolton, Gary E. and Ockenfels, Axel. “ERC: A Theory of Equity, Reciprocity, and Competition”, American Economic Review, 2000, 90(1), pp. 166-193. Cardenas, Juan-Camilo. “How Do Groups Solve Local Commons Dilemmas? Lessons from Experimental Economics in the Field”. Environment, Development and Sustainability, 2, pp. 305-322. Carpenter, Jeffrey and Seki, Erika. “Do Social Preferences Increase Productivity? Field Experimental Evidence from Fishermen in Toyama Bay”, forthcoming, Economic Inquiry. 25
Casari, Marco and Plott, Charles. “Decentralized Management of Common Property Resources: Experiments with a Centuries-Old Institution”, 2003, Journal of Economic Behavior and Organization, 51(2), pp. 217-247. Cavalcanti, Carina. “Recursos Comuns em Unidades de Conservacao de Uso Sustentavel: Estudo de Caso de uma APA”, 2003, Unpublished Working Paper. Cavalcanti, Carina; Schläpfer, Felix and Schmid, Bernard. “Public Participation and Willingness to Cooperate in CPR Management: A Field Experiment with Fishing Communities in Brazil”, Ecological Economics, 2010, 69, pp. 613-622. Charness, Gary, and Rabin, Matthew. “Understanding Social Preferences with Simple Tests”, Quarterly Journal of Economics, 2002, 117, pp. 817-869. Charness, Gary, and Villeval, Marie Claire. “Cooperation and Competition in Intergenerational Experiments in the Field and the Laboratory”, American Economic Review, 2009, 99(3), pp. 957-978. Croson, Rachel. “Theories of Commitment, Altruism and Reciprocity: Evidence from Linear Public Goods Games”, Economic Inquiry, 2007, 45(2), pp. 199-216. DellaVigna, Stefano; List, John and Malmendier, Ulrike. “Testing for Altruism and Social Pressure in Charitable Giving”, 2009, NBER Working Paper No. w15629.. Dufwenberg, Martin, and Kirchsteiger, Georg. “A Theory of Sequential Reciprocity“, Games and Economic Behavior, 2004, 47(2), pp. 268-298. Falk, Armin, and Fischbacher, Urs. “A Theory of Reciprocity“, Games and Economic Behavior, 2006, 54(2), pp. 293-315. Farzin, Hossein. “The Effect of the Discount Rate on Depletion of Exhaustible Resources”, Journal of Political Economy, 1984, 92(5), pp. 841-851. Feeny, David; Berkes, Fikret; McCay, Bonnie J. and Acheson, James M. “The tragedy of the commons. Twenty-Two Years Later”, Human Ecology, 1990, 18(1), pp. 1-19. Fehr, Ernst and Leibbrandt, Andreas. “Cooperativeness and Impatience in the Tragedy of the Commons, IEW Working Paper # 378, 2008. Fehr, Ernst and Schmidt, Klaus. “A Theory of Fairness, Competition and Cooperation”, Quarterly Journal of Economics, 1999, 114(3), pp. 817-68. Fehr, Ernst and Gächter, Simon. “Cooperation and Punishment”, American Economic Review, 2000, 90(4), pp. 980-994. 26
Fehr, Ernst and Gächter, Simon. “Altruistic Punishment in Humans”, Nature, 2002, 415(6868), pp. 137-140. Fischbacher, Urs; Gächter, Simon and Fehr, Ernst. “Are People Conditionally Cooperative? Evidence from a Public Goods Experiment”, Economics Letters, 2001, 71, pp. 397-404. Frederick, Shane; Loewenstein, George and O`Donoghue, Ted. “Time Discounting and Time Preference: A Critical Review”, Journal of Economic Literature, 2002, 40, pp. 351-401. Frey, Bruno and Meier, Stephan. “Social Comparison and Pro-Social Behavior: Testing Conditional Cooperation in a Field Experiment”, American Economic Review, 2004, 94(5), pp. 1717-22. Grether, David and Plott, Charles. “Economic Theory of Choice and the Preference Reversal Phenomenon”, American Economic Review, 1979, 69, pp. 623-638. Hardin, Garrett. “The Tragedy of the Commons”, Science, 1968, 162 .pp.1246-48. Hoeffler, Steve and Ariely, Dan. “Constructed Stable Preferences: A Look Into Dimensions of Experience and Their Impact on Preference Stability”, Journal of Consumer Psychology, 1999, 10(2), pp. 113-139. Kahneman, Daniel, Ritov, Iiana, Jacowitz, Karen and Grant, Paul. “Stated Willingness to Pay for Public Goods: A Psychological Perspective”, Psychological Science, 1993, 4, pp. 310-15. Kahneman, Daniel. “Comment on Plott`s Rational Individual Behavior in Markets and Social Choice Processes: The Discovered Preference Hypothesis”, in Arrow, Colombatto, Perleman, Schmidt, eds., Rational Foundations of Economic Behavior, 1996, London: Macmillan and St. Martins, pp. 251-254. Kandori, Michihiro. “Social Norms and Community Enforcement”, Review of Economic Studies, 1992, 59(1), pp. 63-80. Karlan, Dean. “Using Experimental Economics to Measure Social Capital and Predict Financial Decisions”, American Economic Review, 2005, 95(5), pp. 1688-99. Keser, Claudia and van Winden, Frans. “Conditional Cooperation and Voluntary Contributions to Public Goods”, Scandinavian Journal of Economics, 2002, 102(1), pp. 23-39.
27
Landry, Craig; Lange Andreas; List, John; Price, Michael and Rupp, Nicholas. “Toward an Understanding of the Economics of Charity: Evidence from a Field Experiment”, Quarterly Journal of Economics, 2006, 121(2), pp. 747-782. Laury, Susan K. and Taylor, Laura O. “Altruism spillovers: Are behaviors in context-free experiments predictive of altruism toward a naturally occurring public good?”, Journal of Economic Behavior and Organization, 2008, 65, pp. 9-29. Ledyard, John. “Public Goods: A Survey of Experimental Research” in John H. Kagel and Alvin E. Roth, eds., Handbook of experimental economics. Princeton: Princeton University Press, 1995, pp. 111-94. List, John. “The Nature and Extent of Discrimination in the Marketplace: Evidence from the Field”, Quarterly Journal of Economics, 2004a, 119(1), pp. 49-89. List, John. “Young, Selfish, and Male: Field Evidence of Social Preferences”, Economic Journal, 2004b, 114(492), pp. 121-149. List, John. “The Behavioralist Meets the Market: Measuring Social Preferences and Reputation Effects in Actual Transactions”, Journal of Political Economy, 2006, 114(51), pp. 1-37. Loewenstein, George, and Issacharoff, Samuel. “Source Dependence in the Valuation of Objects”, Journal of Behavioral Decision Making, 1994, 7, pp. 157-68. Mas, Alexandre and Moretti, Enrico. “Peers at Work”, American Economic Review, 2009, 99(1), pp. 112-145. Ostrom, Elinor; Burger, Joanna; Field, Christopher B.; Norgaard, Richard B. and Policansky, David. “Revisting the Commons: Local Lessons, Global Challenges”, Science, 1999, 284, pp. 278-82. Ostrom, Elinor and Nagendra, Harini. “Insights on linking forests, trees, and people from the air, on the ground, and in the laboratory”, 2006, Proceedings of the National Academy of Sciences, 103(51), pp. 19221-19223. Ostrom, Elinor; Walker, James and Gardner, Roy. “Covenants with and without a sword: self-governance is possible”, American Political Science Review, 1992, 86, pp. 404417. Plott, Charles and Grether, David. “Economic Theory of Choice and the Preference Reversal Phenomenon”, American Economic Review, 1979, 62, pp. 623-638.
28
Plott, Charles. “Rational Individual Behavior in Markets and Social Choice Processes: The Discovered Preference Hypothesis”, in Arrow, Colombatto, Perleman, Schmidt, eds., Rational Foundations of Economic Behavior, 1996, London: Macmillan and St. Martins, pp. 225-250. Rabin, Matthew. “Incorporating Fairness into Game Theory and Economics”, American Economic Review, December 1993, 83(5), pp. 1281-1302. Schkade, David, and Payne, John. “How People Respond to Contingent Valuation Questions: A Verbal Protocol Analysis of Willingness to Pay for Environmental Regulation”, Journal of Environmental Economics and Management, 1994, 26, pp. 88-109. Shang, Jen and Croson, Rachel. “A Field Experiment in Charitable Contributions: The Impact of Social Information on the Voluntary Provision of Public Goods”, Economic Journal, 2008, 119(540), pp. 1422-1439. Sneath, David. “State policy and pasture degradation in Inner Asia”, Science, 1998, 281, pp.1147-48. Segal, Uzi and Segal, Joel. “Tit for tat: Foundations of preferences for reciprocity in strategic settings”, Journal of Economic Theory, 2007, 136, pp. 197-216. Sobel, Joel. “Interdependent Preferences and Reciprocity”, Journal of Economic Literature, 2005, XLIII, pp. 392-436. Slovic, Paul. “The Construction of Preferences”, American Psychologist, 1995, 50, pp. 364371. Thaler, Richard and Benartzi, Shlomo. “Save More Tomorrow (TM): Using Behavioral Economics to Increase Employee Saving”, Journal of Political Economy, 2004, 112(1), pp. 164-187. Tversky, Amos and Thaler, Richard. “Anomalies: Preference Reversals”, Journal of Economic Perspectives, 1990, 4(2), pp. 201-211. Walker, James and Gardner, Roy, and Ostrom, Elinor. “Rent Dissipation in a Limited Access Common-Pool Resource: Experimental Evidence”, Journal of Environmental Economics and Management, 1990, 19, pp. 203-211.
29
TABLES
Table 1―Determinants of Size of Holes in Shrimp Traps (OLS)
Dependent Variable Model Contribution in PGE (in MUs) Impatience (Praline Dummy)
1
Average Size of Holes in Shrimp Trap in cm 2 3 4
0.0105** (0.0041)
Belief in PGE Preference for Praline Age Gender (Male Dummy) Family Size Centrality Years of Schooling Years in Occupation Field Belief Field Perception Daily Hours Fishing Quantity of Shrimp Traps Income Constant Village Fixed Effects? Observations R2
0.4122*** (0.0174) no 114 0.064
5
0.0094** (0.0038)
0.0103** 0.0088** (0.0041) (0.0040) –0.0504** –0.0539** –0.0467** (0.0230) (0.0238) (0.0217) –0.0011 0.0003 –0.0001 (0.0051) (0.0055) (0.0053) –0.1962 –0.1593 (0.1425) (0.1228) –0.0011 –0.0003 –0.0009 (0.0011) (0.0012) (0.0012) 0.0893*** 0.0663*** 0.0515 (0.0232) (0.0232) (0.0332) 0.0121** 0.0137** 0.0109* (0.0056) (0.0062) (0.0058) –0.0001 –0.0003 –0.0005 (0.0003) (0.0004) (0.0004) –0.0034 –0.0026 –0.0004 (0.0039) (0.0046) (0.0045) –0.0008 –0.0024** –0.0022** (0.0010) (0.0011) (0.0011) 0.0195 0.0437** 0.0490** (0.0195) (0.0203) (0.0206) –0.0140 –0.0286** –0.0229* (0.0120) (0.0134) (0.0137) 0.0050 0.0091 0.0039 (0.0065) (0.0060) (0.0062) –0.0001** –0.0001* –0.0000 (0.0000) (0.0000) (0.0000) –0.0000 –0.0001* –0.0001 (0.0000) (0.0000) (0.0000) 0.4061*** 0.3115*** 0.4432** 0.4435** (0.0164) (0.0850) (0.1700) (0.1705) no no no yes 83 112 83 83 0.051
0.272
0.400
0.484
Notes: *** 99-percent significance, ** 95-percent significance; * 90-percent significance. Robust Standard Errors in Parentheses.
30
Table 2―Determinants of Mesh Size of Fishnet (OLS)
Dependent Variable Model Contribution in First Period of PGE (in MUs) Impatience (Mineral Water Dummy) Age Gender (Male Dummy) Family Size Years of Schooling Years in Occupation Field Belief Field Perception Belief in first Period of PGE Weekly Hours Fishing Constant Village Fixed Effects? Observations R2
Frequently Used Mesh Size of Fishnet in cm 1 2 0.133*** (0.049) –0.366** (0.184) -0.000 (0.013) 0.732* (0.374) 0.023 (0.037) –0.010 (0.033) 0.007 (0.010) 0.182** (0.073) 0.156*** (0.056) 0.009 (0.059) –0.006 (0.006) 2.784*** (0.664) yes 121
0.171* (0.095) –0.641* (0.345)
0.334
0.227
0.503** (0.244) 0.352** (0.132) -0.144 (0.141)
2.023** (0.985) no 35
Notes: *** 99-percent significance, ** 95-percent significance; * 90-percent significance. Robust Standard Errors in Parentheses.
31
FIGURES
0
5
10
Percentage
15
20
Figure 1: Size of Holes in Shrimp Traps (Hole Size)
.2
.3
.4
.5
.6
.7
.8
Average Size in Centimeters Note: data is categorized into small groups for illustrative reasons
.46 .44 .42 .4
Average Hole Size (cm)
.48
.5
Figure 2: Other-regarding Preferences and Hole Size
Low
Medium Level of Contribution in Public Goods Experiment
High
32
Appendix
APPENDIX TABLES Table A―Summary Table of Variables used in Estimation
Mean size of holes in shrimp traps in centimeters 0 (lowest) -10 (highest)
0.45
Standard Deviation 0.11
3.63
2.69
114
0 = prefers two pralines immediately, 1 = prefers three pralines approximately two hours later Belief about group members‟ contribution level; 0 (lowest) -10 (highest)
0.39
0.49
83
3.77
2.47
114
Preference for Praline
0=does not like praline, 1= likes praline
0.98
0.15
83
Age
Age in years
37.43
13.02
114
Gender
Male dummy; 1=female, 2=male
1.74
0.44
114
Family Size
Number of children
3.31
3.01
113
Centrality
Number of people living in close surrounding, i.e, in two minutes walking distance
25.20
28.72
114
Education
Years of schooling
3.42
2.55
113
Years in Occupation
Years fishing professionally
17.44
11.24
114
Field Belief
Belief about the fraction of the other fishermen‟s shrimp catch that is below two centimeters. 0=zero, 1=very low, 2=low, 3=medium, 4=large
3.19
0.94
114
Field Perception
Perception about necessity to introduce an environmental program which aims at limiting the use of PET bottles with small holes. 0=not necessary, 1=probably necessary, 2=necessary, 3=absolutely necessary
2.54
0.53
114
Daily Hours Fishing Quantity of Shrimp Traps
Average daily work time not including the time for preparing and selling the shrimp Number of PET bottles in possession
3.69
1.57
114
335.69
296.67
114
Income
Monthly income from all activities (fishing, agriculture, and other sources of income)
Variable Name Hole Size Contribution in PGE (in MUs) Impatience (Praline Dummy) Belief in PGE
Explanation
Mean
302.38
260.04
N 114
114
Appendix
Table B―Determinants of Laboratory Behavior (OLS, Probit)
Dependent Variable Model Impatience Dummy (Praline) Belief in PGE
Cooperation in Public Good Experiment (OLS) 1
Gender (Male Dummy) Family Size Centrality Years of Schooling Years in Occupation Field Belief Field Perception Daily Hours Fishing Income Observations 2
R
2
-0.019 (0.032) 0.245 (0.427) -0.085 (0.097) -0.011 (0.007) 0.048 (0.115) 0.045* (0.025) -0.428 (0.437) -0.221 (0.279) -0.227 (0.139) 0.002** (0.001) 112
0.240 (0.384) -0.003 (0.008) 0.023 (0.146) -0.010 (0.035) 0.002 (0.002) -0.023 (0.025) -0.002 (0.007) 0.032 (0.107) 0.065 (0.073) -0.005 (0.037) 0.000 (0.000) 83
0.400 2
Pseudo R
Cooperation in Public Good Experiment (OLS) 3 -0.386 (0.587)
83
Cooperation in Public Good Experiment (OLS) 4 -0.583 (0.530) 0.560*** (0.111) 0.332 (1.358) -0.013 (0.044) 0.020 (0.616) -0.142 (0.156) -0.010 (0.006) 0.105 (0.147) 0.065** (0.028) -0.400 (0.559) -0.187 (0.289) -0.329** (0.161) 0.002* (0.001) 83
0.005
0.381
0.619*** (0.099)
Preference for Praline Age
Patience (Probit)
0.052
Notes: *** 99-percent significance, ** 95-percent significance; * 90-percent significance. Robust Standard Errors in Parentheses.
Appendix
APPENDIX FIGURES Figure A: Shrimp Trap made from a PET bottle
Note: Shrimp enter through big hole in front and can only escape through small holes at the bottom of the bottle.
Figure B: One Fisherman's Fishnet
Appendix
Figure C: Measuring the Fishnet Mesh Size
7
Figure D: Fishnet Mesh Size in Survey & Field Observations
5
3
4
4
2
2
3
5 3
Note: numbers in circles indicate observations
2
Mesh Size (cm) 2006 Survey
6
3
3
4
5
6
Mesh Size (cm) 2008 Field Observation
7
Appendix
0
5
10
Percentage 15 20
25
30
Figure E: Used Fishnet Mesh Sizes
2
2.5
3 3.5 4 4.5 5 5.5 Mesh Size in Centimeters
6
6.5
Appendix
Appendix – Instructions
Time Preference Experiment Before we start, here are two pralines. Please take a look at them. Do you like these pralines? Do you want these two pralines now or would you prefer waiting until the end of today‟s meeting and receiving three pralines instead of two?
Public Goods Experiment The outcome in this game depends on your decisions and the decisions of two others in this meeting. Note that you will never know who these two others are and these two others will never know that they played with you. You and the two others will have to make the same type of decision. Here are two envelopes. In one envelope, which we denote as your private envelope, are 10 points. These points are yours. The other, which is denoted the group envelope, is empty. You decide how many of the 10 points you transfer to the group envelope. What happens if you transfer points to the group envelope? First, of course, you will have fewer points in your private envelope. Second, for every point you transfer to the group envelope, we will add 0.5 points. Thus, if you transfer (for example) 10 points, we will add 5 points and there will be 15 points in the group envelope. If you transfer nothing, we will not add points to the group envelope. What happens to the points in the group envelope? They will be equally distributed among all participants in your group including you. So, if there are 15 points in the group envelope, you and the other two in your group get 5 points. You do not know how many points the others transfer to the group envelope. The other two participants in your group will also have to decide how many points they transfer to the group envelope before knowing the decisions of their group members. Let me give you an example. Imagine all three participants (including you) decide to transfer no points to the group envelope. Thus, there are no points in the group envelopes and all three participants stay with their 10 points in their private envelope. Imagine now all three
Appendix
participants including you decide to transfer all 10 points to the group account, i.e., there are 30+0.5x30=45 points in the group envelopes. We will then divide the 45 points equally and each of you will receive 15 points. One last example: Imagine participant 1 gives 10 points to the group envelope, participant 2 gives 0 points to the group envelope und you give 5 points to the group envelope. We will then add 0.5 points for each point in the group envelopes, i.e. there are (10+0+5)×1.5=22.5 points. Then we divide these points equally among the three participants so that all get 7.5 points in addition to the points they kept in their private envelopes. So, participant 1 gets 0+7.5=7.5 points, participant 2 10+7.5=17.5 points and you 5+7.5=12.5 points. Note that participant 2 received more points than you and participant 1 because he did not transfer any point to the group envelope. In contrast, participant 1 received less because he transferred all 10 points to the group envelope. Do you understand? While you make your decision, I will turn my back. Please do not tell me what you plan to do. Please decide now and transfer the amount of points you want from this envelope to the other and then put the two envelopes in the box in front of you. Tell me when you are ready!