Predicting Information Seeker Satisfaction in Community Question Answering Yandong Liu
Jiang Bian
Emory University
Georgia Institute of Technology
Emory University
[email protected]
[email protected]
[email protected]
ABSTRACT
general-purpose web search engines, information seekers now have an option to post their questions (often complex and specific) on Community QA sites such as Naver or Yahoo! Answers, and have their questions answered by other users. These sites are growing rapidly. Hundreds of millions of answers have already been posted for millions of questions in just two years since Yahoo! Answers appeared. The site continues to grow rapidly. Understanding the reason for the growth, the characteristics of the information needs that are met by such communities, and the benefits and drawbacks of community QA over other means of finding information, are all crucial questions for understanding this phenomenon. We pose one such fundamental question: can we predict if an asker in CQA will be satisfied with the answers proposed to her by the community? Our goal is to begin to unravel the many factors that go into success of a CQA portal, and ultimately to apply our insights to better design of social media applications. In particular, community question answering allows us to directly study search satisfaction from the information seeker perspective. This is in contrast to the more traditional relevance-based assessment that is often done by judges different from the original information seeker, which may result in ratings that do not agree with the target user. While the idea of relevance being inherently subjective has been pointed out in the past (e.g., see references [29] and more recently [21]), nowhere does the problem of subjective relevance arise more prominently than within Community QA, where many of the questions are inherently subjective, complex, ill-formed, or often all of the above. The problem of complex and subjective QA has only recently started to be addressed in the question answering community, most recently as the first opinion QA track in TREC [7]. We review related work in more detail in Section 6, but in short, as far as we know, ours is the first large-scale study of real user satisfaction in complex and subjective information seeking. In addition to studying asker satisfaction as a vehicle to expand our understanding of information seeking, there are significant practical benefits to predict satisfaction in CQA. Potential applications include user intent inference, answer ranking, and query suggestion and routing. For example, we could notify the information seeker when an appropriate answer has been posted (which we call the “offline” setting), or predicting at the time of posting whether the asker is likely to get a satisfactory answer to this question (the “online” setting). As we will show, human assessors have a difficult time predicting asker satisfaction, thereby requiring novel prediction techniques and evaluation methodology that we begin to develop in this paper. More specifically, our contributions include:
Question answering communities such as Naver and Yahoo! Answers have emerged as popular, and often effective, means of information seeking on the web. By posting questions for other participants to answer, information seekers can obtain specific answers to their questions. Users of popular portals such as Yahoo! Answers already have submitted millions of questions and received hundreds of millions of answers from other participants. However, it may also take hours –and sometime days– until a satisfactory answer is posted. In this paper we introduce the problem of predicting information seeker satisfaction in collaborative question answering communities, where we attempt to predict whether a question author will be satisfied with the answers submitted by the community participants. We present a general prediction model, and develop a variety of content, structure, and community-focused features for this task. Our experimental results, obtained from a largescale evaluation over thousands of real questions and user ratings, demonstrate the feasibility of modeling and predicting asker satisfaction. We complement our results with a thorough investigation of the interactions and information seeking patterns in question answering communities that correlate with information seeker satisfaction. Our models and predictions could be useful for a variety of applications such as user intent inference, answer ranking, interface design, and query suggestion and routing.
Categories and Subject Descriptors H.3.3 [I]: NFORMATION STORAGE AND RETRIEVAL H.3.3: Information Search and Retrieval: Search process; H.3.5: Online Information Services: Web-based services
General Terms Algorithms; Design; Experimentation; Evaluation
Keywords Community question answering; information seeker satisfaction.
1.
Eugene Agichtein
INTRODUCTION
Community Question Answering (CQA) has recently become a viable method for seeking information online. In addition to using
Permission to make digital or hard copies of all or part of this work for personal or classroom use is granted without fee provided that copies are not made or distributed for profit or commercial advantage and that copies bear this notice and the full citation on the first page. To copy otherwise, to republish, to post on servers or to redistribute to lists, requires prior specific permission and/or a fee. SIGIR’08, July 20–24, 2008, Singapore. Copyright 2008 ACM 978-1-60558-164-4/08/07 ...$5.00.
• Introduction of the problem of predicting asker satisfaction in QA communities (Section 2). • Flexible prediction framework that can work in both offline and online settings (Section 3).
483
• Thorough evaluation of both automatic and manual asker satisfaction predictions over thousands of real users’ questions (Section 5).
vide unprecedented opportunity to study feedback from the asker herself. Furthermore, asker satisfaction plays crucial role in the growth or decay of a question answering community. If many of the askers in CQA are not satisfied with their experience, they will not post new questions and will rely on other means of finding information. Furthermore, by modeling asker satisfaction, we could provide better ranking of questions, or notify an asker if they are likely to be satisfied with the answers to their questions. Hence, predicting, understanding and monitoring asker satisfaction is at the core of maintaining an active and healthy QA community. It is important to note the differences of our task from traditional question answering and ad-hoc information retrieval: we want to predict what is essentially a subjective notion of satisfaction, which requires to model the intent of the asker, the expectation of what comprises a satisfying answer, and to some extent providing a “recommendation” to the asker on the expected satisfaction with the answers. Furthermore, the information needs of askers in CQA are typically more complex and subjective compared to the traditional TREC benchmarks. Often, the intent of the asker is not obvious to either annotator or community participants, as we explore in Section 5. In summary, we believe that asker satisfaction, as studied in the context of CQA, can provide both new insights into information seeking behavior and spur the development of new techniques for user modeling and information finding.
• Result analysis indicating which features and methods are most effective for predicting asker satisfaction (Section 5). We now introduce the asker satisfaction problem in more detail.
2.
THE ASKER SATISFACTION PROBLEM
First we review the life of a question in a QA community. Then we frame the general problem and provide conceptual and empirical motivation for studying asker satisfaction (Section 2.2). Finally, we formally state the asker satisfaction problem (Section 2.3).
2.1
Lifecycle of a Question in Community QA
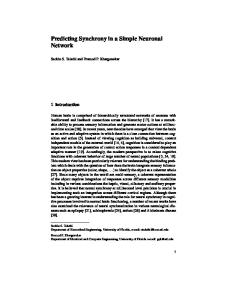
The process of posting and obtaining answers to a question in CQA is outlined in Figure 1. A user posts a question by selecting a category, and then enters the question subject (title) and, optionally, detail (description). For conciseness, we will refer to this user as the asker for the context of the question, even though the same user is likely to also answer other questions or participate in other roles for other questions. Note that to prevent abuse, the community rules typically forbid the asker from answering own questions or vote on answers. After a short delay (which may include checking for abuse, and other processing) the question appears in the respective category list of open questions, normally listed from the most recent down. At the point, other users can answer the question, vote on other users’ answers, or comment on the question (e.g., to ask for clarification or provide other, non-answer feedback), or provide various meta-data for the question (e.g., give questions stars for quality). Depending on the site, many more interactions may be available. Over the lifetime of an open question the asker may be notified of the answers as they are submitted, or may check the collected answers periodically. If the asker is satisfied with any of the answers, she can choose it as best, and provide feedback ranging from assigning stars or rating for the best answer, and possibly textual feedback. At that point, the question is considered as closed by the asker, and no new answers are accepted. We believe that in such cases, the asker is likely satisfied with at least one of the responses, usually the one she chooses as the best answer. But in many cases the asker never closes the answer personally, and instead, after some fixed period of time, the question is closed automatically. In this case, the “best” answer may be chosen by the voters, or by some other means (e.g., by automatically predicting answer quality following references [12] or [2]). So, while it is possible that the best answer chosen automatically is of high quality, it is unknown if the asker’s information need was satisfied. There may be many reasons why the asker never closed a question by choosing a best answer. Based on our exploration we believe that the main reasons are either a) user loses interest in the information and b) none of the answers are satisfactory. In both cases, the QA community has “failed” to provide satisfactory answers in a timely manner and “lost” the asker’s interest. While the true reasons are not known, for simplicity, to contrast with the “satisfied” outcome above, we consider this outcome to be “unsatisfied”.
2.2
2.3
Problem Statement
We now state more formally what we mean by asker satisfaction: D EFINITION 1. An asker in a QA community is considered satisfied iff: the asker personally has closed the question, selected the best answer, and provided a rating of at least 3 “stars” for the best answer quality. Otherwise, we define the asker to be unsatisfied. We believe that this definition captures key aspects of asker satisfaction, namely that we can reliably identify when asker is satisfied but not the converse. Similarly, we do not attempt yet to analyze the distinction between possibly satisfied and completely unsatisfied, or otherwise dissect the case where the asker is not satisfied. We can now state our problem more formally: The Asker Satisfaction Problem: Given a question submitted by an asker in CQA, predict whether the user will be satisfied with the answers contributed by the community.
There are two important special cases of this problem: the offline setting, where the posted question has already obtained some answers; and the online setting, where we attempt to predict immediately whether a user will be satisfied with the answers at some intermediate point in the process (e.g., while answers are still arriving), or even before any answers arrive. We will attempt to solve the general version of this problem by adapting machine learning techniques, and, as our results in Section 5 show, our techniques are feasible for both the offline and online variants of the problem.
3.
PREDICTING ASKER SATISFACTION
We now introduce our Asker Satisfaction Prediction system (ASP) that learns to classify whether the question asker is satisfied with the obtained answers. We use a standard classification framework for this task. Given a question thread posted by an asker, we derive features to represent the associated information (e.g., question text, text of the answers, user feedback) to predict whether the asker would be satisfied. Naturally, the features used are crucial (which
Intuition and Motivation
The problem of whether an asker in QA community is satisfied is a special instance of the general problem of predicting if an information need of a searcher is satisfied. Question Answering communities are both an important application by itself, and also pro-
484
Figure 1: A simplified lifecycle of a question in a typical CQA site we describe next). We then briefly describe the specific classification algorithms used for the experiments of Sections 5.
3.1
Textual Features: Additionally, we derive word n-gram (unigram and bigram) features from the text of the question, and the text of the answers (separate features spaces are used to represent the question and answer terms). As a simple feature selection method, only the most frequent 1000 features are included.
Features
Our features are organized around the basic entities in a question answering community: questions, answers, question-answer pairs, users, and categories. We now review the features we used to represent our problem. The complete list is reported in Table 1.
3.2
Classification Algorithms
We explored three families of classification algorithms: Support Vector Machines (SVM), Decision trees, Boosting and Naive Bayes, all using the implementations in the Weka [28] framework.
Question: This group includes traditional question answering features such as the words and 2-word phrases in the question, the wh-type (e.g., “what” or “where”), and the length of the subject (title) and detail (description) of the question. As a more specific feature to communities we also include posting time, as well as any user feedback received for the question (e.g., “stars” in Yahoo! Answers community).
Decision Trees: We use two implementations of the decision tree [19]: C4.5 and RandomForest. A benefit of decision tree is interpretability of the models and results. By using a decision tree classifier, we expect to get high precision on the target class, with the potential drawback of overfitting. To account for this, we use random forests as well as feature selection.
Question-Answer Relationship: This group describes the relationship between the question and the answer. We include standard features such as overlap between question and answer, answer length, and number of candidate answers. We also use specialized features such as the number of positive votes (“thumbs up” in Yahoo! Answers), negative votes (“thumbs down”), and various vote-related statistics such as the maximum of positive or negative votes received for any one answer (e.g., to detect cases of brilliant/popular answers or, conversely, blatant abuse).
SVM: Support vector machines are considered the classifier of choice for many tasks, due to robustness in the presence of noise, and high reported accuracy. Specifically, we use the Weka implementation of SMO [18] Boosting: Additionally, we use meta-learning as an alternative to SVM for the noisy features (and labels) in our domain. AdaBoost [10] has been shown quite effective for many text-classification applications, and we apply the Weka implementation of AdaBoost.
Asker User History: This group is unique to question answering communities, and particularly important for our task. Since user satisfaction is, to a large extent, subjective, we posit that it relies largely on past user activity history – in particular, how the asker was satisfied with responses to previous questions. Care was taken not to “cheat” – only information available about the asker prior to posting the question was used.
Naive Bayes: Last, we use Naive Bayes classifier, which is a very simple and fast, yet often surprisingly effective method to quickly investigate the success of our approach. The methods above are representative of the state-of-the-art in classification, so we expect the experimental results described in Section 5 to be generalizable to other variants of classification algorithms.
Answerer User History: Similarly to the Asker User History, we develop features to describe the history of the users providing the answers, such as the number of questions resolved, number of answers provided, and number of answers rated as best. Since a question may draw multiple answers, we include three “surrogate” answerer features: the average of the answerer history, the features for the answerer with the highest CQA reputation score, and the answerer that attracted the most positive votes for this question.
4. EXPERIMENTAL SETUP We now describe the metrics used for the evaluation, the datasets, and methods compared in the experimental results of Section 5.
4.1
Category Features: We hypothesized that user behavior (and asker satisfaction) varies by topical question category, as recently shown in reference [2]. Therefore we model the prior of asker satisfaction for the category, such as the average asker rating (satisfaction) with answers contributed to all previous questions in the category.
Evaluation Metrics
Even though ours is formally a two-class classification problem, we primarily focus on the satisfied or positive class. The reason for this is that we have higher certainty about the true positive likelihood of our satisfied labels compared to the unsatisfied – more properly to be stated as unknown cases. Specifically, we measure
485
Feature (72 total) Question (from 32 total) Q: Subject length Q: Posting time Q: Number of answers Q: Question stars Q: Wh-type Q: Number of comments Q: Total positive/negative votes Q: Average of positive/negative votes Q: Max positive/negative votes Q: Most_vote answer positive/negative votes Q: QA Overlap Q: Average past rating Q: Most recent rating Q: Question KL-Divergence features Q: Question visual quality features Question-Answer Relationship (from 9 total) QA: Most_vote answer content length QA: Most_vote answer’s time difference QA: Top ten answers KL-Divergence features QA: Top ten answers visual quality features Asker User History (4 total) UH: Questions resolved UH: Total answers received UH: Member since UH: Answer/Question ratio Answerer User History (from 21 total) AH: Total points received AH: Questions resolved AH: Total answers received AH: Best answers received AH: Member since AH: Best answer ratio AH: Answer question ratio Category Features (6 total) CA: Average time to close a question CA: Average answers per question CA: Average asker rating CA: Average voter rating CA: Average number of questions per hour CA: Average number of answers per hour
Description
Available at Question Time?
Number of words in question subject Time(in hours) of the day when the question was posted Number of answers received for this question Number of stars received earned for this question Wh-word introducing the question title (e.g., “what”, “where”, etc.) Number of comments added by other participants Total number of positive/negative votes for the answers Average number of positive/negative votes for each answer Max number of position/negative votes among all the answers Number of positive/negative votes for the answer which received most votes Words shared between question and the answer which received most votes Average rating given when closing questions in the past Most recent rating given for last question Question subject/content KL-Divergence values with Wikipedia/TREC/Y! Categories Question subject/content puctuation/typo/space density
yes yes no no yes no no no no no no yes yes yes yes
Number of words of the content from the answer which received most votes The time difference between the question and the answer which received most votes Top ten answers content KL-Divergence values with Wikipedia/TREC/Y! Categories Top ten answers content puctuation/typo/space density
no no no no
Number of questions resolved in the past Number of all answers this user received in the past How long since last registration Ratio of Answers to Questions posted
yes yes yes yes
Total points received from all the anwerers/max answerer/most_vote answerer Number of questions resolved from all the anwerers/max answerer/most_vote answerer Number of total answers received from all the anwerers/max answerer/most_vote answerer Number of best answerers received from all the anwerers/max answerer/most_vote answerer How long since last registration from the all anwerers/max answerer/most_vote answerer Ratio of best answers over all answers from all the anwerers/max answerer/most_vote answerer Ratio of answers over questions from all the anwerers/max answerer/most_vote answerer
no no no no no no no
Average interval between opening and closing for that category Average number of answers per question for that category Average rating given by asker for an answer from that category Average votes given by voters for an answer from that category Average number of questions per hours from that category Average number of answers per hours from that category
yes yes yes yes yes yes
Table 1: Sample Features: Question (Q), Question-Answer Relationship (QA), Asker User History (UH), Answerer User History(AH), and Category (CA). Textual features are not listed. Rater Group Experts Mechanical Turk Workers
the Precision, Recall, and F1 for the satisfied class, and, where appropriate, the overall Accuracy for both classes. • Precision: the fraction of the predicted satisfied asker information needs that were indeed rated satisfactory by the asker.
Agreement 0.82 0.9
Table 2: Ratings for 130 questions (54 satisfied/76 unsatisfied)
• Recall: the fraction of all rated satisfied questions that were correctly identified by the system.
bother to choose the best answer, indicating a degree of dissatisfaction that we plan to quantify in future work. For this study, however, we simply consider the asker ratings as the “truth”, interpreted as defined in Section 2.3. To complement the asker ratings we also obtained human judgements from Amazon’s paid rater service, the Mechanical Turk 1 . The raters are provided a “HIT” (Human Intelligence Task), and for a small fee the workers submit their responses. For our task we obtained five independent ratings for each question, and used a majority to identify and resolve ambiguous cases. In total, 130 questions were manually rated by Mechanical Turk workers. Finally, we obtained a number of “expert” ratings – provided by researchers to calibrate the asker satisfaction and the Mechanical Turk (henceforth, MTurk) ratings. Interestingly, as we will show in Section 5, MTurk ratings have higher correlation with the asker satisfaction than the (more strict) expert ratings. The rated dataset is summarized in Table 2.
• F1: the geometric mean of Precision and Recall measures, R computed as P2P+R . • Accuracy: the overall fraction of instances classified correctly into the proper class. Often, accuracy is not the right metric when the class distribution is skewed; however, for completeness, we will also report Accuracy in some of our experiments. In the experiments that follow we will primarily focus on predicting the satisfied class, hence we will rely more on the Precision, Recall, and F1 rather than the overall Accuracy.
4.2
Redundancy 3 5
Human Judgements
Our problem is inherently subjective. Hence, as the gold standard we use the asker rating for the best answer (if chosen) as a measure of satisfaction. Note that in many cases askers do not even
1
486
http://www.mturk.com/mturk/welcome
Rater group Expert (strict) Casual (majority=3/5) Casual (majority=4/5) Casual (majority=5/5)
4.3 Datasets Our data is based on a snapshot of Yahoo! Answers (http: //answers.yahoo.com), a popular CQA site, crawled in the early 2008. The initial broad categories to start the crawl were “Health”, “Education & Reference”, “Sports”, ”Science and Mathematics” and the “Arts”. The resulting snapshot is our universe of 216,170 questions, listed in Table 3. Questions 216,170
Answers 1,963,615
Askers 158,515
Categories 100
Satisfied (%) 50.7
F1 0.47 0.60 0.61 0.53
Accuracy 0.45 0.47 0.48 0.46
• Heuristic: Intuitively, if a question receives many answers, at least one of them should be satisfactory. Therefore, our heuristic baseline predicts the label satisfied if a question received many answers. The exact threshold on the number of answers is set using a decision tree (C4.5 in our experiments).
In order to focus on a realistic asker satisfaction prediction task (that is, reflective of the current state of Yahoo! Answers), we selected a random subset of 5,000 questions from the most recent 10,000 questions in the snapshot above. We will use this sample of 5,000 questions for all of the experiments. To allow other researchers to replicate our results, all the datasets used in this paper are available online 2 . The details of our dataset are reported in Table 4. The total of 90 categories are represented, and we report detailed statistics for the top 10 most frequent categories. As we can see, questions in these categories comprise almost 51% of all questions in the dataset (this skewed distribution is representative of our complete crawl snapshot). In particular, the Mathematics category is the most popular, containing 13% of the questions and drawing on 3.6 answers for each question on average. Interestingly, Chemistry, while also a popular category, draws only about 2 answers per question, while Football (American) attracts more than 11 answers for each question. The asker satisfaction varies widely with the category. While more than 70% of askers are satisfied with the answers provided in the Mental Health category, only 34% are satisfied with the answers contributed for Biology questions, and similar low satisfaction holds for other sciences. Not surprisingly, questions that are closed by the asker are usually closed within a day (and often within 1 hour). Also, when the asker closes the question personally, the asker rating is usually high, averaging 4.3 “stars” out of 5 possible, with low variance across categories. However, when a question is closed by community voters, the average number of votes awarded to the best answer varies widely by category. For example, Voters in the Chemistry category on average award only 1.2 votes to the best answer (despite the high popularity of the Chemistry category). In contrast, voters in the Diet & Fitness category on average award about 4.5 votes to the best answer, which indicates higher overall satisfaction of the community with the contributed answers. In summary, asker satisfaction and other statistics of the questions vary widely by the topical category, and the corresponding user community, supporting our decision to develop a number of category-normalized features (Section 3).
• Baseline: Random baseline, that simply predicts the majority class (which is usually satisfied). • ASP_SVM: Our system implementation using the SVM classifier (Section 3.2). • ASP_RandomForest: Our system implementing a decision tree classifier using the random forest. • ASP_C4.5: Our system implementing a decision tree using the C4.5 algorithm (Section 3.2). • ASP_Boosting: Our system implementing the AdaBoost algorithm combining weak learners (Section 3.2). • ASP_NB: Our system implementing the Naive Bayes classifier (Section 3.2). We now turn to the experimental evaluation of the asker satisfaction prediction methods.
5.
EXPERIMENTAL RESULTS
First, we present some intuitions into the problem itself. In Section 5.1 we report the main classification results of the paper, which we subsequently will study in depth in the remainder of the section. In particular, we show that our ASP system is able to take advantage of the context (i.e., asker user history) to make better predictions than human raters. We conclude this section with feature analysis and analysis of the results (Section 5.2). Before we present our experiments, it is important to understand the difficulty of the problem of predicting asker satisfaction (Table 5). For example, the ratings of expert judges at best had weak correlation with asker satisfaction, and with the most favorable thresholding only achieved the precision of 0.36 and recall of 0.68 when trying to predict satisfaction. Similarly, Mechanical Turk workers (whom we call “casual labelers”), had better success with precision of 0.44 and recall of 1 (i.e., they were overly optimistic about satisfaction). Interestingly, the best precision and recall were achieved not where all the raters agreed, but rather when at least 4 out of 5 raters predicted asker satisfaction. Based on these results, we will use the Mechanical Turk ratings as the strongest manual baseline, using the majority threshold of 4 for all subsequent experiments.
Methods compared
We now describe the baselines and our specific methods for predicting asker satisfaction. Note that the “truth” ratings are provided by the asker and hence are difficult to predict even for human raters. The predictions we compare include: • Human: As the human raters we report the prediction of Amazon’s Mechanical Turk workers: a question is predicted as satisfied if the majority of raters label the best answer as satisfactory. The specific threshold for a majority will be fixed in our calibration experiments in the next section. 2
Recall 0.68 1.0 1.0 0.75
Table 5: Comparing casual human raters (Mechanical Turk Workers) with expert raters (130 randomly sampled questions) .
Table 3: Statistics of the complete data crawled from the Yahoo! Answers site.
4.4
Precision 0.36 0.43 0.44 0.41
5.1
Predicting Asker Satisfaction
Table 6 reports prediction accuracy for the different implementations of ASP, in particular comparing the choice in classifier algorithm and feature sets (namely, whether to use the textual features, and whether to use feature selection). Surprisingly, ASP_C4.5 results in the best performance of all the classification variants, with
http://ir.mathcs.emory.edu/shared/sigir2008
487
Category Mathematics Diet & Fitness Women’s Health Chemistry Biology Books & Authors Football (American) Mental Health Physics General Health Cumulative (10 Cat.) Overall (90 Cat.)
Questions
Answers
651 450 277 236 176 161 152 151 149 135 2,538 5,000
2,329 2,436 1,824 508 589 645 1,722 1,159 428 737 12,377 25,063
Answers per Question 3.58 5.41 6.58 2.15 3.35 4.01 11.33 7.68 2.87 5.46 4.88 5.01
Freq.
Satisfied
Time to close
13.0% 9.0% 5.5% 4.7% 3.5% 3.2% 3.0% 3.0% 3.0% 2.7% 50.8% 100%
44.5% 68.4% 62.8% 37.3% 34.1% 42.2% 55.3% 70.9% 48.3% 70.4% 53.4% 50.7%
3 days 20 hours 2 days 17 hours 2 days 23 hours 4 days 7 hours 4 days 5 hours 4 days 6 hours 3 days 11 hours 2 days 16 hours 3 days 13 hours 2 days 17 hours 3 days 15 hours
Closed by Asker Asker rating Time to close 4.48 33 minutes 4.30 1.5 days 4.28 35 minutes 4.39 1 day 13 hours 4.06 28 minutes 4.35 1 day 20 hours 4.29 1 day 13 hours 4.30 1 day 13 hours 4.29 35 minutes 4.49 1 day 13 hours 4.32 4.32 1 day 12 hours
Closed by Voters Voter rating Time to close 1.76 6 days 4.46 6 days 1.98 6 days 1.19 6 days 1.33 6 days 2.13 6 days 2.05 6 days 1.32 6 days 1.48 6 days 1.31 6 days 1.90 1.87 6 days
Table 4: Selected statistics for the top 10 most popular categories in our dataset (together comprising 51% of questions in dataset). F1 on the satisfied class of 0.77 when selecting only the top 15 features, chosen by Information Gain. In contrast, the human raters only achiever the F1 of 0.61, which is in fact lower than the naive baseline that always guesses the “satisfied” class, and lower than the heuristic baseline that achieves the best F1 of 0.64. Feature Selection: The top 15 features selected are reported in Table 7. Note that all the four asker history features are included. Interestingly, the most salient feature is the previous rating by the asker (when available). We can view it as the prior on the asker which may relate to the self-selecting nature of CQA (i.e., askers who recently were successful return to submit new questions). Similarly, the amount of experience with CQA (the “member since” features) is an important factor. Another interesting result is the presence of several category features, which confirms our intuition about the importance of the category as the prior on question satisfaction independent of the asker. Also note that the reputation of the answerers submitting the responses is not as important as many other features, suggesting that authority or expertise of answer contributors is only important for some, but not all, information needs. Classifier ASP_SVM ASP_C4.5 ASP_RandomForest ASP_Boosting ASP_NB Human Baseline
With text F1 Accuracy 0.69 0.70 0.75 0.74 0.70 0.67 0.67 0.72 0.61 0.63 0.61 0.48 0.66 0.51
Without Text F1 Accuracy 0.72 0.73 0.76 0.75 0.74 0.73 0.67 0.72 0.65 0.68
set sizes in Figure 2. We report the average of three experiments, each with a randomly chosen test set of 1,000 questions, held fixed for varying amounts of training data. Our ASP system outperforms all other predictors, including human raters. In particular, 2,000 questions in training is sufficient to achieve F1 of 0.75, and additional training data is not as helpful, nevertheless improving performance of ASP to achieve F1 of 0.77, substantially outperforming all other methods. In fact, as few as 500 training questions are sufficient to achieve F1 of 0.7, which may be practical enough even for the less popular question categories.
5.2
Selected Features F1 Accuracy 0.62 0.70 0.77 0.77 0.68 0.68 0.67 0.72 0.58 0.67
On-line Off-line
Table 6: Accuracy of ASP_SVM, ASP_C4.5, ASP_RandomForest, ASP_Boosting, and ASP_NB for varying parameters (5-fold cross validation).
Precision 0.78 0.78
Recall 0.70 0.76
F1 0.74 0.77
Table 8: On-line vs. off-line prediction of satisfaction Feature Ablation: To gain a better understanding of the important features for this domain, we perform ablation study on our feature set. For this, remove each of the feature categories listed in Section 3.1. Table 9 reports the accuracy of ASP with each of the feature categories removed. Without question features or asker user history, the prediction F1 score drops drastically. In contrast, Question-Answer relationship, and answerer user history, appear to have less of an effect – or perhaps are redundant given the presence of the other feature categories. Nevertheless, it should be noted that, surprisingly, answerer reputation does not appear to be important for asker satisfaction. We conjecture that this is due to increasingly subjective nature of many questions in CQA, where the accuracy of the provided answer is less important than other, more subjective characteristics of the answer, e.g., whether the answer appears as caring or supportive for Health-related questions.
.
IG 0.14219 0.13965 0.10237 0.04878 0.04878 0.04381 0.04306 0.03274 0.03159 0.02840 0.02633 0.02080 0.02046 0.01747 0.01531
Analysis and Discussion
Online vs. Offline Prediction: Previously, we discussed results of predicting satisfaction in the off-line setting – that is, after some answers have been contributed, allowing us to exploit features such as the number of answers, answer content length, and feedback from other users (votes). We now consider a more difficult task of predicting asker satisfaction in the online setting – that is, before any answers to the question are contributed. Table 8 reports the comparison between off-line and on-line settings. As we can see, there is a noticeable degradation in accuracy (0.74 F1 online vs. 0.77 F1 off-line), nevertheless that performance is significantly higher than the various baselines – suggesting that ASP is practical even for on-line prediction.
Feature Q: Askers’ previous rating Q: Average past rating by asker UH: Member since (interval) UH: Average number of answers attracted by past questions UH: Previous questions resolved for the asker CA: Average asker rating for the category (i.e., category prior) UH: Total number of answers received CA: Average voter rating Q: Question posting time CA: Average answers per question for the category AH: Answerer with most positive votes: member since (interval) AH: The highest best answer ratio for any answerer AH: The average best answer ratio of all answerer CA: Average number of answers per hour for the category QA: KL-Divergence of the top ten answers LM from Wikipedia LM
Textual Features: We also explore which textual features are most helpful for this task, using the Information Gain metric. From Table 10, it appears that most of the textual features suggest the
Table 7: Top 15 features with Highest Information Gain (IG) We next report the precision, recall, and F1 for varying training
488
Figure 2: Precision, Recall, and F1 of ASP, Human, Baseline, and Heuristic for varying amount of training data.
Selected features No question features No question-answer features No asker features No answerer features No category features
Precision 0.80 0.68 0.76 0.72 0.76 0.75
Recall 0.73 0.72 0.74 0.69 0.75 0.76
F1 0.77 0.70 0.75 0.71 0.75 0.75
Table 9: Prediction accuracy with feature ablation. IG 0.003734 0.003335 0.003147 0.002595 0.002581 0.002543 0.002536 0.002532 0.00238 0.002342
Feature ”i don’t” in question ”i was” in question ”i have” in question ”you are” in answer ”to your” in answer ”to get” in question ”that i” in question ”and i” in question ”a few” in answer ”but i” in question
Figure 3: Satisfaction prediction accuracy for groups of askers with varying number of posted questions, and the corresponding number of questions posted by askers in each group.
cantly [23], provides a unique challenge, which recently has been addressed in references [2], [13], and [12]. Community question answering builds on the rich history in automatic question answering [25] and web question answering [5]. However, a significant difference includes the large amount of metadata available to find relevant and high-quality content [2]. Additionally, while previous work focused on how to retrieve high quality answers from the CQA content, the question of information seeker satisfaction was not explored. In contrast, we present a general prediction model to investigate the ability of a QA community to provide satisfactory answers from the asker’s perspective. Our work is related to, but distinct from interactive Question Answering [7]. In particular, we can directly study the satisfaction from information seeker perspective. Nowhere does the problem of subjective relevance arise more prominently than in community QA, where many of the questions are inherently subjective, complex, ill-formed, or all of the above. While automatic complex QA has been an active area of research, ranging from simple modification to factoid QA technique (e.g., [22]) to knowledge intensive approaches for specific domains (e.g., [8]), the technology does not yet exist to automatically answer open domain complex and subjective question. A corresponding problem is complex QA evaluation. Recent efforts at automatic evaluation show that even for well-defined, objective, complex questions, evaluation is extremely labor-intensive and has many challenges [16, 17]. The problem of subjective QA has only recently started to be addressed in the question answering community, most recently as the first opinion QA track in TREC [7]. We believe that this work can contribute to both the understanding of complex QA satisfaction, and explores important evaluation issues in a new setting. To our knowledge, this paper is the first large-scale study of real user satisfaction with obtaining information for complex and/or subjective information needs. There is a rich tradition of relevance-based assessment of IR and
Table 10: Textual features with high Information Gain (IG)
predominance of subjective questions, which may in fact correlate with asker satisfaction (and requires further investigation). Asker Satisfaction Varying with Past Experience: The importance of previous asker history features suggests that prediction accuracy should vary significantly with the amount of history available for the asker. To explore this hypothesis we test our model on groups of askers with varying number of previous questions posted. For this experiment, we train our ASP_C4.5 system as described before, but instead of averaging accuracy over all the questions in the test set, we compute Precision, Recall, and F1 separately for each group of askers. In particular, we group together questions from askers with just 1 question (that is, no prior questions posted), 2 questions (i.e., only 1 previous question posted), etc. The results are reported in Figure 3. Not surprisingly, the accuracy of prediction increases dramatically for askers with at least one previous question, reaching F1 of 0.9 for askers with at least three previous questions resolved in the past. This suggests the benefits of personalizing prediction models, as we are exploring in our current work.
6.
RELATED WORK
Community Question Answering sites, such as Yahoo! Answers and Naver, have been gaining increasing popularity among many online users. Unlike in automatic question answering, the goal is not to develop a better algorithm for retrieving and extracting answers, but instead to enable the exchange of high-quality, relevant information between community participants. Finding such quality information, where in QA communities quality varies signifi-
489
QA (see [24]) for an overview). While the idea of relevance being inherently subjective has been pointed out by many researchers (e.g., see references [29] and more recently [21]), we note that in community QA a large fraction of the questions are subjective, compounding the problem of both relevance assessment (which is no longer meaningful). Information seeker satisfaction has been studied in ad-hoc IR context in [11] (refer to [15] for an overview), but studies have been limited by lack of realistic user feedback on whole-result satisfaction and instead worked primarily within the Cranfield evaluation model. Our work is also related to user modeling for web search, where the goal is to predict which results will be relevant (e.g., [1, 27, 26, 9]); other uses include classifying user intent into a particular category (e.g., [20])). This work builds on the influential user model introduced by Belkin et al. [3, 4]. Recently, eye tracking has started to emerge as a useful technology for understanding some of the mechanisms behind user behavior (e.g., [14, 6], which may provide additional insight into user satisfaction with web search results. In contrast, we deal with complex information needs and community-provided answers (with explicit, noisy, “relevance” ratings from other users). Furthermore, we deal with subjective ratings provided by users themselves, instead of other assessors. In order to predict asker satisfaction, we exploit standard classification techniques. Many models and techniques have been proposed for classification problem, including support vector machines, decision tree based techniques [19] and boosting-based techniques [10]. We use these techniques to build our prediction models by using Weka [28], a popular library of machine learning methods. In particular, we use the Weka’s implementation of SMO [18], AdaBoost [10], and an implementation of the C4.5 decision tree [19].
7.
CONCLUSIONS
In this paper we presented, to our knowledge, the first attempt to quantify and predict asker satisfaction in question answering communities. We introduced and formalized the new problem of asker satisfaction prediction, and explored state-of-the-art classification techniques to implement our models. We have shown the importance of asker history to this highly personal, difficult, and subjective task, and demonstrated that our system can outperform human assessors who do not benefit from knowing the prior asker history. Our work opens a promising direction towards modeling user intent, expectations, and satisfaction, and can potentially result in practical improvements to the quality of question answering communities. ACKNOWLEDGEMENTS: We thank the Yahoo! Answers team for allowing us extended use of the API, the Emory College Seed Fund for partially supporting this research, and the anonymous reviewers for valuable suggestions.
8.
REFERENCES
[1] E. Agichtein, E. Brill, S. Dumais, and R. Ragno. Learning user interaction models for predicting web search result preferences. In Proc. of SIGIR, 2006. [2] E. Agichtein, C. Castillo, D. Donato, A. Gionis, and G. Mishne. Finding high-quality content in social media with an application to community-based question answering. In Proceedings of WSDM, 2008. [3] N. Belkin, R. N. Oddy, and H. M. Brooks. Information retrieval: Part ii. results of a design study. Journal of Documentation, 38(3):145–164, 1982. [4] N. J. Belkin. User modeling in information retrieval. Tutorial presented at the Sixth International Conference on User Modelling (UM97).
490
[5] E. Brill, S. Dumais, and M. Banko. An analysis of the askmsr question-answering system. In Proceedings of EMNLP, 2002. [6] E. Cutrell and Z. Guan. Eye tracking in MSN Search: Investigating snippet length, target position and task types, MSR-TR-2007. [7] H. T. Dang, D. Kelly, and J. Lin. Overview of the TREC 2007 question answering track. In Proc.of TREC, 2007. [8] D. Demner-Fushman and J. Lin. Answering clinical questions with knowledge-based and statistical techniques. Computational Linguistics, 33(1):63–103, 2007. [9] D. Downey, S. T. Dumais, and E. Horvitz. Models of searching and browsing: Languages, studies, and applications. In Proc. of IJCAI, 2007. [10] Y. Freund and R. Schapire. Experiments with a new boosting algorithm. In Proc. of the 13th international conference on machine learning (ICML1996), 1996. [11] S. P. Harter and C. A. Hert. Evaluation of information retrieval systems: Approaches, issues, and methods. [12] J. Jeon, W. Croft, and J. Lee. Finding similar questions in large question and answer archives. In Proceedings of CIKM, 2005. [13] J. Jeon, W. Croft, J. Lee, and S. Park. A framework to predict the quality of answers with non-textual features. In Proceedings of SIGIR, 2006. [14] T. Joachims, L. Granka, B. Pan, H. Hembrooke, F. Radlinski, and G. Gay. Evaluating the accuracy of implicit feedback from clicks and query reformulations in web search. ACM Trans. Inf. Syst., 25(2), 2007. [15] M. Kobayashi and K. Takeda. Information retrieval on the web. ACM Computing Surveys, 32(2), 2000. [16] J. Lin and D. Demner-Fushman. Methods for automatically evaluating answers to complex questions. Information Retrieval, 9(5):565–587, 2006. [17] J. Lin and P. Zhang. Deconstructing nuggets: the stability and reliability of complex question answering evaluation. In Proceedings of SIGIR, pages 327–334, 2007. [18] J. C. Platt. Fast training of support vector machines using sequential minimal optimization. Advances in Kernal Methods – Support Vector Learning, pages 185–208, 1998. [19] J. Quinlan. Improved use of continuous attributes in c4.5. In Journal of Artificial Intelligence Research, 1996. [20] D. E. Rose and D. Levinson. Understanding user goals in web search. In Proceedings of WWW, 2004. [21] I. Ruthven, L. A. Glasgow, M. Baillie, R. Bierig, E. Nicol, S. Sweeney, and M. Yakici. Intra-assessor consistency in question answering. In Proceedings of SIGIR, pages 727–728, 2007. [22] R. Soricut and E. Brill. Automatic question answering: Beyond the factoid. In HLT-NAACL, 2004. [23] Q. Su, D. Pavlov, J. Chow, and W. Baker. Internet-scale collection of human-reviewed data. In Proc. of the 16th international conference on World Wide Web (WWW), 2007. [24] E. M. Voorhees. The philosophy of information retrieval evaluation. In Proceedings of (CLEF), 2001. [25] E. M. Voorhees. Overview of the TREC 2003 question answering track. In Text REtrieval Conference, 2003. [26] R. White, M. Bilenko, and S. Cucerzan. Studying the use of popular destinations to enhance web search interaction. In Proc. of SIGIR, 2007. [27] R. W. White and S. M. Drucker. Investigating behavioral variability in web search. In Proc. of WWW, 2007. [28] I. Witten and E. Frank. Data Mining: Practical machine learning tools and techniques. Morgan Kaufman, 2nd edition, 2005. [29] J. Zobel. How reliable are the results of large-scale information retrieval experiments? In Proceedings of SIGIR, pages 307–314, 1998.