Policy Coherence for Development : A Background paper on Foreign Direct Investment Thierry Mayer
To cite this version: Thierry Mayer. Policy Coherence for Development : A Background paper on Foreign Direct Investment. 2006.
HAL Id: hal-01065640 https://hal-sciencespo.archives-ouvertes.fr/hal-01065640 Submitted on 18 Sep 2014
HAL is a multi-disciplinary open access archive for the deposit and dissemination of scientific research documents, whether they are published or not. The documents may come from teaching and research institutions in France or abroad, or from public or private research centers.
L’archive ouverte pluridisciplinaire HAL, est destin´ee au d´epˆot et `a la diffusion de documents scientifiques de niveau recherche, publi´es ou non, ´emanant des ´etablissements d’enseignement et de recherche fran¸cais ou ´etrangers, des laboratoires publics ou priv´es.
OECD DEVELOPMENT CENTRE Working Paper No. 253
POLICY COHERENCE FOR DEVELOPMENT A BACKGROUND PAPER ON FOREIGN DIRECT INVESTMENT by
Thierry Mayer Research programme on: Policy Coherence for Development
July 2006
Policy Coherence for Development: A Background Paper on Foreign Direct Investment DEV/DOC(2006)07
DEVELOPMENT CENTRE WORKING PAPERS This series of working papers is intended to disseminate the Development Centre’s research findings rapidly among specialists in the field concerned. These papers are generally available in the original English or French, with a summary in the other language. Comments on this paper would be welcome and should be sent to the OECD Development Centre, 2, rue André Pascal, 75775 PARIS CEDEX 16, France; or to [email protected]. Documents may be downloaded from: http://www.oecd.org/dev/wp or obtained via e-mail ([email protected]). THE OPINIONS EXPRESSED AND ARGUMENTS EMPLOYED IN THIS DOCUMENT ARE THE SOLE RESPONSIBILITY OF THE AUTHOR AND DO NOT NECESSARILY REFLECT THOSE OF THE OECD OR OF THE GOVERNMENTS OF ITS MEMBER COUNTRIES
CENTRE DE DÉVELOPPEMENT DOCUMENTS DE TRAVAIL Cette série de documents de travail a pour but de diffuser rapidement auprès des spécialistes dans les domaines concernés les résultats des travaux de recherche du Centre de développement. Ces documents ne sont disponibles que dans leur langue originale, anglais ou français ; un résumé du document est rédigé dans l’autre langue. Tout commentaire relatif à ce document peut être adressé au Centre de développement de l’OCDE, 2, rue André Pascal, 75775 PARIS CEDEX 16, France; ou à [email protected]. Les documents peuvent être téléchargés à partir de: http://www.oecd.org/dev/wp ou obtenus via le mél ([email protected]). LES IDÉES EXPRIMÉES ET LES ARGUMENTS AVANCÉS DANS CE DOCUMENT SONT CEUX DE L’AUTEUR ET NE REFLÈTENT PAS NÉCESSAIREMENT CEUX DE L’OCDE OU DES GOUVERNEMENTS DE SES PAYS MEMBRES
Applications for permission to reproduce or translate all or part of this material should be made to: Head of Publications Service, OECD 2, rue André-Pascal, 75775 PARIS CEDEX 16, France
© OECD 2006
2
© OECD 2006
OECD Development Centre Working Paper No. 253 DEV/DOC(2006)07
TABLE OF CONTENTS
ACKNOWLEDGEMENTS.......................................................................................................................... 4 PREFACE ...................................................................................................................................................... 5 RÉSUMÉ........................................................................................................................................................ 7 SUMMARY ................................................................................................................................................... 8 I. INTRODUCTION..................................................................................................................................... 9 II. HOW TO ATTRACT FDI ..................................................................................................................... 11 III. IS ATTRACTION OF FDI A REASONABLE POLICY? ................................................................. 19 IV. HOW AID AND FDI POLICIES INTERACT .................................................................................. 24 V. HOW TRADE AND FDI POLICIES INTERACT.............................................................................. 36 VI. CONCLUSION..................................................................................................................................... 43 DATA APPENDIX..................................................................................................................................... 45 BIBLIOGRAPHY ........................................................................................................................................ 49 OTHER TITLES IN THE SERIES/ AUTRES TITRES DANS LA SÉRIE.............................................. 53
© OECD 2006
3
Policy Coherence for Development: A Background Paper on Foreign Direct Investment DEV/DOC(2006)07
ACKNOWLEDGEMENTS
The author thanks the participants to the 9 May 2005 Workshop on Policy Coherence in OECD for their comments on an earlier version. Lisa Chauvet provided detailed suggestions and insightful comments in her discussion. Jeff Dayton-Johnson was also extremely helpful in providing guidance towards improving the final version of this paper. The Development Centre would like to thank the Swiss Authorities for financial support given to the project which gave rise to this study.
4
© OECD 2006
OECD Development Centre Working Paper No. 253 DEV/DOC(2006)07
PREFACE
Meeting international commitments to development co-operation such as the Millennium Development Goals, the Monterrey Consensus on financing for development and the Gleneagles G8 summit agreements to increase aid by around $50 billion per year by 2010 will require not only increased resources, but also their judicious use. In this context policymakers and others cannot limit their attention to the effectiveness of foreign aid alone; they must broaden the discussion to include the development-related impacts of a spectrum of rich-country policies, including those related to investment, trade, and international migration. Such policies can work at cross purposes on the ground in developing countries, thwarting poverty reduction and hindering economic growth. Yet in most cases the policy impacts have been studied separately or independently. The OECD Development Centre’s Policy Coherence activities address this knowledge gap by conducting well-defined country case studies of the interaction of richcountry policies in poor countries (including their interdependence with local policies), in close collaboration with researchers and institutions in developing countries. To further that end, the Centre has asked leading experts to take stock of what is known about the impact of four key vectors of OECD member policies — those governing official development assistance (ODA), foreign direct investment (FDI), migration and trade — on development in poor and emerging economies. These four background papers, all of which will shortly be available publicly, provide a key input into the Centre’s Policy Coherence project. This paper is one of them. OECD-member policies do sometimes work at cross purposes in their development impact. For example, restrictions on developing-country exports under the recently terminated Multifibre Agreement (MFA) cost those exporters an estimated $50 billion annually, very roughly equal to annual foreign-aid flows to developing countries during the same period. Clearly this shows incoherence between trade and aid policies insofar as one objective of policy making is to promote economic development. The growing number of African doctors in some OECD members suggests another example. It reveals incoherence between foreign-aid policies, which seek to increase the supply of health services in poor countries and in many cases pay to train doctors, and migration policies, which selectively seek out doctors and provide powerful incentives for them to leave their home countries. Of course, OECD-member trade and migration policies have objectives other than promoting development in poorer countries, and citizens and policy makers may decide that in some cases those other objectives are more important than development. Yet at the very least, this project seeks to make more explicit the magnitude of the trade-offs among policies. What, in short, is the cost of policy incoherence?
© OECD 2006
5
Policy Coherence for Development: A Background Paper on Foreign Direct Investment DEV/DOC(2006)07
In addition to identifying cases where rich-country policies work at cross purposes, a cross-cutting issue is whether policies are complements or substitutes. Policies to promote ODA and FDI, for example, are complementary if aid flows to a country (to finance port infrastructure, say) increase the attractiveness of that country as a destination for capital flows. Policies are substitutes if the effects of diminished flows from one policy can be offset by increased flows from a second. Many observers wonder whether the considerable remittance flows sent home by migrants might substitute for foreign aid flows, reducing poverty and financing investment. Of course, the complementarity of FDI and ODA or the substitutability of remittances and aid are at this point merely hypotheses. The project aims to study such interactions more carefully; this paper provides one input. Louka T. Katseli Director OECD Development Centre July 2006
6
© OECD 2006
OECD Development Centre Working Paper No. 253 DEV/DOC(2006)07
RÉSUMÉ
Augmenter les flux d’investissements direct à l’étranger (IDE) vers les pays en développement est une pierre angulaire dans les engagements pris en terme de développement international. Dans une telle perspective, cet article évalue l’état des connaissances en ce qui concerne : i) les facteurs qui conduisent les entreprises à construire des usines à l’étranger, et ii) l’influence que les autres politiques (notamment l’aide étrangère) sont susceptibles d’avoir sur ces décisions. Les deux principaux facteurs à l’origine des IDE sont tout d’abord une motivation « horizontale » (pour gagner l’accès aux marchés du pays récipiendaire) et une autre « verticale » (pour exploiter les différences de coûts de production à plusieurs niveaux de la chaîne de production). La littérature empirique (une grande partie d’entre elle se concentrant sur les flux d’IDE entre pays riches) énonce clairement que l’accès au marché est une motivation quantitativement plus importante que les coûts de production. Quelles sont les leçons à en tirer quant à la cohérence des politiques ? Les effets positifs des IDE sur la croissance dépendent de la capacité d’absorption du pays ; l’aide peut être utilisée pour promouvoir l’accumulation de capital humain tandis que les politiques commerciales peuvent faciliter l’orientation des exportations dans l’économie récipiendaire. Ces deux actions augmentent la probabilité pour un pays de récolter les fruits des afflux d’IDE. En particulier, les politiques d’aide peuvent avoir comme objectif d’améliorer les infrastructures de communication et la capacité institutionnelle du pays récipiendaire. Ces politiques attirent alors des IDE en retour, car elles réduisent les coûts de production et améliorent les perspectives liées aux gains de productivité. Finalement, la promotion des échanges entre pays pauvres (afin d’élargir l’accès au marché représenté par une destination d’IDE donnée) et les améliorations provisoires de l’accès unilatéral au marché accordé par les pays riches sont susceptibles d’aider à attirer des IDE.
© OECD 2006
7
Policy Coherence for Development: A Background Paper on Foreign Direct Investment DEV/DOC(2006)07
SUMMARY
Increasing the flow of foreign direct investment (FDI) to developing countries is a cornerstone of new international development commitments. Accordingly, this paper reviews the state of knowledge regarding i) the factors that lead firms to build a plant overseas and ii) the influence that other policies (notably foreign aid) might have on those decisions. There are two broad motives for FDI: a “horizontal” motivation (to gain access to markets in the recipient country) and a “vertical” one (to exploit differences in production costs at various points in the production process). The clear message of the empirical literature (much of it focused on FDI flows between rich countries) is that market access is quantitatively far more important than production costs. What are the lessons for policy coherence? Positive effects of FDI on growth depend on a country’s absorptive capacity; aid can be used to promote human-capital accumulation while trade policies can facilitate the export orientation of the host economy. Both of these actions increase the likelihood of reaping rewards from FDI inflows. In particular, aid policies can aim at improving a recipient country’s communication infrastructure and institutional capacity. These policies attract FDI in turn, as they lower production costs and improve the prospects for productivity gains. Finally, trade facilitation between poor countries (to enlarge the market access represented by a given FDI destination) and temporary non-reciprocal market access improvements granted by rich countries could help attract FDI.
8
© OECD 2006
OECD Development Centre Working Paper No. 253 DEV/DOC(2006)07
I. INTRODUCTION1
Policy coherence towards development is intended to take into account the interdependence of measures that rich countries take in favour of growth and poverty reduction in poor countries. The several dimensions of development policies should ideally not have offsetting effects, or at least those should be identified and precisely measured. In terms of policy coherence, the investment case is slightly specific. The policy objective regarding investment is to improve the returns to investment in poor countries, both domestic and foreign, with a particular goal to increase the flows of FDI directed to poor countries. Indeed one of the most striking stylized facts concerning FDI distribution across countries is that the large majority of the flows are going from rich countries to other rich countries, rather than to poor countries2. However, rich countries do not have many direct policy instruments to improve the amount of FDI received by poor countries, simply because it implies policy measures that have to be implemented in the host country rather than in the origin country. Bilateral Investment Treaties (BITs) are one of the rare ways rich countries can try to increase the amounts of FDI flowing to developing countries, by reducing ex ante the risks associated with opportunistic behaviour by host governments, and providing some rights to investors once they are settled in a country. There is a small set of papers empirically assessing the impact of BITs on FDI. UNCTAD (1998) does not find any statistical evidence that this type of measure actually attracts FDI in addition to traditional determinants, in a cross-section of more than a hundred host countries in 1995. Hallward-Driemeier (2003) more recently confirmed this lack of independent effect of BITs, which seem to complement rather than substitute for the other determinants of a country's attractiveness, and notably its institutional quality. This study improves considerably on the data and method. It uses bilateral FDI flows over 20 years, which enables to study the real important question: whether those bilateral treaties increase bilateral FDI, once they are implemented. The author also accounts for potential endogeneity in the signing of BITs. Egger and Pfaffermayr (2004) find more positive effects in a recent study using similar data and methods, but include 1.
The author is affiliated to Université de Paris Sud, CEPII, PSE Paris-Jourdan and CEPR.
2
China is a recent exception to this phenomenon. Indeed the size of the FDI flows to this country in recent years has been impressive and improved the overall performance of the developing world in terms of FDI reception. In its most recent survey, UNCTAD reveals that the share of LDCs in global inflows of FDI in 2003 is only 23 per cent without flows toward China but reaches 30 per cent with them.
© OECD 2006
9
Policy Coherence for Development: A Background Paper on Foreign Direct Investment DEV/DOC(2006)07
developed countries as receivers of FDI in their sample, contrary to Hallward-Driemeier (2003). To sum up, the current state of knowledge in this literature suggests that BITs are quite ineffective in boosting FDI towards poor countries. However other policy tools of developed countries have indirect impacts on poor countries attractiveness for foreign investors. Some of those impacts are intentional, with an explicit goal to improve the conditions under which investors operate in LDCs, some less so. I investigate here how two types of policies, aid and trade policies, interact with the objective of raising the FDI flows to poor countries, and perhaps raising the economic benefits that host nations can expect from foreign affiliates operations. I first summarise the current state of knowledge on the factors known theoretically and verified empirically to attract FDI. I also review in section III the evidence pointing towards the validity of the objective: The extent to which higher levels of received FDI indeed fosters development. In section IV, I study the impact of aid policy as an incentive for host countries to promote a better FDI environment, for instance by providing a better “institutional framework”, which has recently been shown to be critically important for sustained growth. Then I proceed to estimating whether different types of aid received attract FDI inflows. In section V, I study the interactions between trade policy and investment policies, with a particular focus on how improved access to rich markets raises income per capita, and how increased FDI can be a channel for this effect. Empirical evidence is also provided on the FDI response to trade policies. The last section concludes.
10
© OECD 2006
OECD Development Centre Working Paper No. 253 DEV/DOC(2006)07
II. HOW TO ATTRACT FDI
Attracting FDI involves policy measures that are not without economic or social costs. Tax breaks, subsidies, infrastructure improvements are examples of policy measures intended to raise the volume of FDI received that have a direct and measurable cost, especially in poor countries. It is therefore a very legitimate question to ask whether those costs are “worth the prize”, that is whether FDI received yields such substantive net economic benefits that it justifies this type of spending. Hanson (2001) derived in simple and clear way the theoretical conditions under which active FDI promotion policies are most likely to increase welfare of a developing economy. The main concerns about negative effects associated with incoming FDI in a developing country (recently modelled by Markusen and Venables, 1999) is the increased competition level imposed on domestic firms, that used to be sheltered from this competition by the amount of transport costs needed to export the good from the home country of the multinational. Put simply, positive spillovers to local overall productivity need to be all the more important that the negative competition effect is large. Note that the two effects are not independent, however, since it is quite likely that the adverse effect on local competitors will be stronger when the initial productivity differential is large. It is therefore key to gauge empirically the tools available to attract foreign investors, and the benefits to be expected.
II.1 A General Framework of FDI Location Choice What are the determinants of the location choice made by a multinational firm for its production unit? The first analysis of how foreign direct investors locate their affiliates draws on the traditional endowments theory framework. When factors are mobile in this framework, perfectly competitive owners of capital locate it wherever the return of it is higher, that is, preferably in countries where it is scarce, the developing world. This North-South view of capital flows where only relative costs matter has been radically amended in order to better match with actual patterns of location choices. Three radical departures have been notably made with respect to the traditional paradigm. First, increasing returns and imperfect competition have been combined with the existence of transport costs to explain the existence of multinational firms locating affiliates abroad in order to be closer to consumers and gain market shares over rivals this way. This has been called the horizontal motivation for FDI, as first proposed formally by Markusen (1984). Second, different stages of production have been introduced in the analysis, with countries differing in the production costs for each of those stages, and multinational firms locating according to the patterns of comparative advantages of countries in each stage of production. Helpman (1984) first introduced a model of this type, which is commonly referred to as the vertical motive for FDI. There have been several attempts to provide a synthesis of the two modelling structures, notably by Markusen and Venables (1998, 2000). Let me summarise the © OECD 2006
11
Policy Coherence for Development: A Background Paper on Foreign Direct Investment DEV/DOC(2006)07
principal determinants of location choice that can be identified in such an integrated framework and that have been subject to empirical estimation in the large literature on the topic. I will follow a reduced-form approach here in order to give a wide-ranging framework that can account for the diversity of empirical implementations in the literature. Different formalised presentations can be found in Barba-Naveratti and Venables (2004), Markusen (2002) or Head and Mayer (2004) for instance. It is one of the most important finding of this literature that the pattern of trade costs across potential location sites is crucial in the strength of most determinants affecting location choice. Consider first demand: In a perfectly integrated economy, choosing a country rather than another has no effect on the level of demand faced by a firm, because distance, borders and space more generally do not matter for trade flows. Locations will therefore not offer different characteristics in terms of demand, and this variable will have no influence on relative profitability of different countries and therefore on the final choice. At the other extreme, if trade costs are very high, the firm chooses between isolated and quasi-autarkic “island” in terms of demand, which means that only local demand will matter in the choice. Of course, the reality of trade costs is somewhere in a middle range (see Anderson and van Wincoop, 2004, for a detailed account of the literature trying to estimate the level of those trade costs), and the construction of the demand variable needs to take into account those accessibility issues so as to discount demand in remote locations accordingly. The resulting determinant is known as the market potential, a well-known concept among geographers (Harris, 1954, initiated the concept) and rediscovered recently and more formally in theoretical and empirical work by economic geographers (Krugman, 1992; Fujita et al., 1999; Redding and Venables, 2004; Head and Mayer, 2004; Hanson 2005, notably). As stated above, an important improvement of recent approaches of FDI is the inclusion of imperfect competition in the analysis. Here again trade costs are central in the intensity of competition faced in each alternative location by the affiliate. With zero trade costs, space is meaningless, and each firm faces the same level of competition in all locations, which renders the number and location of competitors inconsequential for the location choice. With positive trade costs, distance isolates from competition, which means that firms will, everything else equal, try to avoid regions with a large number of establishments in their industry. This tendency to avoid proximity to competitors has been recognised for a long time in location theory (see Fujita and Thisse, 2002; for an overview) and is often called the market crowding effect. Another set of determinants of location choice involves variables influencing production costs in the different locations. Labour costs are of course crucial in this respect but there are other determinants of costs that have been proposed in the literature. A recently popular hypothesis is that affiliates of multinational firms benefit from technological spillovers when locating near other affiliates in the same industry. If such spillovers exist, they can be expected to raise the attractiveness of places where the number of firms in the same industry is important for instance because proximity to competitors would increase productivity or reduce R&D costs due to the positive knowledge transmission from neighbouring firms. Note again that such forces can be at work only if space matters. Proximity to knowledge producers is valuable only if knowledge is hard to acquire over space. Distance-related frictions to knowledge transfers have been documented empirically in the literature using notably the location of patents' citation: Peri 12
© OECD 2006
OECD Development Centre Working Paper No. 253 DEV/DOC(2006)07
(2005) is a recent example showing that such frictions are large. Technological spillovers will therefore push firms to cluster in the same locations. This incentive will counterbalance the market crowding effect mentioned above, through which proximity intensifies competition and therefore reduces profits. Another set of variables that can affect costs of production concerns investment incentives in general, which takes the form of regional policies in some areas like Europe. Regional policies can take the form of direct production subsidies for targeted regions as is the case in France with the Prime d'Aménagement du Territoire. Regional policy usually does not take the form of direct subsidies to the investor, but can have a similar indirect effect. Indeed, a large share of EU structural funds for instance is used to finance public transport and communication infrastructure in peripheral areas, which might lead to a reduction in production costs and therefore be beneficial to foreign investors.
II.2 Two Types of Empirical Tools To summarise, the expected profit from locating in country i for a foreign investor will be a function of the market access of that country (MAi) which takes into account both the spatial distribution and ease of access to demand from i and the level of competition faced in i. Second come the cost component, (Ci), itself consisting of various elements, in particular factor costs but also institutional features or investment incentives of the host country that can influence production costs. Another important part of the cost function relates to the costs of intermediates faced in country i. Not only locally available intermediates are relevant again here of course. Easy access to a large pool of cheap intermediates in nearby countries is often a decisive advantage called the Supplier Access of country i. Market access is expected to influence profits and therefore location probability positively, while high cost will have a negative influence on the probability for a country to be chosen. Naturally, the set of determinants just outlined is not exhaustive and it seems difficult to capture accurately all cost-related variables for instance in this type of work that should enter Ci in an empirical exercise. Fortunately, an easy way to deal (at least partly) with this empirical implementation problem, first proposed by Head et al. (1995) is to use fixed effects (αi) for each alternative country i in the location choice set. This will ensure that all time-invariant characteristics of a country that make it attractive but are unobserved are nevertheless controlled for (for instance, the difference in skill composition of the labour force, the price of other inputs such as land, etc.). The expected profit yielded by location i for affiliate α in time t can therefore be described as:
ln Π it (a ) = α i + β 1 ln MAit (a ) + β 2 ln C it (a )
(1)
The core of the empirical research on location determinants is an implementation of this equation, under various forms. Researchers estimate the influence of proxies for each of those variables using the individual firm location choice decision to estimate the relevant coefficient, using primarily the conditional logit econometric model. A last remark is in order here concerning the type of FDI for which equation (1) is relevant, under the now traditional horizontal/vertical distinction. Equation (1) has traditionally been used to study FDI of the horizontal-type. Because of its generality, it is however also relevant for vertical FDI. Suppose that firms are keeping design of the product in the home © OECD 2006
13
Policy Coherence for Development: A Background Paper on Foreign Direct Investment DEV/DOC(2006)07
country and locating actual production in another foreign country (the classical Helpman, 1984 case). Location of the production affiliate will also be a function of market potential and costs. Even in the case of intermediate goods or semi-processed goods, market potential of the country for the affiliate seems relevant, although it now principally consist of the locations and size of other affiliates in the same firm that use its output in later stages of production. Even under the vertical motivation for FDI, not only the production costs are relevant: The economic geographies of demand and supply are also important, although most of the action might take place within the firm in that case. A large part of the literature lacking data on individual firms' decisions needed to estimate parameters in equation (1) directly, rely instead on various measures of aggregate FDI received by a country. Should it be in terms of flows or stocks, the total amount received will of course be related to the underlying profitability of country i, described in equation (1). A more fundamental modification generally introduced is due to the use of the bilateral dimension of FDI. Data sources like the OECD FDI database (used below), include both the receiving and the origin countries of the FDI flows. What are the changes in the estimated equation? First the pool of potential investors in the origin country must be taken into account. This is in general proportional to the GDP of the origin country j, reflecting the number of domestic varieties and firms that can potentially invest abroad. Second, the costs incurred when investing in a given country include information and communication costs about the host country, which obviously vary according the distance and other proxies of spatial separation between i and j. Again proxying for all determinants is impossible which suggests the use of fixed effects for each country of origin and destination in the sample. Then, building on (1) and on the arguments above, one can estimate a gravity-type equation of FDI flows as:
ln Fijt = α i + α j + γ1 ln MAit + γ 2 ln GDPjt + γ3 ln Pr odC it + γ 4 ln TransC ijt
(2)
The above equation is related to the gravity equation in trade since it i) explains bilateral flows; ii) incorporates both size variables of the two countries; and iii) incorporates transaction costs variables which will include bilateral distance. Note however that the motivation for the key variables is quite different from the one explaining trade volumes. In particular, bilateral distance here will not be a proxy for freight costs (which would affect bilateral FDI flows positively everything else equal), but accounts for communication and other hindrances that arise when coordination must take place between much dispersed affiliates of the multinational firm. How will aid and trade policies affect the profitability of country i in equations (1) and (2)? Those are the questions that will be treated in sections IV and V. Aid policy can basically affect all determinants. It can improve the access to markets and the access to suppliers through the financing of projects lowering transport costs of firms in the country. It can also of course affect production costs in a country, through the improvement of supply conditions of local inputs (energy or communication for instance). The impact on costs can be more indirect, through the improvement of the business climate, if aid policy is designed and successful at curbing down corruption for instance. This relates to the last determinant's interaction with aid. The policies taken by developing countries' governments can be altered or influenced by aid policy and therefore change the volume and/or composition and effects of FDI. Trade policies will naturally mostly increase the market access of the receiving country towards countries that 14
© OECD 2006
OECD Development Centre Working Paper No. 253 DEV/DOC(2006)07
alleviate their protectionist measures, thereby increasing its attractiveness in the eyes of foreign investors.
II.3 Which are the Empirically Dominant Determinants? The principal debate in the determinants of location choice relates to whether firms seek essentially low-cost host countries or are more driven by proximity to large demand pools, and are willing to pay higher wages to produce there. This debate has received empirical answers in the literature, through the respective weight of market access and production costs in the location choice.
Market Access Measuring market access of a given country in a given industry at a given period in time is not at all a trivial issue. The relevant market access for an investor is a measure of discounted demand to be expected from locating in i. But the precise measurement and discounting factors to use are subject to large discussions. The second issue is that the intensity of competition must be taken into account: Market access is also crucially affected by the spatial distribution of competitors. The difficulties raised by this issue are even more problematic (see Redding and Venables, 2004; Hanson, 2005; Amiti and Javorcik, 2005; Head and Mayer 2004; for discussions about this issue). The academic literature has made abundant progress in this field, which I review here. The first papers in the literature assessing the impact of market access on economic activity estimate how differences in market access translate into differences in factor rewards and more generally in economic development. By using the new economic geography modelling structure of market potential, Hanson (2005) shows that the spatial distribution of manufacturing wages in the United States is crucially determined by the quality of access to large pools of final demand. Redding and Venables (2004) extend the analysis and relate the level of economic development of more than 100 countries to the structural version of the market access variable suggested by theory. The explanatory power of their cross-sectional analysis is striking: market access explains between 35 and 75 per cent of worldwide variance in GDP per capita, depending on specifications. Head and Mayer (2004) use the same underlying theoretical modelling and very comparable structural estimation methods in an application to FDI flows. They relate their measure of market potential to location choices of Japanese multinational firms in the EU. They find that market potential- either in its most structural form or in more reduced form- is indeed a key driving determinant of those location choices, much more important than differences in labour costs or corporate taxes for instance. Figure 1uses their data to illustrate in the simplest way the impact of market potential as a driver of foreign investment.
© OECD 2006
15
Policy Coherence for Development: A Background Paper on Foreign Direct Investment DEV/DOC(2006)07
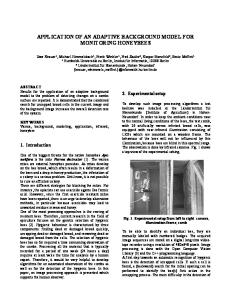
Figure 1. Japanese FDI Stock and Market Potential in the EU Regions
Source: Head and Mayer (2004).
The horizontal axis reports a market potential (averaged over the 1985-95 period) index with respect to the Brussels region, which is the region having the top market potential in the EU under their measure. The vertical axis simply reports the number of Japanese manufacturing affiliates located in each region between 1985 and 1995 (both axes in logs). There is an overall clear positive influence of market potential in the attractiveness of EU regions for Japanese investors. Also interesting is the observation of some clear under-performing regions that are quite specific like the city-regions of Berlin and Hamburg, and the distinct over-performance of some regions in the UK and Ireland compared to their market potential. It could be argued that those findings are only relevant in North-North FDI flows. That is demand would important for investment in rich countries whereas cost differences would be key for FDI directed towards emerging economies like China. To measure and possibly challenge the empirical validity of this hypothesis, one can turn to Amiti and Javorcik (2005). They examine the relative importance of key determinants of foreign investment (of the change in the number of foreign firms present in a given province within a industry) in China: market size, factor costs, proximity of suppliers and lastly trade costs. Relying on data detailed at the industry (515 industries) and provincial (29 provinces) levels, they find that market access and the proximity of suppliers are the main factors explaining inward FDI flows in Chinese provinces. Doubling either of these factors leads to a 40 per cent increase in the entry of foreign firms, while doubling wages in a province would “only” reduce FDI received by 20 per cent. An interesting finding for our purpose is that the local part of the access to demand and access to inputs variables are particularly important in the location choice. This is probably due to a large remaining fragmentation of the Chinese market, documented recently in great detail by Poncet (2003). US FDI data collected by the BEA and documenting the motivation of locating foreign affiliates in developing economies also point out to this perhaps surprisingly prominent market access 16
© OECD 2006
OECD Development Centre Working Paper No. 253 DEV/DOC(2006)07
motive: according to Mataloni (2004) 71 per cent of sales of US affiliates located in China are directed towards local customers in 2002. The corresponding figure is 87 per cent in India, and even a surprising 64 per cent in Mexico, a location that should host primarily vertical investment, motivated by re-exportation to the United States. Buch et al. (2005) investigate the determinants of German FDI location over the world. Once again their paper stresses that the market access motive for internationalisation is dominating. Buch et al. (2005) use the firm level data either directly at the individual level, or aggregated into industries, or total flows to each destination market. They use two alternative measures of market access determinants: local GDP- used in the majority of the literature on location choices until recently- and market potentials more recently introduced. Using macro data, it appears that German firms mainly go abroad for the stake of acceding to large and developing foreign markets. This result is obtained using the traditional GDP variable, and confirmed using the newly introduced market potential. The outcome is clear-cut: A 1 per cent increase in the size of a given foreign market is associated with a 1 per cent increase in the activity of the German firms in this location. Exploiting the industry-level detail, the previous dominance of the market access motive is confirmed, but the associated elasticity is highly dependent on the sector. It ranges from 0.5 in the Clothing industry to 1.6 for the Transport and equipment material. This does not come as a surprise: In labour-intensive industries producing items easy to ship abroad, the vertical nature of FDI is certainly dominant; in contrast, in the car industry, access to the local market is a key motivation. What those results tell us is simply that market access and cost determinants both matter, but that- overall- the most prominent one remains market access: It is highly unlikely that Mercedes-Benz cars sold in Europe will tomorrow be produced in Beijing. Last, Bush et al. (2005) run a firm-level analysis (controlling for the strong heterogeneity among firms), where they show that market access remains a key determinant.
The Impact of Production Costs Becker et al. (2005) is a very recent example of study investigating the role of production costs in the location decision. They use two panels of German and Swedish multinational firms to investigate whether employment substitution between parent and foreign affiliates are due to differences in labour costs. Becker et al. (2005) find that a 1 per cent increase in the wage gap between German locations and CEECs’ ones translates into 900 fewer jobs in Germany and 5,000 more jobs in affiliates abroad. While the magnitude of this impact might seem large at first sight, it remains limited in comparison with the 1 954 000 workers employed by German multinationals in Germany: a 20 per cent increase in the wage gap between Germany and the CEECs would cut employment in Germany by only 1 per cent in Germany according to their estimation. Those recent estimates refine earlier findings that labour costs are not the main determinant of location choice although they might be found to have a statistically significant impact. Production-cost gaps incorporate not only wage differences in wages or even differences in unit costs. Even restricting the attention to the labour market; differences in regulations if often mentioned as a determinant of location choices. Amiti and Javorcik (2005) estimate a fixed effect (controlling for unobservable characteristics of the firms) logit model, which explains the decision of the largest 10 000 firms in Europe to be present or not in a given location, depending © OECD 2006
17
Policy Coherence for Development: A Background Paper on Foreign Direct Investment DEV/DOC(2006)07
among other things on its labour market regulations. The latter variable is considered in absolute terms, and also relatively to the home country of the investor. Alternative locations are 14 of EU15 countries, three new members (the Czech Republic, Hungary, Poland), Bulgaria and Ukraine. Measures regarding the flexibility of the labour market rely on the Global Competitiveness report of the World Economic forum, as well as additional indicators compiled by the World Bank. Control variables regarding the host country are rather crude, too, and depart from the ones suggested by theory: Market size is proxied by the population of the host country, notwithstanding its living standard (we are quite far here from the refinements of the market potentials). Labour costs are proxied by the average wage. Property rights and business taxation are also proxied in a rather crude way. In addition to a positive impact of the size of the population, as well as a positive impact of the average wage (a counterintuitive although not rare result in the literature), the key result is that a more flexible labour market is increasing the probability of the presence in the host economy. Alternatively, the authors use a second specification addressing the size of the foreign locations, which confirms the previous findings and permits to quantify the impact of the regulations on the volume of investment: comparing the regulated French economy with the deregulated UK, the authors find a 12 to 26 per cent difference in the volume of investment, depending on the measure of the regulations. Another frequent claim considering FDI location choices from rich countries to poor ones is that developing countries can adopt “pollution havens strategies” to attract multinational firms of structurally polluting industries whose costs are increased in rich countries by more demanding regulations. Recent empirical evidence of such causation remains however limited: Busse (2004) investigates five highly polluting industries and 119 countries: he fails to identify any evidence that industries facing above-average abatement costs would relocate in pollution havens, and translate into net exports of the host countries. The only exception is the Iron and steel industry. Considering such results, the fears of race to the bottom on environmental regulations may well be exaggerated. Further evidence is provided by Eskeland and Harrison (2003), who test for the relationship between pollution abatement cost and inward FDI for Mexico, Morocco, Côte d'Ivoire and Venezuela. Results point once again to the fact that market size is the main determinant of FDI. Pollution abatement costs are insignificant in most cases. In addition, FDI is largely found in the literature to be more energy efficient and use cleaner types of energy than local firms.
18
© OECD 2006
OECD Development Centre Working Paper No. 253 DEV/DOC(2006)07
III. IS ATTRACTION OF FDI A REASONABLE POLICY?
There is now quite a lot of empirical evidence on the different benefits to be expected from large inflows of FDI. As stated in Barba-Navaretti and Venables (2004), the expected benefits of FDI for the host country cover first the additional investment and associated factor demand that may alleviate shortages of domestic investment or of local unemployment. The second type of effects is the changes in performances of firms operating on the national territory. First, because of a compositional effect, as the share of more efficient foreign affiliates rises in the economy, and second because of a positive feedbacks to the local firms, that may take a variety of forms (availability of more efficient inputs at a lower price, training and mobility of workers, knowledge spillovers- either voluntary or not-, imitation of efficient practices...). The literature can be divided in two broadly defined parts. First is the set of papers trying to estimate the impact of FDI inflows on overall economic performance of the developing country. The archetype empirical exercise in this literature is a growth regression, where the inward flows or stocks of foreign capital are added to the traditional set of growth-explaining covariates. The second set of papers focuses on the underlying mechanisms through which a rise of the presence of foreign investors fosters growth. In this vein, researchers have notably tried to estimate i) whether foreign affiliates exhibit performances superior to local ones in particular in terms of productivity, and exports; ii) the importance of presumed spillovers from foreign affiliates that would increase productivity, export propensity or other performance variables of local firms. Should those be important, one would expect to see, as a consequence a positive impact of FDI presence on local growth in developing countries. Contrary to a rather widespread belief, results in those two literatures are in fact not clear-cut and very much debated, although some recent and quite decisive progress has been made through the use of micro-level data in the second type of studies.
III.1 Growth-type Regressions Typically, FDI variables on their own in growth regressions have insignificant or negligible effects. However the studies from the nineties have managed to find positive effects of FDI in cross-country growth regressions when FDI is interacted with another characteristic of the country. Those interactions are in fact quite directly relevant to our topic, since quite a lot of them can be affected by trade or aid policies. In the most cited work on the topic, Borensztein et al. (1998) have results that mostly emphasise that the positive impact of FDI on growth in a panel of 69 developing countries over the 1970-89 period is totally dependent on the level of human capital of the receiving country © OECD 2006
19
Policy Coherence for Development: A Background Paper on Foreign Direct Investment DEV/DOC(2006)07
(measured with the Barro-Lee index). In countries with very low levels of education, the impact of FDI on growth is in fact even negative. This suggests that the channel through which FDI is beneficial to growth is transmission of knowledge which requires absorptive capacity. This feeling is reinforced by the fact that FDI does not robustly add to the overall investment levels of developing countries in other of their regressions, while it seems to yield more impetus to growth than domestic investment (again in interaction with human capital). The message seems rather optimistic in our context, if aid policies from rich countries manage to improve the absorptive capacity of poor countries, notably through the rise in education level, private foreign investment seems more beneficial to the receiving country. Note that the education sector is one of the components of the social infrastructure sector identified in the aid data from OECD used later in this paper. A related question, again very relevant to the policy coherence objective concerns the complementarity or substitution relationship that FDI and aid flows can have for a given objective, economic growth here. This would involve comparing the impact of aid and FDI variables in a growth regression for instance, and assessing their interactions, in the spirit of Borensztein et al. (1998), although more directly. This exercise has not been carried out yet to our knowledge. It would clearly be interesting and potentially insightful for the intense current academic debates concerning both the FDI/growth and aid/growth empirical relationships. Balasubramanyam et al. (1996) insist on the crucial role of the trade regime, broadly defined as Import Substituting or Export Promoting for obtaining the growth-effects of FDI. The basic motivation for their work is that the IS regime would introduce all sorts of distortions in the economy, notably on factor prices, that would both reduce the amount of FDI received because of the implied lower profitability and the benefits associated with the amount received, through misallocated investment generating less knowledge spillovers to local firms. Both claims are disputable in theory since the protection of a large internal market might be an attractive characteristic to foreign investors, although probably not a very profitable long-term strategy, and the distortions imposed are generally favouring industries where governments think that spillovers are important (they also often impose explicit knowledge transfers from the foreign affiliate to local suppliers or associates in joint ventures). The authors classify IS and EP countries based on a import/GDP ratio threshold, and also use a World Bank classification. They find that EP countries have a larger effect of FDI on the growth rate between 1970 and 1985, the effect for IS being always insignificant. Note that this result is not confirmed by Borensztein et al. (1998) who find an insignificant interaction term on FDI and tariffs. All those simple cross country regressions are plagued with endogeneity issues, both because of omitted variable bias that raise simultaneously FDI and growth, and through reverse causality, since the market seeking motivation for FDI implies that foreign investors will be attracted by countries with a fast growth in income, everything else equal. Calderon et al. (2004) show for instance that economic growth seem to generate inflows of both greenfield and M&A FDI rather than the reverse. FDI however leads domestic investment, which might generate a virtuous circle, although neither FDI nor domestic investment seems to have a clear impact on future growth in their work. Carkovic and Levine (forthcoming) tackle those issues in depth using recent panel data GMM techniques as well as new and much improved data. Their conclusion is mostly
20
© OECD 2006
OECD Development Centre Working Paper No. 253 DEV/DOC(2006)07
destructive of the previous results. The authors are able to construct a panel dataset with averaging data over each of the seven 5-year periods between 1960 and 1995, using several data sources. To summarise, they control for the joint determination of growth and inward FDI flows, country-specific factors, and other growth determinants, which results in a finding of mostly insignificant independent impact of FDI on economic growth. The use of the time dimension in the regression enables to control notably for country-specific fixed effects, which might explain why a given nation might have structural characteristics that make it both an attractive location for foreign investors and a rapidly growing economy. The objective is to find out the effect of an exogenous increase in foreign capital received on growth, and potentially, how other determinants of growth make this part of received FDI more effective in promoting growth (they notably study the interaction of FDI with level of education, trade openness and the level of development). Results show that the stand-alone effect of the exogenous part of FDI is only positive in the panel specification, and only when the openness to trade variable is omitted. Considering the impact of human capital interaction, the result of complementarity of Borensztein et al. (1998) is radically challenged. In the cross sectional regressions, none of the terms is actually significant, while the panel data procedure with fixed effects exhibits that only countries with low levels of education can benefit from FDI. Results are very similar when FDI is interacted with income per capita, contradicting the absorptive capacity hypothesis. Last, when interacted with trade openness, neither the FDI variable nor the interaction term enters significantly. In this type of growth regressions, as in others studying the impacts of openness, the lesson seems to be that the quality of the data and the method used actually matters a great deal and can cool down quite radically the initial enthusiasm.
III.2 Performance-type Regressions The literature on the impact of FDI on the performance of national firms or industries is again not without controversy. There is first the question of whether the impact of FDI is mainly due to a change in the composition of resident firms (for instance because they are concentrated in increasing returns to scale, or knowledge-intensive industries, or because they are more productive even after controlling for their characteristics), or to spillovers to local firms. Although this distinction might be considered irrelevant for the impact on growth and welfare, the long-term potential beneficial effects are likely to be larger with the spillovers channel, which transmit what is frequently cutting-edge knowledge to the local set of entrepreneurs. This is certainly because of the expected benefits from this technology transmission mechanism that the literature has more and more shifted towards estimation of those spillover effects using firmlevel data on firms' performance, usually productivity (either labour or TFP) or exports. Here again the results in the literature depend crucially on the methods used. Unfortunately it seems that better data and methods usually reduce the estimated magnitude of spillovers to local firms. The first table of the meta-analysis paper by Görg and Strobl (2001) is quite instructive in this respect. They list a number of important studies, together with their characteristics, most importantly whether the study is industry-level or firm level and whether it is cross-sectional or panel data. The standard exercise in this literature is to assess whether TFP or labour productivity rises with local presence of foreign firms. They remark that “all but one study using panel data find statistically significant negative or statistically insignificant effects of © OECD 2006
21
Policy Coherence for Development: A Background Paper on Foreign Direct Investment DEV/DOC(2006)07
MNC presence on domestic productivity, while all but one cross-sectional study find statistically significant positive effects” (Görg and Strobl, 2001, p. F724). This pattern holds true in the metaregressions where other characteristic of the study are included. Aitken and Harrison (1999) is a leading example of such finding, in which the presence of foreign affiliates reduces the productivity of local Venezuelan firms. The pattern seems to be particularly frequent in LDC samples, as emphasised by Görg and Greenaway (2004) in their recent survey of the literature that covers a large set of papers with many different geographic samples3. While Hanson (2001) and Görg and Greenaway (2004) are representative of recent surveys concurring to this lack of robust spillover from FDI, some scholars find more supportive evidence from the data. Keller (2004) cites other and more recent micro-level studies that find statistically significant evidence of spillovers from FDI to local UK firms notably. He also quotes Keller and Yeaple’s (2003) study on US firms to emphasise that the industry composition of the individual firms investigated has an importance. An even more recent strand of the literature has investigated the presence of vertical linkages spillovers, through which foreign affiliates transfer knowledge to local suppliers in order to upgrade the quality of the intermediates used in their production process. Smarzynska-Javorcik (2004) provides positive evidence on a sample of Lithuanian firms, using a precise input-output matrix of local manufacturing industries to test for such spillovers. Görg and Strobl (2004) have recently provided an interesting result that enables to go further inside the black box of spillovers. They study whether the productivity evolution of firms in Ghana is higher when the firm is run by a manager that was working in a foreign affiliate immediately before, and find that it is the case if he worked in the same industry. Workers therefore seem to bring some knowledge with them, a knowledge that seem to be industry-specific. Blomström and Kokko (2003) also emphasise the importance of the human capital/FDI relationship for development. Some studies suggest that a threshold of human capital level is needed in the host country to generate positive spillovers from the presence of multinational firms. This might come from foreign investors installing more advanced technology only if the country has invested in sufficient absorptive capacity, but also through training within multinational firms followed by mobility to local firms. A last type of result relevant to us concerns the extent of spillovers depending on the export orientation of the host economy. Görg and Hijzen (2004) propose a very interesting analysis of spillovers from FDI to UK domestic firms from 1988 to 1996, where they are able to distinguish between firms that were involved at some point in exports and firms solely selling on the domestic market. They find that while exporting firms are not affected by FDI, domestic firms that never export are affected negatively. They also are able to distinguish between foreign affiliates that are primarily export-oriented and the ones that sell mostly locally. The former appear to provide positive spillovers to local permanent exporters, the latter is harmful for the productivity of local non-exporters. Kokko et al. (2001) study the export decision by Uruguayan firms using cross-sectional firm-level data in 1998. They can discriminate between MNE presence in import-substituting and export-orientated industries and they find that there is only evidence 3
22
The negative (or insignificant at best) coefficient on spillovers finding seem particularly robust in transition economies. Djankov and Hoekman (2000), Konings (2001), Zukowska-Gagelmann (2000) and Damijan et al. (2001) all mostly find negative results, using firm-level data. © OECD 2006
OECD Development Centre Working Paper No. 253 DEV/DOC(2006)07
for spillovers from the latter group of multinationals. While those last results seem more promising, the overall picture of those performance regressions remain mixed at best, since the positive effects seem to be particularly rare in developing countries, concentrated in high tech industries, sensitive to the methods employed, and generally small in magnitude. A more positive picture can be drawn from “interaction effects”, some studies finding spillovers to be larger, when absorptive capacities and export orientation in the host country are high. This sounds encouraging for policy coherence, since aid policy can be targeted at promoting human capital accumulation needed for absorptive capacity, and trade policy can of course contribute to enhance the export orientation of the host economy. More empirical evidence targeted on LDCs and dealing properly with methodological issues is however needed to check the robustness of those findings. A striking conclusion after the overview of the literature in this section is that most careful studies recognise that while, there might be a statistical association between inward FDI and growth, it seems impossible to invalidate the hypothesis that those two outcomes are affected by a common cause that might in particular relate to sound economic policies. The same doubt, although tempered, also arises concerning the size of alleged spillovers from FDI to the indigenous set of firms. When controlling for the fact that foreign investors “cherry-pick” the best profit opportunities when they invest in a developing country, the “true” impact on the productivity or exports of local firms is much lower if not negative in some case. This naturally leads most scholars to plead for more prudence in the investment promotion efforts of developing countries, and maybe for an international coordination, to avoid possibly wasteful tax or subsidy competition. A slightly more positive picture emerges when interactions with absorptive capacities or export orientation are accounted for, which suggest that policy coordination with measures that promote human capital accumulation and the improvement of trading opportunities might make FDI presence more delivering.
© OECD 2006
23
Policy Coherence for Development: A Background Paper on Foreign Direct Investment DEV/DOC(2006)07
IV. HOW AID AND FDI POLICIES INTERACT How can aid allocation policy by rich countries help fulfil the investment objectives, that is improve the attractiveness of the host country to FDI? In other words, this question amounts to asking under which circumstances aid and FDI will be complements and under which circumstances they will be substitutes. Turning back to our framework of attractive policies listed above, we have to investigate how aid policy interacts or can be amended to influence in a positive way the other domestic characteristics and in particular policy measures that attract FDI. One of the important instruments here is the conditionality of foreign aid, through which rich countries' governments can try to give incentives to developing countries to improve their overall economic environment. For instance, by conditioning aid on measurable achievements in terms of corruption reduction or democratic progresses, which can be favourable factors in the location of FDI?
IV.1 The Different Interaction Channels Aid, Corporate Taxes and Subsidies Aid received by developing countries can be seen as an additional source of budget revenue that can substitute for tax to finance certain expenditures. One could imagine then a relationship with the level of taxation, which is often presented as one of the determinants of location choice. In terms of sensitivity of location choices to differences in corporate taxes, the empirical literature points to clear-cut results. Tax differentials matter. The next and more fundamental question is: How large is the effect? A meta-analysis of the empirical literature conducted by Mooij and Ederveen (2003) and treating more than 350 point estimates, finds an average semielasticity of FDI to tax rates around -3. The impact of subsidies emerging from the literature is much more mixed (and also much scarcer due to lower access to good quality information on such investment-promotion measures). Crozet et al. (2004) study individual location choices of 3902 affiliates of multinational firms over the period 1985-95. They focus on assessing the impact of French and European regional policies through the inclusion of investment incentives and structural funds in the location choice model. Results point to very disappointing impacts of both types of measure on the actual choices of investors. It should be noted that the story is different with uncoordinated subsidies. Head et al. (1999) show some evidence of competition tournaments taking place between states in the USA. In this framework, aid can be seen as conceptually equivalent to regional policy programmes such as the European structural funds subsidy allocation based on lagging levels of 24
© OECD 2006
OECD Development Centre Working Paper No. 253 DEV/DOC(2006)07
GDP per capita among EU members. An interesting debate taking place in certain rich countries relates to fears of “double payment” from rich countries, facing strong tax competition from emerging or poor countries in addition to a substantial financial burden linked to aid flows. Baldwin and Krugman (2004) propose a very clear theoretical framework that helps to understand the issues at stake. In equilibrium, corporate taxes result from a game played by governments seeking to attract capital to their soil characterised by initial attractiveness characteristics. Remote or peripheral countries suffer from a low attractiveness due to a low level of market access, which handicaps their development and simultaneously explains why they have to adopt low tax rates. Centrally located countries, on the contrary, can take advantage of their good economic geography to tax at higher rates. The differences in tax rates are therefore endogenously explained by the same factors that motivate aid flows from central and rich countries to peripheral and poor ones. Conditioning aid flows on higher tax rates in those countries can run into a dangerous contradiction, with the first measure compensating for low attractiveness while the second one deteriorates it even more.
Aid and Transport/Communication infrastructure A recent but dynamic literature explains how low levels of transport infrastructure can dramatically lower trade opportunities and development. Aid in this type of project could clearly attract FDI for those reasons. Limao and Venables (2001) is a recent paper that uses real freight costs data (as opposed to c.i.f/f.o.b ratios) to estimate the costs of particularly high transport costs on trading possibilities and therefore growth. They first find that landlocked countries have considerably higher transport costs (estimates of their first table show that those transport costs rise by almost 74 per cent for a landlocked country). Their subsequent gravity regression analysis confirms the importance of transport infrastructure and gives an estimate of the elasticity of trade flows with respect to the trade cost factor of around -3. They find that a country with the median level of transport infrastructure has 28 per cent higher trade volumes than one at the bottom 75th percentile, an increase in trade equivalent to being 1 627 km closer to trading partners. The costs of transit countries’ poor transport infrastructure are also estimated to be very large, calling for coordination or supranational programmes of improvement of those infrastructures. They last detail their findings on the sub-Saharan African trade and show that the poor quality of transport infrastructure is one of the leading determinants of the poor export performances of those countries. Dollar et al. (2004) recently provided interesting firm-level evidence showing that a low level of trade and communication related infrastructure, which they label the investment climate of a city, repelled foreign investors, and made local firms less likely to become exporters. Included in their variables are comparable measures over a large number of cities in Bangladesh, Brazil, China, Honduras, India, Nicaragua, Pakistan, and Peru about time to clear customs for imports and exports, time get a fixed telephone line and importance of power losses. All factors promote FDI very strongly when they improve, and the finding is robust to standard attractiveness determinants, in particular market access variables. The authors explain that the success in some Chinese cities and most notably Shangai in attracting FDI are largely explained by the higher quality of its investment climate. Their estimate imply that in Karachi, for example, the share of foreign-invested firms in the considered sectors would go from 1 per cent to about © OECD 2006
25
Policy Coherence for Development: A Background Paper on Foreign Direct Investment DEV/DOC(2006)07
20 per cent should the country reach the level of Shangai in terms of the variables mentioned above.
Aid and Institutions While its methods are not unchallenged (see Rodrik, 2004), the literature estimating the impact that institutions have on economic development has been enormously influential. Initiated by Daron Acemoglu and co-authors (see IMF, 2003; and Acemoglu et al., 2001, for the original paper), a stream of results has shown that improving such institutions as the protection of civil and property rights, the level of economic of political freedom and the level of corruption tend to be associated with higher prosperity. Endogeneity of institutions to economic development has been the main question of interest here, and the ingenious use of historical determinants of institutions as instruments showing that causality runs the right way has shown that improving institutions favourable to investment is a possible and desirable policy for poor countries. Not surprisingly, thus, a number of authors have also studied the link between institutions and FDI. Such link could be seen as one channel through which institutions promote development in the modern era. Indeed, good institutions are supposed to exert their positive influence on development through the promotion of investment in general, which faces less uncertainty and higher expected rates of return. Because FDI is now a very large share of capital formation in poor countries (UNCTAD, 2004); the FDI-promoting effect of good institutions might be the most important channel of their overall effect on growth and development. There are several reasons why the quality of institutions may matter for attracting FDI. One is rooted on the results of the growth literature: By raising productivity prospects, good governance infrastructures may attract foreign investors. A second reason is that poor institutions can bring additional costs to FDI. This can be the case of corruption for instance (Wei, 2000). A third reason is that FDI yields sunk costs; making it is especially vulnerable to any form of uncertainty, including uncertainty stemming from poor government efficiency, policy reversals, graft or weak enforcement of property rights and of the legal system in general. A number of authors have empirically studied the impact of institutions on FDI. Wei (1997, 2000) pointed out corruption as a significant impediment to inward FDI, with both a strong statistical and economic impact. This result has been challenged by Stein and Daude (2001) who point out the high collinearity between their measure of corruption and GDP per capita, which can lead to spurious results when GDP per capita is not included in the equation. Using a wider range of institution variables, they nevertheless show inward FDI to be significantly influenced by the quality of institutions. More specifically, five out of six governance indicators provided by Kaufman et al. (1999) are shown to matter: Political instability and violence, government effectiveness, regulatory burden, rule of law and graft. Only the voice and accountability indicator appears to be a non significant determinant of FDI. Further regressions, using International Country Risk Guide and La Porta et al. (1998) indicators, show risk of repudiation of contracts by government, risk of expropriation and shareholder rights to matter. Bénassy-Quéré et al. (2005) also use the gravity specification to study the effect of institutional distance between the host and the source country on FDI. For instance, it is possible that corruption in the host country is less an impediment to FDI inflows when corruption is also quite high in the source country and investors are used to deal with it in the home country. More 26
© OECD 2006
OECD Development Centre Working Paper No. 253 DEV/DOC(2006)07
generally, if institutions are dependent on economic and social history (including the colonisation era), then one could observe more FDI, other things equal, amongst countries displaying relatively similar institutions. Indeed, Globerman and Shapiro (2002) find that US multinationals are more likely to invest in countries whose legal systems are rooted in English Common Law.
IV.2 The Empirical Relationship Between Bilateral FDI and Bilateral Aid Flows How does aid policy affect the investment policy on the matter of institutions? The matter is debated in the literature and essentially depends on the determinants of aid flows. As Alesina and Dollar (2000) and Alesina and Weder (2002) point out, there are various reasons why a rich country might send large amounts to a poor country. Those reasons range from pure altruistic poverty reducing motives, to more strategic, policy or economic oriented self-interests of the donor. The conditionality of aid, and its impact on institutions (and therefore indirectly on FDI) will depend on the motivation of aid. Less strategically motivated flows are likely to be more demanding in terms of transparency and effectiveness in the use of aid flows because the donor country does not expect a return from its gift in terms of external policy interests or higher exports. On the other extreme, aid motivated by political alliances might even delay needed institutional reforms by relaxing the budget constraint on governments choosing bad policies. The literature finds, as might be expected, that countries having few historic ties with developing countries, such as Nordic countries, are more influenced by income levels and the quality of institutions, such as democracy or low levels of corruption in the distribution pattern of their funds. On the other hand, it is found that countries like France, Great Britain or Belgium predominantly favoured ex-colonies and political allies (together with Japan), without much regard to the politico-economic conditions of the country receiving funds in the period 1970-94 (Alesina and Dollar, 2000). Berthélemy (2005) also shows, with improved econometric tools, that self-interest of the donor is very frequent in aid allocation, and identifies Australia, France, Italy and the United Kingdom as particularly self-motivated. Alesina and Weder (2002) also found that less corrupt governments did not receive more aid (although there is some variation among donors) and that an increase in aid has the tendency to increase levels of perceived corruption in the receiving country, although they recognise causality issues in their procedure. This result has been since then challenged by Tavares (2003). He tries to estimate the impact of received aid on the level of corruption measured in the country by the International Country Risk Guide (ICRG) index. In order to sort out causality, he takes advantage of the “proximity bias” in aid allocation by donors, which favour countries with historical linkages and geographical proximity over countries with most urgent needs or best behaviour. An index of proximity is then constructed (and used as an instrument for received aid) out of those proximity dimensions with donors, which is convincingly unaffected by changes in institutions and particularly in corruption. Received aid is robustly associated with less corruption, which is encouraging when confronted with the results mentioned above about the quite strong negative association between bad institutions (among them high corruption) and FDI received. Alesina and Weder (2002) find further positive results on democratisation. It seems to be a robust finding that democratizing countries can expect a substantial increase in the amount of aid received. However Burnside and Dollar (2000) have shown that the probability of adopting “good policies” was not affected by the amount of aid received. © OECD 2006
27
Policy Coherence for Development: A Background Paper on Foreign Direct Investment DEV/DOC(2006)07
I use in the next section bilateral OECD aid data to study how the different types of aid flows going to poor countries affect received FDI amounts. Determinants of those flows have been rarely studied at the bilateral level, and it is important to check whether those different types of aid flows have reasonable and expected determinants. Table 1 presents results of simple regressions explaining bilateral flows of aid (between 1973 and 1996) with determinants traditionally adopted in the literature. There are three sets of variables. The first one relates to economic conditions in the recipient and donor countries. The second set of variables account for various dimensions of the intensity of historical and cultural proximity between countries that can promote large aid flows. The third set of variables uses political science datasets to account for political events. The first column explains total bilateral aid, while the next ones detail results according to the type of aid flow4. Most findings already in the literature are confirmed at the detailed level, in particular the nonlinear inverted-U relationship concerning the relationship between GDP per cap of the receiving country and aid flows. As in Chauvet (2002), the turning point of the relationship is extremely low, which confirms that aid is essentially negatively related to income per capita. A lot of interesting new results emerge when detailing across aid motives. Spatial proximity and colonial relationships are crucial in all aid motives except emergency. UN vote correlation seems key in economic related aid flows like economic infrastructure of debt relief. Democratisation mostly helps receive socially oriented aid funds. Concerning the direct relation between aid and FDI, the empirical literature is scarce. Alesina and Dollar (2000) have concluded that poor countries “cannot expect much in the way of private flows”, based on the finding that FDI and aid have different determinants. This result however does not imply that a rise in aid received is unable to improve conditions for successful FDI. Furthermore, the literature does not really use the bilateral dimension of the data, by focussing on total aid received or sent by each country. Last, aid has different forms, depending on its final sector of utilisation. Aid designed for improving infrastructures or production conditions might not have the same effect as emergency assistance. A simple exercise assessing the effect of bilateral aid on bilateral FDI depending on the sector receiving aid is therefore simply missing in the literature, and I provide below a first pass at such an exercise.
IV.3 An Application The first empirical statement that can be made on the relationship between aid and direct investment is one of apparent substitutability. UNCTAD (2004, pp.4-5) writes that “FDI Inflows accounted for 72 per cent of all resource flows to developing countries, six times higher than official flows. This contrasts with the latter half of the 1980s and the early 1990s, when official flows and FDI flows were almost the same, and with the mid-1990s, when portfolio flows and FDI flows were roughly equal. FDI is therefore recognised in the Monterrey Consensus as an important source of financing for development”.
4.
28
Details on all data used in the paper are given in the data appendix. Table A-3 in the appendix presents results using a larger dataset, without use of political variables, which reduce the size of the sample somehow. Results are very comparable, and again comparable to the existing literature.
© OECD 2006
OECD Development Centre Working Paper No. 253 DEV/DOC(2006)07
Table 1. Determinants of Bilateral Aid (with Institutions) Model: Dep. variable:
(1) Total aid
(2) Inf . aid
(3) Soc. aid
(4) Prod. aid
(5) Debt aid
(6) Mult.aid
(7) Pr. .aid
(8) Em. aid
-34.30a (1.95) 1.07a
-28.03a (3.00) 2.26a
-26.84a (1.91) 0.91a
-26.09a (2.08) 0.83b
-0.25 (5.28)
-15.73a (2.84)
-27.39a (2.85)
(0.33) -0.10a
(0.53) -0.18a
(0.33) -0.08a
(0.35) -0.07a
-0.54 (0.89)
0.19 (0.40)
0.46 (0.59)
-3.67 (2.38) -1.46a
(0.02) 0.43a
(0.04) 0.38a
(0.02) 0.30a
(0.03) 0.33a
0.04 (0.07) 0.38a
-0.02 (0.03) 0.23a
-0.04 (0.05) 0.40a
(0.03) 1.39a
(0.04) 0.42b
(0.03) 1.13a
(0.03) 1.00a
(0.06)
(0.03) 0.52b
(0.04) 1.09a
0.02 (0.03) 0.58a
(0.14) 0.65a
(0.19) 0.56 a
(0.14) 0.48a
(0.15) 0.50a
(0.21) 0.37a
(0.22) 0.43a
(0.21) 0.07a
(0.05) -0.28a (0.07) -0.34a
(0.03) -0.26a (0.06)
(0.04) -0.29a (0.06)
(0.11)
-0.09 (0.08)
0.37 (0.23)
(0.05) -0.33a (0.09) 0.22b
-0.30 (0.52) 0.59a
-0.60 (0.52)
(0.09) -0.99a
(0.11)
Contiguity
(0.09) -0.42c
0.08 (0.08) -1.73b
(0.04) -0.23a (0.09) -0.28a
(0.04)
Common language
(0.04) -0.39a (0.06) 0.30a
Intercept ln GDP/cap. rec. country ln GDP/cap. sq., rec. ctry. ln pop. rec. country ln GDP/cap donor ctry. ln GDP donor ctry. ln distance
Pair ever in colonial rel.
(0.23) 1.08a
(0.73) 0.98a
-0.05 (0.24) 0.62a
(0.12)
(0.19)
0.27 (0.20) 2.00a
-0.19 (0.19) 3.35a
-0.04 (0.13) 0.73c (0.38)
(0.38) 2.83a
(0.10) 4.49a
(0.10) 0.00a
(0.13) 2.39a
(0.15) 4.40a
(0.00) 5.01a
(0.40)
(0.23)
(0.00)
(0.30) -2.88a (0.48)
(0.27)
0.07 (0.07)
0.07 (0.05)
0.06 (0.05)
-0.02 (0.11)
0.03 (0.07)
(0.37) 0.10c
(0.46) 0.21a
(0.06)
(0.07)
-0.20 (0.14)
-0.01 (0.09) 0.15a
0.02 (0.11)
-0.12 (0.20)
0.09 (0.12)
-0.13 (0.10)
0.06 (0.05)
-0.02 (0.11)
0.01 (0.07)
0.02 (0.06)
-0.09 (0.13) 0.21a (0.07) 0.45a (0.13)
1.04a (0.20) 2.70a
0.10 (0.14) 3.05a
(0.12) 4.42a
(0.15) 7.13a
War
(0.23) 0.08c
Civil war
(0.05) -0.23a
War t-1
(0.08) 0.09c (0.05)
(0.19) 0.84a
-0.03 (0.07)
(0.13) 1.88a
(0.15) 3.53a
USA-Israel dummy
(0.17)
(0.12) 0.37a
(0.11)
USA-Egypt dummy
0.02 (0.07) -0.40b
(0.04)
0.14 (0.25) 2.14a
(0.11)
UN vote correlation
(0.12) 0.60a
-1.01 0.97 0.83a
-0.18 (0.38)
(0.50) 0.10b
-0.03 (0.06)
(0.05)
-0.20 (0.15) -0.54c (0.32) 0.00a
Civil war t-1
0.27a (0.08)
0.17 (0.13)
0.15 (0.09)
0.06 (0.11)
0.09 (0.22)
0.02 (0.12)
0.29a (0.10)
Democracy index
-0.07 (0.14) 0.42a
0.09 (0.23)
0.07 (0.17) 0.27c
0.26 (0.17)
-0.07 (0.38)
0.14 (0.21)
-0.07 (0.19) 0.59a
0.25 (0.24) -0.46b
Democracy index t-1
(0.14)
0.23 (0.24)
(0.16)
-0.26 (0.16)
0.24 (0.39)
-0.13 (0.21)
(0.19)
(0.23)
N R2 RMSE
13 215 0.323 1.671
5 330 0.27 1.698
8 285 0.254 1.544
6 958 0.267 1.487
1 547 0.249 1.719
3 674 0.197 1.468
5 726 0.287 1.524
2 653 0.14 1.359
Notes: Standard errors are in parentheses with a, b and c denoting significance at the 1 per cent, 5 per cent and 10 per cent levels respectively. The dependent variable are described as follows: Total aid = ln total bilateral aid; Inf. aid = ln bilateral economic infrastructure aid; Soc. Aid = ln bilateral aid for social infrastructure; Prod. Aid = ln bilateral aid for production sectors; Debt aid = ln bilateral debt relief; Mult aid = ln bilateral multisector aid; Pr. aid = ln bilateral programme assistance aid; and Em. Aid = ln bilateral emergency aid. See the Data Appendix for further description of both the dependent and independent variables. Source: See the Data Appendix for a full description of data sources.
© OECD 2006
29
Policy Coherence for Development: A Background Paper on Foreign Direct Investment DEV/DOC(2006)07
Figure 2. Inward FDI and Aid Committed to the Sample of Developing Countries
Our sample confirms those statements, as appears in Figure 2 plotting the evolution of the FDI and aid flows variables used in our regressions. While the two types of flows are relatively comparable at the start of the sample, there is a massive divergence around the start of the nineties, with falling aid flows, and rapidly expanding FDI inflows for our sample of developing countries. When looking at the geographical distribution of FDI and aid flows in our sample, sharp contrasts again emerge. Figures 3 and 4, report FDI and aid flows by geographical region at the beginning and at the end of the time span covered in our regressions. Countries in America and in Eastern Asia receive a very large share of FDI, while Southern Asia performs very poorly in terms of private investment, compared to its population size, while receiving large amounts of aid naturally due to low GDP per capita of countries in the region and notably India. The debate about the effect of regional policy subsidies on the location of activities can be usefully brought back here. After all, poor countries need aid because they are unable to generate economic conditions that attract sufficient amounts of investment, whether domestic or foreign. Low levels of profitability for investors in a certain host country, brings simultaneously low levels of income per capita, and relatively large amounts of aid. It is however possible that an exogenous increase in the amount of aid received, holding development level constant, can help attract FDI. One therefore critically needs to control for the level of development of the receiving country. Also it is important to detail which type of aid is received in order to assess whether certain types of project are more effective than others to generate private flows of investment. I use the gravity model of bilateral FDI, detailed in equation 2 to study how received aid affects the amount of FDI hosted by the country. The dependent variable is the log of bilateral FDI flows, and comes from the OECD bilateral FDI dataset, where the data is available from 1980 to 2001. It should be noted that the North-South part of this dataset mostly concerns flows from OECD member countries to emerging countries, with very little data available concerning least developed countries. A crucial part of the exercise is to assess which elements of aid policies seem most effective in raising levels of FDI received. Table 2 presents results for overall aid received, Tables 3, 4 and 5 detail results for aid falling under the economic infrastructure, social infrastructure and production sectors categories in the OECD data respectively. In each of those tables, I test several specifications, in order to assess the robustness of the various effects found. Also the amount of bilateral and total
30
© OECD 2006
OECD Development Centre Working Paper No. 253 DEV/DOC(2006)07
received aid are distinguished each time, since bilateral aid and bilateral FDI can be correlated due to unobservable characteristics of the country dyad, without much causation involved. Figure 3. FDI and Aid by Region, Period One
Source: See Data Appendix.
Figure 4. FDI and Aid by Region, Period Two
Source: See Data Appendix
The basic gravity model driving FDI flows appear in column 1 of Table 2. It incorporates the GDPs and income per capita levels of the origin and destination countries. GDPs are proxying for the economic sizes of the two countries, while GDP per capita proxy for relative production costs. A democracy index is added in order to account for the impact of institutions which was suggested to be an important determinant in the empirical literature recently. The proxies for transaction costs incorporate bilateral distance, contiguity, common language, and a dummy for colonial relationship ever. The income variables come from the World Bank WDI dataset, while the transaction costs proxies come from the CEPII distances dataset, the democracy index comes from POLITY IV, all regressions include year fixed effects (more detail available in the data appendix). Column 1 shows pooled results over the whole available country pairs, and column 2 restricts the sample to observations where bilateral aid data is non missing, that is for North-South observations. The global fit of the simple gravity framework in FDI regressions is almost as good as for trade volumes. All coefficients have usual and expected signs © OECD 2006
31
Policy Coherence for Development: A Background Paper on Foreign Direct Investment DEV/DOC(2006)07
and magnitudes, except for GDP per capita of the receiving country, which is expected to enter negatively as a proxy for production costs. The positive sign is both a sign of the imperfection of the proxy and of the already mentioned results above that production costs seem to matter much less than market access motives in FDI location. Note that market access suggested in the first section of the paper is also imperfectly proxied by the income of the host country. However each of the tables ends with a specification incorporating country-pair fixed effects, which will capture a lot of those market access and production costs determinants more precisely, together with all fixed determinants of the historical and cultural links between countries that might simultaneously affect bilateral FDI and bilateral aid. Also, it is noticeable that the democracy index has an important and positive influence in the whole sample but looses it in the North-South sample. The impact of this institutional aspects seem to be more important in distinguishing rich economies from less affluent ones, than as a determinant of choice between poor countries. Columns 3 and 4 of Table 2 include the two aid variables, columns 5 and 6 lag them (with different time lags depending on the expected time lapse between the year of aid received and its effects), while columns 7 and 8 include a country pair fixed effects and therefore forces all the influence of different variables to come from the within variation5. In terms of global aid, only the bilateral flows seem at first sight to have some impact on bilateral FDI. From column 3, we learn that a 10 per cent increase in bilateral aid received increases hosted FDI from the same country by 1.5 per cent. This might seem modest, but in reality, the variance of the aid variable in our sample is considerable. A one standard deviation in bilateral aid amounts to a 460 per cent increase in the average bilateral aid flow! Such a one s.d. deviation does then bring almost a 70 per cent increase in received bilateral FDI. It is interesting to note that when one controls for internal or external conflicts in the country (wars and civil wars dummies), total aid received achieves statistical significance at the 5 per cent level. Total aid received will normally increase during an armed conflict, while FDI will decrease (by 60 per cent for a civil war). Omitting those variables renders the independent impact of received total aid insignificant, while it is in reality positive. Its effect does not survive the lagging in columns 5 and 6 though, while bilateral aid received does. The last step to investigate the robustness of the bilateral aid effect involves controlling for unobserved characteristics of the country pair that can explain a simultaneously high level of aid and FDI. The last two columns suggest that those are indeed crucial in the effect, since the magnitude and the significance of the aid impacts drop dramatically in those specifications. This offers a much less optimistic picture than the preceding columns, although it must be noted, that the time dimension of the data is probably the one where the availability of the data is the most problematic. Faced with those disappointing results on the time dimension relationship, we proceed to detailed types of aid, to investigate whether there are more robust results to be expected there.
5.
32
Those fixed effects will therefore account for any omitted variable constant over time that might explain the correlation between bilateral aid and FDI in the cross-sectional dimension. Concerning time-varying omitted variables, note that if a shock occurs, often it will affect FDI and aid in opposite direction, like civil wars for instance. I try to control for some covariates that can have an influence in the same direction, like the democracy index for instance. While a case can be made for reverse causality, my regressions lag aid, making it hard to see how an increase in FDI could trigger aid flows in the past. © OECD 2006
OECD Development Centre Working Paper No. 253 DEV/DOC(2006)07
Table 2. The Influence of Aid on Bilateral FDI Model:
(1)
(2)
ln donor GDP
49.37a (0.49) 0.99a
49.47a (1.83) 0.98a
ln recipient GDP
(0.01) 0.76a
Intercept
(3) (4) (5) (6) Dependent variable: ln total bilateral FDI 43.21a 45.06a 43.15a 47.54a
(7)
(8)
53.33 (52.13)
198.7a (65.00) -5.99c
(2.02) 0.84a
(2.44) 0.98a
(2.30) 0.88a
(2.58) 0.99a
(0.03) 0.77a
(0.04) 0.70a
(0.05) 0.71a
(0.04) 0.68a
(0.05) 0.73a
0.72 (2.65) -3.63a
ln recip. GDP/cap
(0.01) 0.13a
(0.04) 0.36a
(0.04) 0.47a
(0.05) 0.37a
(0.05) 0.45a
(0.05) 0.36a
(1.18) 4.21a
(0.04) 0.76b
(0.05) 0.51a
(0.06) 0.37c
(0.06) 0.47b
(0.06) 0.53a
(1.17)
ln donor GDP/cap
(0.02) 1.09a
ln distance
(0.02) - 0.64a
(0.15) -0.29a
(0.16) -0.23a
(0.19) -0.23a
(0.18) -0.23a
(0.21) -0.25a
(0.05) 0.53a
(0.05) 0.39b
(0.06)
(0.06)
(0.18) 0.76a
(0.18) 0.85a
0.32 (0.23) 0.78b
(0.06) 0.45b
(0.06)
Common language
(0.02) 1.58a
(0.29) 1.29a
(0.28) 1.15a
(0.37) 0.99a
(0.18)
(0.18)
(0.22)
-0.04 (0.14)
0.01 (0.14)
0.16 (0.16) 0.08b
Contiguity Pair ever in colonial relationship Democracy index
0.06 (0.08) 0.86a (0.08) 0.28a (0.09)
ln total aid received
0.00 (0.03) 0.15a
ln total bilateral aid
(0.02)
(0.21) 1.00a (0.31) 1.16a (0.20)
-1.01 (2.60)
(3.25) -5.24a (1.63) 5.75a (1.60) 5.87c (3.14)
0.19 (0.24) 0.80b (0.37) 1.13a (0.23)
(0.04) 0.12a
War
(0.03) -0.49a
Civil War
(0.10) -0.93a (0.20)
ln total aid received, t-1 ln total bilateral aid, t-1 Democracy index
-0.03 (0.04) 0.15a
0.04 (0.04) 0.14a (0.03)
0.06 (0.04) 0.00 (0.02)
0.03 (0.05) 0.01 (0.02)
(0.02) -0.06 (0.16)
0.11 (0.17)
-0.48c (0.28)
-0.39 (0.31)
-0.64a (0.11) -0.85a
War t-1 Civil War t-1
-0.06 (0.10) -0.57a
(0.20) Year fixed effects Cntry. Pair fixed eff. N R2 RMSE
(0.18)
YES NO
YES NO
YES NO
YES NO
YES NO
YES NO
YES YES
YES YES
17 704 0.586 0.116
2 995 0.376 0.028
2 995 0.387 0.01
1 996 0.407 1.955
2 327 0.397 1.967
1 737 0.44 1.883
2 327 0.286 1.24
1 737 0.299 1.161
Standard errors are in parentheses. The superscripts a, b and c denote significance at the 1 per cent, 5 per cent and 10 per cent levels respectively. Source: See Data Appendix.
Note:
© OECD 2006
33
Policy Coherence for Development: A Background Paper on Foreign Direct Investment DEV/DOC(2006)07
Table 3 provides results concerning aid related to “economic infrastructure”. This heading is one of the most important candidates for our purposes, since it “covers assistance for networks, utilities and services that facilitate economic activity”, notably “equipment or infrastructure for road, rail, water and air transport, and for television, radio and electronic information networks”. Those infrastructures are supposed to help attract FDI both because it enhances the market access of the countries, and therefore the export potential of affiliates located here, and because it is likely to reduce production costs. Column 1 gives baseline results without any aid-related variables, and the following columns proceed as in Table 2: First including aid variables, then adding conflictuality of the receiving country in columns 2 and 3. The next two columns lag two years the aid variables. The last two include dyad fixed effects. Total economic infrastructure aid received is strongly associated with additional attractiveness of foreign capital. In column 4, the coefficient of 0.27 associated with a coefficient of variation of 2.69 for this variable means that a one standard deviation increase in this type of aid increase FDI received by almost 100 per cent. Note also that here only the total amount of aid received has an attractive effect, which seems quite reasonable, and suggests that the effect is less due to omitted pair-specific characteristics. However, this very strong effect seems entirely caused by the cross-sectional variation in the data here again, as can bee seen in the last two columns. This behaviour of coefficients holds for social infrastructure aid flows, which mainly involves funding of projects that are education, health or sanitary-related. Bilateral aid flows of this sort is positively associated with FDI flows, until dyad specific fixed effects are included, in the last two columns of Table 4. Only the flows of aid directly given to specific production sectors seem to differ in patterns. First, both bilateral and total aid is significant and positive. Second, total received aid of this type keeps some significance after the inclusion of fixed effects.
34
© OECD 2006
OECD Development Centre Working Paper No. 253 DEV/DOC(2006)07
Table 3. The Influence of Economic Infrastructure Aid on Bilateral FDI Model: Intercept ln donor GDP
(2) -39.15a (2.37) 0.92a
(3)
(4) (5) (6) (7) Dependent variable: ln total bilateral FDI -45.45a -35.87a -44.32a -39.21a 40.41a (2.54) (3.05) (3.19) (3.53) (102.42) 0.89a 1.09a 0.84a 1.06a 0.94
(8) 77.90 (119.02) -1.64 (5.91)
ln recipient GDP
(0.05) 0.81a
(0.05) 0.75a
(0.07) 0.77a
(0.07) 0.64a
(0.08) 0.71a
ln recipient GDP/cap
(0.05) 0.44a
(0.05) 0.71a
(0.07) 0.68a
(0.06) 0.67a
(0.08) 0.52a
-3.04 (2.10) 3.67c
(0.06)
(0.08)
(0.10)
(0.09)
(0.10)
(2.06)
3.84 (2.80)
-0.23 (0.23) -0.39a
-0.04 (0.27) -0.50a
-0.12 (0.29) -0.35a
0.23 (0.32) -0.53a
-1.11 (5.05)
2.21 (5.66)
ln distance
-0.18 (0.23) - 0.36a
Common language
(0.06) 0.41c
(0.07) 0.41c
(0.08) 0.56b
(0.08) 0.57b
(0.09) 0.71b
(0.21)
(0.21)
(0.26)
(0.27)
(0.31)
0.41 (0.41) 0.91a
0.41 (0.41) 0.89a
0.83 (0.63) 0.72a
0.22 (0.53) 0.79a
0.57 (0.70) 0.65b
(0.21)
(0.21)
(0.26)
(0.25)
(0.30)
-0.24 (0.17)
-0.07 (0.17) 0.16a
0.07 (0.21) 0.27a
(0.04)
(0.05)
0.04 (0.03)
-0.01 (0.03) -0.60a
ln econ. infrastr. aid received, t-2
0.15a (0.05)
0.22a (0.06)
0.03 (0.05)
0.02 (0.06)
ln econ. infrastr. bilateral aid, t-2
0.01 (0.03)
0.01 (0.04)
-0.05 (0.03)
-0.03 (0.03)
Democracy index. t-1
-0.33 (0.21)
-0.12 (0.24)
-0.86c (0.47)
-0.85 (0.57)
ln donor GDP/cap
Contiguity Pair ever in colonial relationship Democracy index ln economic infrastr. aid received ln bilateral infrastr. aid War
(5.21)
-3.11 (2.83)
(0.15) -0.89a (0.22)
Civil War
-0.76a (0.17) -1.11a
War, t-1 Civil War, t-1
-0.18 (0.15) -0.91a
(0.25)
(0.24)
Year fixed effects Ctry pair fixed eff.
YES NO
YES NO
YES NO
YES NO
YES NO
YES YES
YES YES
N R2 RMSE
1 349 0.399 1.753
1 349 0.412 1.736
886 0.453 1.692
861 0.369 1.649
623 0.471 1.557
861 0.335 1.051
623 0.401 0.966
Standard errors are in parentheses. The superscripts a, b and c denote significance at the 1 per cent, 5 per cent and 10 per cent levels respectively. Source: See Data Appendix.
Note:
© OECD 2006
35
Policy Coherence for Development: A Background Paper on Foreign Direct Investment DEV/DOC(2006)07
V. HOW TRADE AND FDI POLICIES INTERACT V.1 Trade Liberalisation and Inward FDI The interaction between trade and FDI policies revolves around the idea mentioned above that improving the market access of developing countries could be one of the important ways to accelerate FDI inflows into those countries attracted by new export possibilities to rich countries. While this idea is not in itself really new, the recently developed field of New Economic Geography has clarified and formalised it rigorously and made this mechanism the key mechanism behind successful development strategies. Redding and Venables (2004) surveyed above provides a rather convincing argument that increases in market access is very strongly associated with higher income per capita, through a higher profitability of the host country and subsequent attractiveness to investors (confirmed by Head and Mayer, 2004).
36
© OECD 2006
OECD Development Centre Working Paper No. 253 DEV/DOC(2006)07
Table 4. The Influence of Social Infrastructure Aid on Bilateral FDI Model:
(2)
(3)
-48.52a (2.13) 1.09a
-40.14a (2.37) 0.93a
-43.52a (2.99) 1.13a
-37.73a (3.09) 0.99a
-46.76a (3.67) 1.17a
ln recipient GDP
(0.04) 0.82a
(0.04) 0.75a
(0.06) 0.78a
(0.05) 0.73a
(0.06) 0.81a
0.90 (4.16) -5.72a
ln recipient GDP/cap
(0.05) 0.32a
(0.05) 0.38a
(0.06) 0.25a
(0.06) 0.32a
(0.07) 0.19b
(1.75) 6.17a
(2.41) 7.00a
(0.06)
(0.07)
(0.07)
(0.08)
(1.73)
ln donor GDP/cap
(0.05) 0.36b
-0.10 (0.24) -0.39a
-0.29 (0.25) -0.32a
0.07 (0.31) -0.40a
-0.75 (4.08)
ln distance
(0.18) - 0.42a
0.01 (0.19) -0.33a
(2.38) 9.21c
(0.06) 0.61a
(0.06) 0.49b
(0.07)
(0.07) 0.47c
(0.08)
Common language Contiguity
(0.22) 0.61c
(0.21) 0.87a
Pair ever in colonial relationship
(0.34) 1.26a
(0.34) 0.98a
0.74 (0.47) 0.86a
(0.41) 1.08a
0.49 (0.52) 0.12a
(0.21)
(0.21)
(0.27)
(0.26)
(0.31)
-0.07 (0.16)
-0.01 (0.16)
0.15 (0.19)
-0.06 (0.04) 0.21a
0.04 (0.05) 0.16a
(0.03)
(0.03) -0.53a
-0.15a (0.05) 0.20a
-0.08a (0.06) 0.15a
(0.03)
(0.04)
-0.09 (0.20)
War, t-1
0.04 (0.23) -0.60a
Civil war. T-1
(0.15) -1.05a
-0.01 (0.14) -1.14a
(0.30)
(0.29)
Intercept ln donor GDP
Democracy index ln social infrastr. aid received ln social infrastr. bilateral aid War
(4) (5) (6) Dependent variable: ln total bilateral FDI
0.36 (0.28)
(0.28) 0.93b
(7)
(8)
80.63 (81.24)
267.93a (101.07) -8.64c (5.08) -6.82a
(4.88)
0.23 (0.35)
(0.13) -1.00a (0.25)
Civil War ln. social infrastr. aid rec., t-2 ln social infrastr. bilateral aid, t-2 Democracy index, t-1
-0.02 (0.05)
0.03 (0.05)
-0.01 (0.03)
-0.02 (0.04)
-0.32 (0.42)
-0.28 (0.46)
Year Fixed Effects Country Pair FE
YES NO
YES NO
YES NO
YES NO
YES NO
YES YES
YES YES
N R2 RMSE
2 264 0.399 2.019
2 264 0.414 1.994
1 390 0.444 1.947
1 399 0.412 1.93
948 0.46 1.861
1 399 0.208 1.195
948 0.261 1.08
Standard errors are in parentheses. The superscripts a, b and c denote significance at the 1 per cent, 5 per cent and 10 per cent levels respectively. Source: See Data Appendix.
Note:
© OECD 2006
37
Policy Coherence for Development: A Background Paper on Foreign Direct Investment DEV/DOC(2006)07
Table 5.The Influence of Production Sector Aid on Bilateral FDI Model: Intercept ln donor GDP
(2) -40.36a (2.48) 1.01a
(3)
(4) (5) (6) (7) Dependent variable: ln total bilateral FDI -39.89a -36.71a -41.96a -37.51a 12.25 (2.69) (3.30) (3.08) (3.53) (78.83) 0.95a 1.13a 0.91a 1.09a 2.14 (0.05) (0.06) (0.06) (0.07) (4.01) 0.68a 0.67a 0.66a 0.72a -2.84c
(8) 197.78b (93.05) -5.83 (4.73) -5.44b
ln recipient GDP
(0.05) 0.78a
ln recipient GDP/cap.
(0.05) 0.38a
(0.05) 0.69a
(0.07) 0.50a
(0.06) 0.67a
(0.07) 0.48a
(1.65) 3.40b
(2.18) 5.72a
(0.06)
(0.08) -0.42c (0.22) -0.34a
(0.10)
(0.09)
(0.10)
(1.61)
(2.13)
-0.30 (0.22) - 0.27a
-0.38 (0.27) -0.46a
-0.35 (0.26) -0.32a
-0.21 (0.30) -0.39a
-2.16 (3.91)
6.26 (4.55)
(0.07)
(0.07)
(0.08)
(0.08)
(0.09)
Common language
0.20 (0.23)
0.19 (0.22)
0.25 (0.29)
0.35 (0.26)
0.21 (0.31)
Contiguity
0.31 (0.50) 1.16a
0.25 (0.49) 0.12a
0.61 (0.64) 0.77a
0.11 (0.54) 0.97a
0.74 (0.63) 0.77a
(0.22)
(0.22)
(0.27)
(0.24)
(0.28)
-0.07 (0.17)
ln production aid received
0.06 (0.17) 0.21a
0.04 (0.20) 0.19a
ln bilateral production aid
(0.05) 0.09a
(0.06) 0.08b
(0.03)
(0.04) -0.52a (0.14) -0.87a 0.19a (0.05)
0.16a (0.06) 0.09b
0.10c (0.05)
0.06 (0.05)
-0.02 (0.03)
0.00 (0.03)
-0.48 (0.38)
-0.68 (0.43)
ln donor GDP/cap. ln distance
Pair ever in colonial rel. Democracy index
War Civil war
(0.23) ln prodn. Aid received, t-1 Ln bilateral prodn. Aid, t-1
(0.04) Democracy index, t-1 War, t-1
-0.01 (0.21) -0.54a
Civil war, t-1
(0.15) -0.77a
0.10 (0.13) 0.70a
(0.25)
(0.22)
Year Fixed Eff. Ctry. Pair FE
YES NO
YES NO
YES NO
YES NO
YES NO
YES YES
YES YES
N R2 RMSE
1 486 0.393 1.851
1 486 0.41 1.826
971 0.449 1.777
1 158 0.384 1.793
845 0.437 1.744
1 158 0.289 1.118
845 0.316 1.012
Standard errors are in parentheses. The superscripts a, b and c denote significance at the 1 per cent, 5 per cent and 10 per cent levels respectively. Source: See Data Appendix
Note:
38
© OECD 2006
OECD Development Centre Working Paper No. 253 DEV/DOC(2006)07
Several trade policy recommendations emerge from those NEG predictions and empirical results (Puga and Venables, 1999; Henderson et al, 2001, are examples of papers summarizing the arguments): •
Trade facilitation between poor countries is quite likely to be an effective policy in terms of FDI attraction. This involves both transport cost reduction through infrastructure building or improvement, but also reductions in cost associated with bureaucratic or corruption burden imposed when crossing a border. Such a move improves the market potential of the whole region by increasing its “internal” demand perceived by firms (that is its size weighted by its accessibility). Although there might be issues concerning which particular countries benefit from this increased investment flows, those are likely to be sufficiently substantial to improve the economic situation of all of those. On the empirical side, Calderon and Serven (2004) show in a careful econometric analysis over the 1960-2000 period, that exogenous improvements in the level and quality of transport infrastructure plays a significant and large effect in boosting growth levels, and in reducing income inequality.
•
Temporary non reciprocal market access improvements granted by rich countries might make sense when economies of agglomeration are important, especially when increasing returns to scale are large and when progress on overall trade costs is hard or slow. Realistic models of economic geography modelling North-South trade integration show that the first best policy recommendation is to approach total free trade as quick and as much as possible, which generates a convergence mechanism between poor and rich economies. However, total and immediate trade costs abolition is simply impossible in most of the cases, if only because of incompressible transport costs. There is at the minimum a transition period, in which FDI might not be attracted by Southern countries (or might even flow in the “wrong” direction). Asymmetric opening up of “core” markets like what has been done during the transition period in Europe might well be a very reasonable step before the complete removal of formal trade barriers.
Basically, the arguments states that an improvement in market access needed to attract FDI relies on improvement in transport infrastructure for South-South trade and more on traditional trade policies issues for North-South trade, which can be solved by more generous trade policies in the multilateral arena, or through North-South preferential regional trade arrangements. Under this logic, developing countries should try to sign preferential arrangements with large industrialised countries, rather than with poorer neighbours. This view stresses the importance of North-South agreements, which rejoin the conclusions of the traditional vinerian analysis, for which this kind of agreements reduces the importance of trade diversion. An important caveat is in order here: Market access improvements are often not unidirectional. Northern exporters might also gain better access to Southern markets in the process (which is usually the way to politically “sell” the agreement at home in the North). The final effect on FDI is then uncertain. Indeed, firms in rich countries might find it even more advantageous to stay located in the North, where they enjoy good access to the largest demand in the world as well as proximity to input producers, while it is easier after the regional agreement to serve the consumers of poor markets.
© OECD 2006
39
Policy Coherence for Development: A Background Paper on Foreign Direct Investment DEV/DOC(2006)07
There are numerous empirical papers studying the impact of regional agreements on FDI inflows, which generally find reasonably large and positive effects. A recent paper by Clausing and Dorobantu (2005) studies an interesting example: the impact of future membership announcements on FDI received by various Eastern European countries during the transition period. Between 1992 and 2001, FDI stock soared in those countries from an average of 2 per cent of GDP to an average level of 40 per cent. Their regressions involve 28 host countries (both members, candidate countries, and non members), over the 1992-2001 period. EU membership in the regression increases substantially the amount of FDI received, and the most interesting results concerns announcements concerning negotiations on membership at various stages. The first announcement of the opening in negotiations in 1997 is associated with a doubling of FDI received, while the second announcements in 1997 about which countries would be part of the first or second wave of enlargement mostly benefited to second wave countries for which final membership was far more uncertain prior to the announcement. Changes in the prospects of market access of a given country therefore radically changes its attractiveness to foreign investors (a similar result was found in Bevan and Estrin, 2004). The following subsection tries to provide larger scale evidence.
V.2 An Application In this section, I investigate how the improvement in the access to rich countries market helped developing countries to attract FDI. Several strategies are possible. First I follow what has been done in the literature and include dummy variables for participation in trade liberalizing institutions that is regional preferential trading arrangements, and GATT/WTO membership. Those two dummy variables help us study the potential impact of belonging to such institutions in FDI received, but they are certainly incomplete in specifying how developing countries in general have access to the wide markets of the rich world. GSP programmes or other types of preferential relationships are harder to measure on a consistent basis, but can possibly affect “real” export opportunities in a very substantial way. Another approach can be followed which estimates in a first step, the global ease of access of each developing country in our sample to rich countries' markets. This methodology estimates the impact of national borders on imports through a comparison of internal trade with imports from various sources (see Anderson and van Wincoop, 2004, for details on this methodology and how it relates to more traditional estimates of trade costs, and Mayer and Zignago, 2005, for an application to North-South trade flows). Therefore I estimate in a first step for a large number of developing countries the quality of access granted to their exporters by different rich countries for different periods of time: 1985-89, 1990-94, and 1995-2001.This is done by estimating border effects, which will therefore provide an estimate of various trade policy measures as well as other hindrances to exports to each rich country market. There is therefore both cross sectional and time series variance in this data, and we can see in Figure 5 that an easier access to rich countries' markets helps increase the ratio of received FDI as a percent of GDP.
40
© OECD 2006
OECD Development Centre Working Paper No. 253 DEV/DOC(2006)07
Figure 5. Inward FDI and the Trade-impeding Effects of Rich Countries’ Borders
Source: See Data Appendix.
The horizontal axis in this graph represents border effects6; the vertical axis represents the average FDI/GDP ratio over the period (in logs). Each point therefore gives, for a given developing economy and period of time, the difficulty of access to rich countries' markets on the horizontal axis and how large is FDI in its GDP on the vertical one. When border effects are reduced, exports to rich countries are easier and FDI inflows increase as a percent of GDP. Proceeding to regression analysis, we can see in first column of Table 6 which takes the same data and gravity model benchmark as in the preceding section that regional agreements promote FDI, which confirms findings in the literature quoted above. What is more novel is the impact of GATT membership which also has a strong positive impact as can be seen in the second column (origin has less of an effect because almost all of them are members throughout the sample). Third column restricts the sample to North-South observations where border effect estimates, graphed in Figure 5 are available. As can be seen, the impact of regional agreements on FDI flows is mostly a North-North phenomenon. The two regional agreements kept in our sample at the stage of column 3 (NAFTA and the EU-Turkey customs union), do not increase FDI flows more than what the other gravity forces in the regression would predict. In column 4, border effects enter negatively as expected, while column 5 incorporates all three relevant determinants, and column 6 again includes dyadic fixed effects. In column 5, GATT/WTO membership appears to multiply FDI inflows by 3.6, while a one standard deviation in border effects, which represents a 20 per cent increase from the mean value, translates into a 2 per cent decrease in FDI inflows. Note that the estimate is larger when GATT membership is not in the equation, since the two are of course negatively correlated. GATT/WTO membership seems
6.
The figures, when exponentiated, tell us how much more rich countries trade with themselves than with the considered country, holding the relative sizes, prices and distances of the trading economies constant. © OECD 2006
41
Policy Coherence for Development: A Background Paper on Foreign Direct Investment DEV/DOC(2006)07
therefore to have a much larger effect on received FDI, which is also reflected by the significant within effect in column 6, where membership for a given country raises its subsequent level of received FDI by 76 per cent. Table 6. The Influence of Market Access on Bilateral FDI Model:
(1)
(3)
(4)
(5)
Dependent variable: ln total bilateral; FDI a -49.62 -46.81a -45.89a -47.35a
(6)
(0.48) 0.98a
(0.96) 1.03a
(0.97) 1.03a
(0.96) 1.04a
147.63a (17.43) -1.67b
ln recipient GDP
(0.01) 0.74a
(0.01) 0.76a
(0.02) 0.61a
(0.02) 0.60a
(0.02) 0.66a
(0.77) -6.72a
(0.01) 0.05b
(0.03) 0.12a
(0.03) 0.11a
(0.03)
ln recipient GDP/cap
(0.01) 0.10a
ln donor GDP/cap
(0.02) 1.07a
(0.02) 1.06a
(0.04) 0.92a
(0.04) 0.94a
-0.01 (0.04) 0.95a
(0.67) 6.42a
(0.02) - 0.55a (0.02) 1.59a
(0.02) -0.60a (0.02) 1.55a
(0.03) -0.51a (0.04) 1.10a
(0.03) -0.45a (0.04) 1.21a
(0.03) -0.57a (0.04) 1.04a
(0.06)
(0.06) 0.03 (0.08) 0.89a
(0.15) 0.76a
(0.15) 0.72a (0.17)
Pair ever in colonial relation
0.05 (0.08) 0.91a
(0.15) 0.69a (0.17) 1.03a
(0.17) 1.05a
1.00a (0.15)
Democracy index
(0.08) 0.24a
(0.08) -0.33a
(0.16) 0.40a
(0.16) 0.70a
(0.09) 0.55a
(0.13)
Regional agreement
(0.09) 0.64a
(0.14) -0.48b
(0.06) Destination ctry. In GATT/WTO
(0.06) 1.45a
Origin ctry. In GATT/WTO
(0.07) 0.15b
Intercept ln donor GDP
ln distance Common language Contiguity
-48.92a (0.49) 0.97a
(2)
-0.31 (0.24)
0.21 (0.14) -0.65a
(0.68) 2.19a (0.80)
-0.05 (0.20)
(0.23) 1.28a
0.34 (0.22) 0.57a
(0.09)
(0.14)
-0.17a (0.02)
-0.10a (0.02)
-0.05a (0.05)
(0.24)
(0.06) Border effect Year Fixed Effect Country. Pair FE N R2 RMSE
YES NO
YES NO
YES NO
YES NO
YES NO
YES YES
17 704 0.589 2.108
17 704 0.589 2.086
5 939 0.51 2.146
5 939 0.515 2.136
5 939 0.531 2.1
5 939 0.308 1.431
Note:
Standard errors are in parentheses. The superscripts a, b and c denote significance at the 1 per cent, 5 per cent and 10 per cent levels respectively. Source: See Data Appendix.
42
© OECD 2006
OECD Development Centre Working Paper No. 253 DEV/DOC(2006)07
VI. CONCLUSION
Assessing policy coherence from the point of view of policies trying to develop the flows of foreign investment going from rich to poor countries involves primarily an assessment of the factors influencing FDI attractiveness, and its effects on the host economy. It also consists on asking whether this objective is a sensible one, i.e. whether hosting more FDI actually helps the country grow faster or reduce poverty for instance. Finally the key questions asked is how aid and trade policies affect the amount of FDI received, and its impact on the country's development. I review the literature on FDI location choice, which stresses a trade-off between market access and production costs as a central determinant in the decision to build an affiliate abroad. In this trade-off, the empirical literature has clearly shown that access to markets has a dominant weight. Concerning the impact of FDI on economic growth or on the productivity of local firms, the empirical evidence starting with a very optimistic message stressing positive and strong impacts has become much more reserved with the development of better econometric methods using improved data. The importance of absorptive capacities, like local human capital, which can be improved by foreign aid, or of openness to trade, as channels of growth-enhancing FDI has also been quite drastically downsized by recent work. Our original empirical work, making use of bilateral aid and FDI flows from OECD datasets over the 1980-2001 period, shows that the impact of bilateral aid on foreign investment hosted, while positive, is entirely due to the unobserved fixed characteristics of the country-pair relationship, with no impact left of the impact of aid increases over time. Different trade policy and market access variables are also introduced as covariates of bilateral FDI, with more positive impacts, especially for GATT membership of the hosting economy. It is to be kept in mind that our empirical analysis only considers middle income host countries, because of lacking comparable data on the amount of FDI received in least developed country. A natural question is then to ask whether our results would hold for the rest of the developing world as well. When considering the persistent problems encountered by lowest income countries in attracting FDI combined with the fact that those countries receive a disproportionate share of emergency aid (unlikely to directly improve in a drastic way the attractiveness of the country for foreign investors), it seems unlikely that the impact of aid would be drastically more positive for those countries. However, answering rigorously the question would require new data, for instance studying the location choices of foreign investors from a single major OECD country in the whole set of developing countries across time.6 An alternative would be to look at the interaction between how aid is spent and FDI inside one of those poor 6.
The data exists to have this type of analysis carried out for the Japanese, French or American FDI for instance, who are both large investors abroad and large aid donators. © OECD 2006
43
Policy Coherence for Development: A Background Paper on Foreign Direct Investment DEV/DOC(2006)07
countries that are not in the OECD data used here. This might be one aspect where country case studies can bring new and interesting insights that cross-country panel data cannot offer. Indeed, the type of data available for cross-country regressions is necessarily incomplete and imperfect. Data on precise projects developed through foreign aid should be used to identify precise areas/industries that benefited from a development of economic infrastructure for instance, or from the level of education among the local population. Ideally this information could be coupled with firm-level data on FDI to investigate which type of project attract foreign investors, and whether some type of project make the impact of FDI on the local set of firms more positive. For instance, it has been argued that the positive impact of FDI on local firms take the form of technological spillovers through labour force turnover or voluntary knowledge transfers by multinational firms to their suppliers. Improvement in communication infrastructures or in the skill level of local workers could enhance those channels and detailed data could help us better understand those important potential FDI-related benefits of foreign aid policy.
44
© OECD 2006
OECD Development Centre Working Paper No. 253 DEV/DOC(2006)07
DATA APPENDIX •
The main dependent variable used in the paper is the log of bilateral FDI flows. The source is the electronic edition of the OECD's International Direct Investment Statistics Yearbook, latest edition, where the data are available from 1980 to 2001. Table A-1 lists countries that receive both FDI and aid in the sample, together with their first and last years of appearance in the sample and the number of potential observations.
•
Aid flow data are taken from OECD's annual publication entitled Geographical Distribution of Financial Flows to Aid Recipients. This publication offers the important advantage of distinguishing between different purposes of aid flows. Among them are:
Social Infrastructure and Services, including notably educational infrastructure, services and investment, assistance to hospitals and clinics and all assistance given for water supply, use and sanitation. Economic Infrastructure and Services includes aid towards production and distribution of energy, plus equipment or infrastructure for road, rail, water and air transport, and for television, radio and electronic information networks. Production Sectors, which groups contributions to all directly productive sectors. Multisector aid is support for projects that straddle several sectors, with a concentration on the environment, gender projects and urban and rural development. Programme Assistance covers all general developmental contributions (other than debt reorganisation) made available with no pre-imposed sector allocation. Action Relating to Debt includes debt forgiveness, rescheduling, refinancing, etc. Emergency Assistance is emergency and distress relief in cash or in kind, including food relief and aid to refugees. •
The counterpart to this quality of detail is that the flows represent commitments rather than actual disbursements, with a potentially large difference between the two in some cases. Note, however, that they seem to behave very similarly to disbursements; the results in Table 1 are comparable to those usually found in the literature (see Alesina and Dollar, 2000, or Chauvet,, 2002, for instance). Moreover, commitments can have a large signalling role for foreign investors, who can be affected by them even if not all commitments actually end up in disbursements.
•
GDP and income per capita come from the World Bank WDI data set.
•
Bilateral distance, contiguity, common language, and the dummy for colonial relationship come from the distances data set made available by CEPII at http://www.cepii.fr/anglaisgraph/bdd/distances.htm.
•
The democracy index comes from the POLITY IV project, http://www.cidcm.umd.edu/inscr/polity/.
© OECD 2006
45
Policy Coherence for Development: A Background Paper on Foreign Direct Investment DEV/DOC(2006)07
•
The data on international and internal conflicts all come from the correlates of war project, which collects very large amounts of data that can play a role in the emergence of conflicts between and within states, http://cow2.la.psu.edu/. The period covered by interstate wars is 1816–2001, while that for civil wars spans from 1816 to 1997.
•
The “UN votes” correlation variable is based on roll-call votes. This form of vote occurs when one Member State requests the recording of the vote so that its stand on an issue or the stands of others can be clearly identified. Recording must be requested before the voting starts. This annual database created by Gartzke et al. (1999) covers 1946–1996. Table A-1. Countries Receiving FDI and Aid in the Sample Country ISO ANT ARE ARG BGR BRA CHL CHN COL CRI CZE DZA EGY HKG HUN IDN IND IRN ISL ISR KOR KWT LBY MAR MEX MYS PAN PHL POL ROM RUS SAU SGP SVK SVN THA TUR TWN UKR VEN ZAF Total
46
First Year 1983 1983 1980 1982 1980 1980 1980 1983 1983 1980 1983 1982 1980 1982 1980 1980 1983 1981 1982 1980 1983 1983 1983 1980 1980 1983 1980 1982 1982 1980 1982 1980 1980 1988 1980 1980 1980 1980 1983 1982
Last Year 1997 2000 2001 2001 2001 2001 2001 2001 1998 2001 1998 2001 2001 2001 2001 2001 2001 2001 2001 2001 1998 1997 2001 2001 2001 2000 2001 2001 2001 2001 1998 2001 2001 2001 2001 2001 2001 2001 2001 2001
1980
2001
No. Potential Obs. 24 31 199 135 205 189 199 105 21 392 21 130 190 210 173 196 87 201 149 351 11 17 106 354 185 26 186 239 139 387 51 203 358 131 193 222 175 337 111 141 6 780
© OECD 2006
OECD Development Centre Working Paper No. 253 DEV/DOC(2006)07
Table A–2. Descriptive Statistics of Variables Used in the Sample Variable
Obs
Mean
FDI flows (million $) GDP/cap ($) Total aid (million $) Social infr. bilat. aid Econ. infr. bilat. aid Prod. bilat. Aid Multisector bilat. aid Assistance bilat. aid Debt relief bilat. aid Emergency bilat. aid Democracy index War in destination ctry. Civil war in dest. ctry. Common language Colony Border effect GATT member
6 579 5 603 3 347 2 511 1 545 1 690 886 538 179 983 5 843 5 814 5 056 6 579 6 579 4 357 6 579
136.9168 4443.771 67.95255 18.33349 52.02887 17.63077 11.73657 67.48271 100.2648 2.099695 .6576245 .3594771 .0803006 .0588235 .0600395 6.940441 .6546588
© OECD 2006
Std. Dev 550.3133 4987.71 258.8208 62.72741 169.2244 57.53063 49.27669 217.367 503.6642 13.36345 .3221251 .4798885 .2717849 .235312 .2375781 1.494145 .4755155
Min
Max
0 191.8416 0 0 -.7 -.1 0 0 0 0 0 0 0 0 0 3.6 0
19 352 26 351.89 5 806.3 1 200 2 714.2 786.4 656.4 1 952.1 5 806.3 210.5 1 1 1 1 1 11.9 1
47
Policy Coherence for Development: A Background Paper on Foreign Direct Investment DEV/DOC(2006)07
Table A–3. Alternative Regression Table: Determinants of Bilateral Aid (without Institutions) Model:
(1)
(2)
(3)
(4)
(5)
(6)
(7)
(8)
Dependent variable:
Total Aid
Infrastr. Aid
Social Aid
Prodn. Aid
Debt Aid
Mult. Aid
Prog. Aid
Emerg. Aid
-32.68a (1.59) 1.19a
-25.24a (2.52) 2.22a
-25.70a (1.61) 1.05a
-25.58a (1.68) 0.90a
-1.36 (4.67)
-14.27a (2.46)
-24.09a (2.14)
(0.27) -0.11a
(0.44) -0.17a
(0.29) -0.09a
(0.28) -0.08a
-0.49 (0.76)
0.19 (0.35)
0.71 (0.47)
-3.82c (2.00) -1.41a
(0.02) 0.41a
(0.03) 0.34a
(0.02) 0.31a
(0.02) 0.31a
0.04 (0.06) 0.34a
-0.02 (0.03) 0.23a
-0.06 (0.04) 0.41a
(0.03) 0.06b
(0.02) 1.15a
(0.03) 0.35b
(0.02) 1.02a
(0.02) 0.89a
(0.05)
(0.02) 0.34c
(0.03) 0.82a
(0.03) 0.59a
(0.12) 0.64a
(0.15) 0.51 a
(0.13) 0.43a
(0.13) 0.49a
(0.19) 0.36a
(0.19) 0.44a
(0.17) 0.12a
ln distance
(0.03) -0.36a
(0.04) -0.26a
(0.03) -0.27a
(0.03) -0.27a
0.03 (0.07) -0.30c
(0.04) -0.23a
(0.04) -0.29a
(0.03) -0.17b
(0.06) -0.32a
(0.05) 0.15b
(0.05)
(0.16)
(0.09) -0.89 0.70 0.81a
-0.10 (0.55) 0.59a
-0.50 (0.50)
(0.08) -1.09a
(0.10)
-0.33 (0.37) 1.09a
(0.08) -1.30c
0.34 (0.22)
(0.08) 0.26b
(0.08)
-0.09 (0.07)
(0.07) -0.30a
(0.07)
Common language
(0.05) 0.39a
(0.10)
(0.10)
UN vote correlation
(0.11) 0.43a
USA-Egypt dummy
(0.14) 3.39a
0.84a (0.18) 2.73a
-0.02 (0.13) 3.12a
USA-Israel dummy
(0.10) 4.64a
(0.13) 7.18a
(0.16) 18 154 0.17 2.116
Intercept ln GDP/cap. recipient country ln GDP/cap. sq. recipient country ln population recipient country ln GDP/cap. Donor country ln GDP donor country
Contiguity Pair ever in colonial relationship
N R2 RMSE
(0.76) 0.98a
-0.15 (0.38)
(0.38) 0.09a
-0.04 (0.12)
(0.19) 0.86a
0.03 (0.21) 0.57a
-0.09 (0.35)
(0.11)
(0.17)
-0.13 (0.15)
(0.10) 0.31a
0.33 (0.26) 2.16a
(0.12) 1.94a
(0.34) 2.82a
0.10 (0.18) 1.93a
-0.17 (0.17) 3.10a
-0.34 (0.27) 0.00a
(0.09) 4.67a
(0.09) 0.00a
(0.25) -2.91a
(0.11) 2.40a
(0.12) 4.76a
(0.00) 4.79a
(0.30)
(0.19)
(0.00)
(0.40)
(0.24)
(0.29)
(0.33)
6 528 0.271 2.028
10 340 0.249 2.01
8 490 0.281 1.955
1 719 0.239 1.967
4 366 0.213 1.883
7 063 0.295 1.24
3 456 0.1 1.161
Note: Standard errors are in parentheses. The superscripts a, b and c denote significance at the 1 per cent, 5 per cent and 10 per cent levels respectively. See note to Table 1 in the text for full descriptions of the dependent variables, all of which are in logs.
48
© OECD 2006
OECD Development Centre Working Paper No. 253 DEV/DOC(2006)07
BIBLIOGRAPHY
ACEMOGLU, D., S. JOHNSON and J. ROBINSON (2001), “The Colonial Origins of Comparative Development: An Empirical Investigation”, American Economic Review 91. AITKEN, B.J. and A.E. HARRISON (1999), “Do Domestic Firms Benefit from Direct Foreign Investment? Evidence from Venezuela”, American Economic Review 89: 605-618. ALESINA, A. and D. DOLLAR (2000), “Who Gives Foreign Aid to Whom and Why”, Journal of Economic Growth, 5:33–64. ALESINA, A. and B. WEDER (2002), “Do Corrupt Governments Receive Less Foreign Aid?” American Economic Review, 92(4): 1126-1137. AMITI, M. and B. JAVORCIK (2005), “Trade Costs and Location of Foreign Firms in China” CEPR DP4978. ANDERSON, J. and E. VAN WINCOOP (2004), “Trade Costs” Journal of Economic Literature, 42(3). BALASUBRAMANYAM, V.N., M. SALISU and D. SAPSFORD (1996), “Foreign Direct Investment and Growth in EP and IS Countries”, Economic Journal, 106 (434): 92-105. BALDWIN R. and P. KRUGMAN (2004), “Agglomeration, Integration and Tax Harmonization”, European Economic Review, 48 (1): 1-23. BARBA-NAVARETTI, G. and A.J. VENABLES (2004), Multinational Firms in the World Economy, Princeton University Press, Princeton, NJ. BECKER, S., K. EKHOLM, R. JÄCKLE and M-A. MUENDLER (2005) “Location Choice and Employment Decision: A Comparison of German and Swedish Multinationals” CEPR Discussion Paper No. 4887. BÉNASSY-QUÉRÉ, A., M. COUPET and T. MAYER (2005), “Institutional Determinants of Foreign Direct Investment”, Document de travail CEPII, 2005-05. BERTHÉLEMY, J-C. (2005), “Bilateral Donors' Interest vs. Recipients' Development Motives in Aid Allocation: Do All Donors Behave the Same?” Document de travail, Université de Paris 1, TEAM, 2005.01. BEVAN A. and S. ESTRIN (2004), “The Determinants of Foreign Direct Investment into European Transition Economies”, Journal of Comparative Economics, 32(2): 775-787. BLOMSTRÖM, M. and A. KOKKO (2003), “Human Capital and Inward FDI”, CEPR Discussion Papers 3762. BORENSZTEIN, E., J. DE GREGORIO and J-W. LEE (1998) “How Does Foreign Direct Investment Affect Economic Growth?”, Journal of International Economics, 45(1): 115-135. BUCH, C., J. KLEINERT, A. LIPPONER and F. TOUBAL (2005), “Determinants and Effects of Foreign Direct Investment: Evidence from German Firm-level Data”, Economic Policy, 2005, 51-110. BURNSIDE, C. and D. DOLLAR (2000), “Aid, Policies, and Growth”, American Economic Review, 90(4): 847–68.
© OECD 2006
49
Policy Coherence for Development: A Background Paper on Foreign Direct Investment DEV/DOC(2006)07
BUSSE M. (2004), “Trade, Environmental Regulations and the World Trade Organization: New Empirical Evidence” World Bank Policy Research Working Paper, 3361. CALDERON, C. and L. SERVÉN (2004), “The Effects of Infrastructure Development and Growth and Income Distribution”, World Bank Policy Research Working Paper, 3400. CALDERON, C., LOAYZA, N. and L. SERVÉN (2004), “Greenfield Foreign Direct Investment and Mergers and Acquisitions: Feedback and Macroeconomic Effects”, World Bank Policy Research Working Paper 3192. CARKOVIC, M. and R. LEVINE (forthcoming), “Does Foreign Direct Investment Accelerate Economic Growth?”, in T. MORAN (ed.) The Impact of Foreign Direct Investment on Development: New Measurements, New Outcomes, New Policy Approaches, Institute for International Economics, Washington, D.C. CHAUVET, L. (2002), “Socio-political Instability and the Allocation of International Aid by Donors”, European Journal of Political Economy, 19:33–59. CROZET, M., T. MAYER and J.L. MUCCHIELLI (2004), “How Do Firms Agglomerate? A Study of FDI in France”, Regional Science and Urban Economics, 34(1): 27-54. CLAUSING, K. and C. DOROBANTU (2005), “Re-entering Europe: Does European Union Candidacy Boost Foreign Direct Investment?”, Economics of Transition, 13(1):77–103. DAMIJAN, J. P., B. MAJCEN, M. KNELL and M. ROJEC (2001), “The Role of FDI, Absorptive Capacity and Trade in Transferring Technology to Transition Countries: Evidence from Firm Panel Data for Eight Transition Countries”, mimeo, UN Economic Commission for Europe, Geneva. DJANKOV, S. and B. HOEKMAN (2000), “Foreign Investment and Productivity Growth in Czech Enterprises". World Bank Economic Review, 14: 49-64. DOLLAR, D., HALLWARD-DRIEMEIER, M. and T. MENGISTAE (2004), “Investment Climate and International Integration”, World Bank Policy Research Working Paper Series, No. WPS 3323. EGGER, P. and M. PFAFFERMAYR (2004), “The Effect of Bilateral Investment Treaties on FDI”, Journal of Comparative Economics 32(4), 2004, pp. 788-804. ESKELAND G. and A. HARRISON (2003), “Moving to Greener Pastures? Multinationals and the Pollution Haven Hypothesis”, Journal of Development Economics, 70: 1–23. FUJITA, M. and J-F THISSE (2002), Economics of Agglomeration; Cities, Industrial Location and Regional Growth, Cambridge University Press, Cambridge FUJITA, M., P. KRUGMAN and A. VENABLES (1999), The Spatial Economy: Cities, Regions, and International Trade, MIT Press, Cambridge, MA. GARTZKE, E., D.–J. JO and R. TUCKER (1999), “The Similarity of UN Policy Positions, 1946-96. Version 1.17”, http://www.vanderbilt.edu/~rtucker/data/affinity/un/similar GLOBERMAN, S. and D. SHAPIRO (2002), “Global Foreign Direct Investment Flows: The Role of Governance Infrastructure”, World Development 30(11):1899-1919. GÖRG, H. and D. GREENAWAY (2004), “Much Ado about Nothing? Do Domestic Firms Really Benefit from Foreign Direct Investment?” World Bank Research Observer, Vol. 19, pp. 171-197. GÖRG H. and A. HIJZEN (2004), “Multinationals and Productivity Spillovers”, GEP Research Paper 2004/41.
50
© OECD 2006
OECD Development Centre Working Paper No. 253 DEV/DOC(2006)07
GÖRG H. and E. STROBL (2001), “Multinational Companies and Productivity Spillovers: A Meta-analysis”, Economic Journal 111, F723-F739. GÖRG, H. and E. STROBL (2004), “Spillovers from Foreign Firms through Worker Mobility: An Empirical Investigation”, mimeo, University of Nottingham. HALLWARD-DRIEMEIER, M. (2003), “Do Bilateral Investment Treaties Attract Foreign Direct Investment? Only A Bit — and They Could Bite” World Bank Working Paper, No. WPS 3121. HANSON, G. (2001), “Should Countries Promote Foreign Direct Investment?”, UNCTAD G-24 Discussion Paper Series. HANSON, G. (2005), “Market Potential, Increasing Returns, and Geographic Concentration”, Journal of International Economics, forthcoming. HARRIS, C. (1954), “The Market as a Factor in the Localization of Industry in the United States”, Annals of the Associaion of American Geographers, 64:315-348. HEAD, K. and T. MAYER (2004), “Market Potential and the Location of Japanese Firms in the European Union” Review of Economics and Statistics, 86(4): 959-972. HEAD, K., J. RIES and D. SWENSON (1995), “Agglomeration Benefits and Location Choice: Evidence from Japanese Manufacturing Investments in the United States”, Journal of International Economics, 38: 223–247 HEAD, K., J. RIES and D. SWENSON (1999), “Attracting Foreign Manufacturing: Investment Promotion and Agglomeration”, Regional Science and Urban Economics, 29: 197–218. HELPMAN, E. (1984), “A Simple Theory of International Trade with Multinational Corporations”, Journal of Political Economy, 92(3): 451–471. HENDERSON, V., Z. SHALIZI and A. VENABLES (2001), “Geography and Development”, Journal of Economic Geography, 1: 81-106. IMF (2003), World Economic Outlook, Chapter III, IMF, Washington, D.C. KAUFMANN, D., A. KRAAY and P. ZOIDO-LOBATÓN (1999), Aggregating Governance Indicators, World Bank, Washington, D.C. KELLER, W. (2004), “International Technology Diffusion”, Journal of Economic Literature, Vol. XLII: 752–782. KELLER, W. and S. YEAPLE (2003), “Multinational Enterprises, International Trade, and Productivity Growth: Firm-Level Evidence from the United States”, NBER Working Paper 9504. KOKKO, A., M. ZEJAN and R. TANSINI (2001), “Trade Regimes and Spillover Effects of FDI: Evidence from Uruguay”, Weltwirtschaftliches Archiv, 137: 124-149. KONINGS, J (2001), “The Effects of Foreign Direct Investment on Domestic Firms: Evidence from Firm Level Panel Data in Emerging Economies”, Economics of Transition, 9: 619-633. KRUGMAN, P.R. (1992), “A Dynamic Spatial Model”, National Bureau of Economic Research Working Paper \#4219. LA PORTA, F, A. LOPEZ-DE-SILANES, A. SHLEIFER and R. VISHNY
(1998), “Law and Finance,” Journal of Political
Economy, 106 LIMÃO, N. and A. VENABLES (2001), Infrastructure, Geographical Disadvantages and Transport Costs, The World Bank Economic Review 15, 451-479.
© OECD 2006
51
Policy Coherence for Development: A Background Paper on Foreign Direct Investment DEV/DOC(2006)07
MARKUSEN, J.R. (1984), “Multinationals, Multi-plant Economies, and the Gains from Trade”, Journal of International Economics, 16(1): 205–226. MARKUSEN, J. (2002), Multinational Firms and the Theory of International Trade, MIT Press, Cambridge, MA. MARKUSEN, J. and A. VENABLES (1998), “Multinational Firms and the New Trade Theory”, Journal of International Economics, 46(2): 183–203. MARKUSEN, J. and A. VENABLES (1999), “Foreign Direct Investment as A Catalyst for Industrial Development”, European Economic Review 43(2): 335-356. MARKUSEN, J. and A. VENABLES (2000), “The Theory of Endowment, Intra-industry, and Multinational Trade”, Journal of International Economics, 52(2): 209–234. MATALONI (2004), “Offshore Outsourcing and Multinational Companies”, http://www.bea.gov/bea/about/background/1105/Landefeld_Mataloni_Outsourcing.pdf MAYER, T. and S. ZIGNAGO (2005), “Market Access in Global and Regional Trade”, CEPII Discussion Paper 2005-02 MOOIJ DE R. and S. EDERVEEN (2003), “Taxation and Foreign Direct Investment: A Synthesis of Empirical Research”, International Tax and Public Finance, 10: 673–693. PERI, G. (2005), “Determinants of Knowledge Flows and their Effects on Innovation”, Review of Economics and Statistics, 87(2). PONCET, S. (2003), “Measuring Chinese Domestic and International Integration”, China Economic Review, 14(1): 1-22. PUGA, D. and A.J. VENABLES (1999), “Agglomeration and Economic Development: Import Substitution versus Trade Liberalisation”, Economic Journal, 109: 292-311. REDDING, S. and A. VENABLES (2004), “Economic Geography and International Inequality”, Journal of International Economics 62(1):53--82. RODRIK, D. (2004), “Getting Institutions Right”, mimeo, Harvard University, April. SMARZYNSKA-JAVORCIK, B. (2004), “Does Foreign Direct Investment Increase the Productivity of Domestic Firms? In Search of Spillovers Through Backward Linkages”, American Economic Review, 94. STEIN, E. and C. DAUDE (2001), “Institutions, Integration and the Location of Foreign Direct Investment”, Inter-American Development Bank, Washington, D.C. TAVARES, J. (2003), “Does Foreign Aid Corrupt?” Economics Letters, 79: 99–106 UNCTAD (1998), Bilateral Investment Treaties in the Mid-1990s, United Nations, New York and Geneva. UNCTAD (2004), World Investment Report, United Nations, New York and Geneva. WEI, SHANG-JIN (1997), “How Taxing is Corruption on International Investors?”, NBER Working Paper 6030. WEI, S.-J. (2000), “How Taxing Is Corruption on Internal Investors?”, The Review of Economics and Statistics, 82(1): 1-11. ZUKOWSKA-GAGELMANN, K. (2000), “Productivity Spillovers from Foreign Direct Investment in Poland”, Economic Systems, 24(3).
52
© OECD 2006
OECD Development Centre Working Paper No. 253 DEV/DOC(2006)07
OTHER TITLES IN THE SERIES/ AUTRES TITRES DANS LA SÉRIE
The former series known as “Technical Papers” and “Webdocs” merged in November 2003 into “Development Centre Working Papers”. In the new series, former Webdocs 1-17 follow former Technical Papers 1-212 as Working Papers 213-229. All these documents may be downloaded from: http://www.oecd.org/dev/wp or obtained via e-mail ([email protected]). Working Paper No.1, Macroeconomic Adjustment and Income Distribution: A Macro-Micro Simulation Model, by François Bourguignon, William H. Branson and Jaime de Melo, March 1989. Working Paper No. 2, International Interactions in Food and Agricultural Policies: The Effect of Alternative Policies, by Joachim Zietz and Alberto Valdés, April, 1989. Working Paper No. 3, The Impact of Budget Retrenchment on Income Distribution in Indonesia: A Social Accounting Matrix Application, by Steven Keuning and Erik Thorbecke, June 1989. Working Paper No. 3a, Statistical Annex: The Impact of Budget Retrenchment, June 1989. Document de travail No. 4, Le Rééquilibrage entre le secteur public et le secteur privé : le cas du Mexique, par C.-A. Michalet, juin 1989. Working Paper No. 5, Rebalancing the Public and Private Sectors: The Case of Malaysia, by R. Leeds, July 1989. Working Paper No. 6, Efficiency, Welfare Effects, and Political Feasibility of Alternative Antipoverty and Adjustment Programs, by Alain de Janvry and Elisabeth Sadoulet, December 1989. Document de travail No. 7, Ajustement et distribution des revenus : application d’un modèle macro-micro au Maroc, par Christian Morrisson, avec la collaboration de Sylvie Lambert et Akiko Suwa, décembre 1989. Working Paper No. 8, Emerging Maize Biotechnologies and their Potential Impact, by W. Burt Sundquist, December 1989. Document de travail No. 9, Analyse des variables socio-culturelles et de l’ajustement en Côte d’Ivoire, par W. Weekes-Vagliani, janvier 1990. Working Paper No. 10, A Financial Computable General Equilibrium Model for the Analysis of Ecuador’s Stabilization Programs, by André Fargeix and Elisabeth Sadoulet, February 1990. Working Paper No. 11, Macroeconomic Aspects, Foreign Flows and Domestic Savings Performance in Developing Countries: A ”State of The Art” Report, by Anand Chandavarkar, February 1990. Working Paper No. 12, Tax Revenue Implications of the Real Exchange Rate: Econometric Evidence from Korea and Mexico, by Viriginia Fierro and Helmut Reisen, February 1990. Working Paper No. 13, Agricultural Growth and Economic Development: The Case of Pakistan, by Naved Hamid and Wouter Tims, April 1990. Working Paper No. 14, Rebalancing the Public and Private Sectors in Developing Countries: The Case of Ghana, by H. Akuoko-Frimpong, June 1990. Working Paper No. 15, Agriculture and the Economic Cycle: An Economic and Econometric Analysis with Special Reference to Brazil, by Florence Contré and Ian Goldin, June 1990. Working Paper No. 16, Comparative Advantage: Theory and Application to Developing Country Agriculture, by Ian Goldin, June 1990. Working Paper No. 17, Biotechnology and Developing Country Agriculture: Maize in Brazil, by Bernardo Sorj and John Wilkinson, June 1990. Working Paper No. 18, Economic Policies and Sectoral Growth: Argentina 1913-1984, by Yair Mundlak, Domingo Cavallo, Roberto Domenech, June 1990. Working Paper No. 19, Biotechnology and Developing Country Agriculture: Maize In Mexico, by Jaime A. Matus Gardea, Arturo Puente Gonzalez and Cristina Lopez Peralta, June 1990. Working Paper No. 20, Biotechnology and Developing Country Agriculture: Maize in Thailand, by Suthad Setboonsarng, July 1990.
© OECD 2006
53
Policy Coherence for Development: A Background Paper on Foreign Direct Investment DEV/DOC(2006)07 Working Paper No. 21, International Comparisons of Efficiency in Agricultural Production, by Guillermo Flichmann, July 1990. Working Paper No. 22, Unemployment in Developing Countries: New Light on an Old Problem, by David Turnham and Denizhan Eröcal, July 1990. Working Paper No. 23, Optimal Currency Composition of Foreign Debt: the Case of Five Developing Countries, by Pier Giorgio Gawronski, August 1990. Working Paper No. 24, From Globalization to Regionalization: the Mexican Case, by Wilson Peres Núñez, August 1990. Working Paper No. 25, Electronics and Development in Venezuela: A User-Oriented Strategy and its Policy Implications, by Carlota Perez, October 1990. Working Paper No. 26, The Legal Protection of Software: Implications for Latecomer Strategies in Newly Industrialising Economies (NIEs) and Middle-Income Economies (MIEs), by Carlos Maria Correa, October 1990. Working Paper No. 27, Specialization, Technical Change and Competitiveness in the Brazilian Electronics Industry, by Claudio R. Frischtak, October 1990. Working Paper No. 28, Internationalization Strategies of Japanese Electronics Companies: Implications for Asian Newly Industrializing Economies (NIEs), by Bundo Yamada, October 1990. Working Paper No. 29, The Status and an Evaluation of the Electronics Industry in Taiwan, by Gee San, October 1990. Working Paper No. 30, The Indian Electronics Industry: Current Status, Perspectives and Policy Options, by Ghayur Alam, October 1990. Working Paper No. 31, Comparative Advantage in Agriculture in Ghana, by James Pickett and E. Shaeeldin, October 1990. Working Paper No. 32, Debt Overhang, Liquidity Constraints and Adjustment Incentives, by Bert Hofman and Helmut Reisen, October 1990. Working Paper No. 34, Biotechnology and Developing Country Agriculture: Maize in Indonesia, by Hidjat Nataatmadja et al., January 1991. Working Paper No. 35, Changing Comparative Advantage in Thai Agriculture, by Ammar Siamwalla, Suthad Setboonsarng and Prasong Werakarnjanapongs, March 1991. Working Paper No. 36, Capital Flows and the External Financing of Turkey’s Imports, by Ziya Önis and Süleyman Özmucur, July 1991. Working Paper No. 37, The External Financing of Indonesia’s Imports, by Glenn P. Jenkins and Henry B.F. Lim, July 1991. Working Paper No. 38, Long-term Capital Reflow under Macroeconomic Stabilization in Latin America, by Beatriz Armendariz de Aghion, July 1991. Working Paper No. 39, Buybacks of LDC Debt and the Scope for Forgiveness, by Beatriz Armendariz de Aghion, July 1991. Working Paper No. 40, Measuring and Modelling Non-Tariff Distortions with Special Reference to Trade in Agricultural Commodities, by Peter J. Lloyd, July 1991. Working Paper No. 41, The Changing Nature of IMF Conditionality, by Jacques J. Polak, August 1991. Working Paper No. 42, Time-Varying Estimates on the Openness of the Capital Account in Korea and Taiwan, by Helmut Reisen and Hélène Yèches, August 1991. Working Paper No. 43, Toward a Concept of Development Agreements, by F. Gerard Adams, August 1991. Document de travail No. 44, Le Partage du fardeau entre les créanciers de pays débiteurs défaillants, par Jean-Claude Berthélemy et Ann Vourc’h, septembre 1991. Working Paper No. 45, The External Financing of Thailand’s Imports, by Supote Chunanunthathum, October 1991. Working Paper No. 46, The External Financing of Brazilian Imports, by Enrico Colombatto, with Elisa Luciano, Luca Gargiulo, Pietro Garibaldi and Giuseppe Russo, October 1991. Working Paper No. 47, Scenarios for the World Trading System and their Implications for Developing Countries, by Robert Z. Lawrence, November 1991. Working Paper No. 48, Trade Policies in a Global Context: Technical Specifications of the Rural/Urban-North/South (RUNS) Applied General Equilibrium Model, by Jean-Marc Burniaux and Dominique van der Mensbrugghe, November 1991. Working Paper No. 49, Macro-Micro Linkages: Structural Adjustment and Fertilizer Policy in Sub-Saharan Africa, by Jean-Marc Fontaine with the collaboration of Alice Sindzingre, December 1991. Working Paper No. 50, Aggregation by Industry in General Equilibrium Models with International Trade, by Peter J. Lloyd, December 1991. Working Paper No. 51, Policy and Entrepreneurial Responses to the Montreal Protocol: Some Evidence from the Dynamic Asian Economies, by David C. O’Connor, December 1991. Working Paper No. 52, On the Pricing of LDC Debt: an Analysis Based on Historical Evidence from Latin America, by Beatriz Armendariz de Aghion, February 1992. Working Paper No. 53, Economic Regionalisation and Intra-Industry Trade: Pacific-Asian Perspectives, by Kiichiro Fukasaku, February 1992. Working Paper No. 54, Debt Conversions in Yugoslavia, by Mojmir Mrak, February 1992. Working Paper No. 55, Evaluation of Nigeria’s Debt-Relief Experience (1985-1990), by N.E. Ogbe, March 1992. Document de travail No. 56, L’Expérience de l’allégement de la dette du Mali, par Jean-Claude Berthélemy, février 1992. Working Paper No. 57, Conflict or Indifference: US Multinationals in a World of Regional Trading Blocs, by Louis T. Wells, Jr., March 1992. Working Paper No. 58, Japan’s Rapidly Emerging Strategy Toward Asia, by Edward J. Lincoln, April 1992. Working Paper No. 59, The Political Economy of Stabilization Programmes in Developing Countries, by Bruno S. Frey and Reiner Eichenberger, April 1992.
54
© OECD 2006
OECD Development Centre Working Paper No. 253 DEV/DOC(2006)07 Working Paper No. 60, Some Implications of Europe 1992 for Developing Countries, by Sheila Page, April 1992. Working Paper No. 61, Taiwanese Corporations in Globalisation and Regionalisation, by Gee San, April 1992. Working Paper No. 62, Lessons from the Family Planning Experience for Community-Based Environmental Education, by Winifred Weekes-Vagliani, April 1992. Working Paper No. 63, Mexican Agriculture in the Free Trade Agreement: Transition Problems in Economic Reform, by Santiago Levy and Sweder van Wijnbergen, May 1992. Working Paper No. 64, Offensive and Defensive Responses by European Multinationals to a World of Trade Blocs, by John M. Stopford, May 1992. Working Paper No. 65, Economic Integration in the Pacific Region, by Richard Drobnick, May 1992. Working Paper No. 66, Latin America in a Changing Global Environment, by Winston Fritsch, May 1992. Working Paper No. 67, An Assessment of the Brady Plan Agreements, by Jean-Claude Berthélemy and Robert Lensink, May 1992. Working Paper No. 68, The Impact of Economic Reform on the Performance of the Seed Sector in Eastern and Southern Africa, by Elizabeth Cromwell, June 1992. Working Paper No. 69, Impact of Structural Adjustment and Adoption of Technology on Competitiveness of Major Cocoa Producing Countries, by Emily M. Bloomfield and R. Antony Lass, June 1992. Working Paper No. 70, Structural Adjustment and Moroccan Agriculture: an Assessment of the Reforms in the Sugar and Cereal Sectors, by Jonathan Kydd and Sophie Thoyer, June 1992. Document de travail No. 71, L’Allégement de la dette au Club de Paris : les évolutions récentes en perspective, par Ann Vourc’h, juin 1992. Working Paper No. 72, Biotechnology and the Changing Public/Private Sector Balance: Developments in Rice and Cocoa, by Carliene Brenner, July 1992. Working Paper No. 73, Namibian Agriculture: Policies and Prospects, by Walter Elkan, Peter Amutenya, Jochbeth Andima, Robin Sherbourne and Eline van der Linden, July 1992. Working Paper No. 74, Agriculture and the Policy Environment: Zambia and Zimbabwe, by Doris J. Jansen and Andrew Rukovo, July 1992. Working Paper No. 75, Agricultural Productivity and Economic Policies: Concepts and Measurements, by Yair Mundlak, August 1992. Working Paper No. 76, Structural Adjustment and the Institutional Dimensions of Agricultural Research and Development in Brazil: Soybeans, Wheat and Sugar Cane, by John Wilkinson and Bernardo Sorj, August 1992. Working Paper No. 77, The Impact of Laws and Regulations on Micro and Small Enterprises in Niger and Swaziland, by Isabelle Joumard, Carl Liedholm and Donald Mead, September 1992. Working Paper No. 78, Co-Financing Transactions between Multilateral Institutions and International Banks, by Michel Bouchet and Amit Ghose, October 1992. Document de travail No. 79, Allégement de la dette et croissance : le cas mexicain, par Jean-Claude Berthélemy et Ann Vourc’h, octobre 1992. Document de travail No. 80, Le Secteur informel en Tunisie : cadre réglementaire et pratique courante, par Abderrahman Ben Zakour et Farouk Kria, novembre 1992. Working Paper No. 81, Small-Scale Industries and Institutional Framework in Thailand, by Naruemol Bunjongjit and Xavier Oudin, November 1992. Working Paper No. 81a, Statistical Annex: Small-Scale Industries and Institutional Framework in Thailand, by Naruemol Bunjongjit and Xavier Oudin, November 1992. Document de travail No. 82, L’Expérience de l’allégement de la dette du Niger, par Ann Vourc’h et Maina Boukar Moussa, novembre 1992. Working Paper No. 83, Stabilization and Structural Adjustment in Indonesia: an Intertemporal General Equilibrium Analysis, by David Roland-Holst, November 1992. Working Paper No. 84, Striving for International Competitiveness: Lessons from Electronics for Developing Countries, by Jan Maarten de Vet, March 1993. Document de travail No. 85, Micro-entreprises et cadre institutionnel en Algérie, par Hocine Benissad, mars 1993. Working Paper No. 86, Informal Sector and Regulations in Ecuador and Jamaica, by Emilio Klein and Victor E. Tokman, August 1993. Working Paper No. 87, Alternative Explanations of the Trade-Output Correlation in the East Asian Economies, by Colin I. Bradford Jr. and Naomi Chakwin, August 1993. Document de travail No. 88, La Faisabilité politique de l’ajustement dans les pays africains, par Christian Morrisson, Jean-Dominique Lafay et Sébastien Dessus, novembre 1993. Working Paper No. 89, China as a Leading Pacific Economy, by Kiichiro Fukasaku and Mingyuan Wu, November 1993. Working Paper No. 90, A Detailed Input-Output Table for Morocco, 1990, by Maurizio Bussolo and David Roland-Holst November 1993. Working Paper No. 91, International Trade and the Transfer of Environmental Costs and Benefits, by Hiro Lee and David Roland-Holst, December 1993. Working Paper No. 92, Economic Instruments in Environmental Policy: Lessons from the OECD Experience and their Relevance to Developing Economies, by Jean-Philippe Barde, January 1994. Working Paper No. 93, What Can Developing Countries Learn from OECD Labour Market Programmes and Policies?, by Åsa Sohlman with David Turnham, January 1994.
© OECD 2006
55
Policy Coherence for Development: A Background Paper on Foreign Direct Investment DEV/DOC(2006)07 Working Paper No. 94, Trade Liberalization and Employment Linkages in the Pacific Basin, by Hiro Lee and David Roland-Holst, February 1994. Working Paper No. 95, Participatory Development and Gender: Articulating Concepts and Cases, by Winifred Weekes-Vagliani, February 1994. Document de travail No. 96, Promouvoir la maîtrise locale et régionale du développement : une démarche participative à Madagascar, par Philippe de Rham et Bernard Lecomte, juin 1994. Working Paper No. 97, The OECD Green Model: an Updated Overview, by Hiro Lee, Joaquim Oliveira-Martins and Dominique van der Mensbrugghe, August 1994. Working Paper No. 98, Pension Funds, Capital Controls and Macroeconomic Stability, by Helmut Reisen and John Williamson, August 1994. Working Paper No. 99, Trade and Pollution Linkages: Piecemeal Reform and Optimal Intervention, by John Beghin, David Roland-Holst and Dominique van der Mensbrugghe, October 1994. Working Paper No. 100, International Initiatives in Biotechnology for Developing Country Agriculture: Promises and Problems, by Carliene Brenner and John Komen, October 1994. Working Paper No. 101, Input-based Pollution Estimates for Environmental Assessment in Developing Countries, by Sébastien Dessus, David Roland-Holst and Dominique van der Mensbrugghe, October 1994. Working Paper No. 102, Transitional Problems from Reform to Growth: Safety Nets and Financial Efficiency in the Adjusting Egyptian Economy, by Mahmoud Abdel-Fadil, December 1994. Working Paper No. 103, Biotechnology and Sustainable Agriculture: Lessons from India, by Ghayur Alam, December 1994. Working Paper No. 104, Crop Biotechnology and Sustainability: a Case Study of Colombia, by Luis R. Sanint, January 1995. Working Paper No. 105, Biotechnology and Sustainable Agriculture: the Case of Mexico, by José Luis Solleiro Rebolledo, January 1995. Working Paper No. 106, Empirical Specifications for a General Equilibrium Analysis of Labor Market Policies and Adjustments, by Andréa Maechler and David Roland-Holst, May 1995. Document de travail No. 107, Les Migrants, partenaires de la coopération internationale : le cas des Maliens de France, par Christophe Daum, juillet 1995. Document de travail No. 108, Ouverture et croissance industrielle en Chine : étude empirique sur un échantillon de villes, par Sylvie Démurger, septembre 1995. Working Paper No. 109, Biotechnology and Sustainable Crop Production in Zimbabwe, by John J. Woodend, December 1995. Document de travail No. 110, Politiques de l’environnement et libéralisation des échanges au Costa Rica : une vue d’ensemble, par Sébastien Dessus et Maurizio Bussolo, février 1996. Working Paper No. 111, Grow Now/Clean Later, or the Pursuit of Sustainable Development?, by David O’Connor, March 1996. Working Paper No. 112, Economic Transition and Trade-Policy Reform: Lessons from China, by Kiichiro Fukasaku and Henri-Bernard Solignac Lecomte, July 1996. Working Paper No. 113, Chinese Outward Investment in Hong Kong: Trends, Prospects and Policy Implications, by Yun-Wing Sung, July 1996. Working Paper No. 114, Vertical Intra-industry Trade between China and OECD Countries, by Lisbeth Hellvin, July 1996. Document de travail No. 115, Le Rôle du capital public dans la croissance des pays en développement au cours des années 80, par Sébastien Dessus et Rémy Herrera, juillet 1996. Working Paper No. 116, General Equilibrium Modelling of Trade and the Environment, by John Beghin, Sébastien Dessus, David RolandHolst and Dominique van der Mensbrugghe, September 1996. Working Paper No. 117, Labour Market Aspects of State Enterprise Reform in Viet Nam, by David O’Connor, September 1996. Document de travail No. 118, Croissance et compétitivité de l’industrie manufacturière au Sénégal, par Thierry Latreille et Aristomène Varoudakis, octobre 1996. Working Paper No. 119, Evidence on Trade and Wages in the Developing World, by Donald J. Robbins, December 1996. Working Paper No. 120, Liberalising Foreign Investments by Pension Funds: Positive and Normative Aspects, by Helmut Reisen, January 1997. Document de travail No. 121, Capital Humain, ouverture extérieure et croissance : estimation sur données de panel d’un modèle à coefficients variables, par Jean-Claude Berthélemy, Sébastien Dessus et Aristomène Varoudakis, janvier 1997. Working Paper No. 122, Corruption: The Issues, by Andrew W. Goudie and David Stasavage, January 1997. Working Paper No. 123, Outflows of Capital from China, by David Wall, March 1997. Working Paper No. 124, Emerging Market Risk and Sovereign Credit Ratings, by Guillermo Larraín, Helmut Reisen and Julia von Maltzan, April 1997. Working Paper No. 125, Urban Credit Co-operatives in China, by Eric Girardin and Xie Ping, August 1997. Working Paper No. 126, Fiscal Alternatives of Moving from Unfunded to Funded Pensions, by Robert Holzmann, August 1997. Working Paper No. 127, Trade Strategies for the Southern Mediterranean, by Peter A. Petri, December 1997. Working Paper No. 128, The Case of Missing Foreign Investment in the Southern Mediterranean, by Peter A. Petri, December 1997. Working Paper No. 129, Economic Reform in Egypt in a Changing Global Economy, by Joseph Licari, December 1997.
56
© OECD 2006
OECD Development Centre Working Paper No. 253 DEV/DOC(2006)07 Working Paper No. 130, Do Funded Pensions Contribute to Higher Aggregate Savings? A Cross-Country Analysis, by Jeanine Bailliu and Helmut Reisen, December 1997. Working Paper No. 131, Long-run Growth Trends and Convergence Across Indian States, by Rayaprolu Nagaraj, Aristomène Varoudakis and Marie-Ange Véganzonès, January 1998. Working Paper No. 132, Sustainable and Excessive Current Account Deficits, by Helmut Reisen, February 1998. Working Paper No. 133, Intellectual Property Rights and Technology Transfer in Developing Country Agriculture: Rhetoric and Reality, by Carliene Brenner, March 1998. Working Paper No. 134, Exchange-rate Management and Manufactured Exports in Sub-Saharan Africa, by Khalid Sekkat and Aristomène Varoudakis, March 1998. Working Paper No. 135, Trade Integration with Europe, Export Diversification and Economic Growth in Egypt, by Sébastien Dessus and Akiko Suwa-Eisenmann, June 1998. Working Paper No. 136, Domestic Causes of Currency Crises: Policy Lessons for Crisis Avoidance, by Helmut Reisen, June 1998. Working Paper No. 137, A Simulation Model of Global Pension Investment, by Landis MacKellar and Helmut Reisen, August 1998. Working Paper No. 138, Determinants of Customs Fraud and Corruption: Evidence from Two African Countries, by David Stasavage and Cécile Daubrée, August 1998. Working Paper No. 139, State Infrastructure and Productive Performance in Indian Manufacturing, by Arup Mitra, Aristomène Varoudakis and Marie-Ange Véganzonès, August 1998. Working Paper No. 140, Rural Industrial Development in Viet Nam and China: A Study in Contrasts, by David O’Connor, September 1998. Working Paper No. 141,Labour Market Aspects of State Enterprise Reform in China, by Fan Gang,Maria Rosa Lunati and David O’Connor, October 1998. Working Paper No. 142, Fighting Extreme Poverty in Brazil: The Influence of Citizens’ Action on Government Policies, by Fernanda Lopes de Carvalho, November 1998. Working Paper No. 143, How Bad Governance Impedes Poverty Alleviation in Bangladesh, by Rehman Sobhan, November 1998. Document de travail No. 144, La libéralisation de l’agriculture tunisienne et l’Union européenne: une vue prospective, par Mohamed Abdelbasset Chemingui et Sébastien Dessus, février 1999. Working Paper No. 145, Economic Policy Reform and Growth Prospects in Emerging African Economies, by Patrick Guillaumont, Sylviane Guillaumont Jeanneney and Aristomène Varoudakis, March 1999. Working Paper No. 146, Structural Policies for International Competitiveness in Manufacturing: The Case of Cameroon, by Ludvig Söderling, March 1999. Working Paper No. 147, China’s Unfinished Open-Economy Reforms: Liberalisation of Services, by Kiichiro Fukasaku, Yu Ma and Qiumei Yang, April 1999. Working Paper No. 148, Boom and Bust and Sovereign Ratings, by Helmut Reisen and Julia von Maltzan, June 1999. Working Paper No. 149, Economic Opening and the Demand for Skills in Developing Countries: A Review of Theory and Evidence, by David O’Connor and Maria Rosa Lunati, June 1999. Working Paper No. 150, The Role of Capital Accumulation, Adjustment and Structural Change for Economic Take-off: Empirical Evidence from African Growth Episodes, by Jean-Claude Berthélemy and Ludvig Söderling, July 1999. Working Paper No. 151, Gender, Human Capital and Growth: Evidence from Six Latin American Countries, by Donald J. Robbins, September 1999. Working Paper No. 152, The Politics and Economics of Transition to an Open Market Economy in Viet Nam, by James Riedel and William S. Turley, September 1999. Working Paper No. 153, The Economics and Politics of Transition to an Open Market Economy: China, by Wing Thye Woo, October 1999. Working Paper No. 154, Infrastructure Development and Regulatory Reform in Sub-Saharan Africa: The Case of Air Transport, by Andrea E. Goldstein, October 1999. Working Paper No. 155, The Economics and Politics of Transition to an Open Market Economy: India, by Ashok V. Desai, October 1999. Working Paper No. 156, Climate Policy Without Tears: CGE-Based Ancillary Benefits Estimates for Chile, by Sébastien Dessus and David O’Connor, November 1999. Document de travail No. 157, Dépenses d’éducation, qualité de l’éducation et pauvreté : l’exemple de cinq pays d’Afrique francophone, par Katharina Michaelowa, avril 2000. Document de travail No. 158, Une estimation de la pauvreté en Afrique subsaharienne d’après les données anthropométriques, par Christian Morrisson, Hélène Guilmeau et Charles Linskens, mai 2000. Working Paper No. 159, Converging European Transitions, by Jorge Braga de Macedo, July 2000. Working Paper No. 160, Capital Flows and Growth in Developing Countries: Recent Empirical Evidence, by Marcelo Soto, July 2000. Working Paper No. 161, Global Capital Flows and the Environment in the 21st Century, by David O’Connor, July 2000. Working Paper No. 162, Financial Crises and International Architecture: A “Eurocentric” Perspective, by Jorge Braga de Macedo, August 2000. Document de travail No. 163, Résoudre le problème de la dette : de l’initiative PPTE à Cologne, par Anne Joseph, août 2000.
© OECD 2006
57
Policy Coherence for Development: A Background Paper on Foreign Direct Investment DEV/DOC(2006)07 Working Paper No. 164, E-Commerce for Development: Prospects and Policy Issues, by Andrea Goldstein and David O’Connor, September 2000. Working Paper No. 165, Negative Alchemy? Corruption and Composition of Capital Flows, by Shang-Jin Wei, October 2000. Working Paper No. 166, The HIPC Initiative: True and False Promises, by Daniel Cohen, October 2000. Document de travail No. 167, Les facteurs explicatifs de la malnutrition en Afrique subsaharienne, par Christian Morrisson et Charles Linskens, octobre 2000. Working Paper No. 168, Human Capital and Growth: A Synthesis Report, by Christopher A. Pissarides, November 2000. Working Paper No. 169, Obstacles to Expanding Intra-African Trade, by Roberto Longo and Khalid Sekkat, March 2001. Working Paper No. 170, Regional Integration In West Africa, by Ernest Aryeetey, March 2001. Working Paper No. 171, Regional Integration Experience in the Eastern African Region, by Andrea Goldstein and Njuguna S. Ndung’u, March 2001. Working Paper No. 172, Integration and Co-operation in Southern Africa, by Carolyn Jenkins, March 2001. Working Paper No. 173, FDI in Sub-Saharan Africa, by Ludger Odenthal, March 2001 Document de travail No. 174, La réforme des télécommunications en Afrique subsaharienne, par Patrick Plane, mars 2001. Working Paper No. 175, Fighting Corruption in Customs Administration: What Can We Learn from Recent Experiences?, by Irène Hors; April 2001. Working Paper No. 176, Globalisation and Transformation: Illusions and Reality, by Grzegorz W. Kolodko, May 2001. Working Paper No. 177, External Solvency, Dollarisation and Investment Grade: Towards a Virtuous Circle?, by Martin Grandes, June 2001. Document de travail No. 178, Congo 1965-1999: Les espoirs déçus du « Brésil africain », par Joseph Maton avec Henri-Bernard Solignac Lecomte, septembre 2001. Working Paper No. 179, Growth and Human Capital: Good Data, Good Results, by Daniel Cohen and Marcelo Soto, September 2001. Working Paper No. 180, Corporate Governance and National Development, by Charles P. Oman, October 2001. Working Paper No. 181, How Globalisation Improves Governance, by Federico Bonaglia, Jorge Braga de Macedo and Maurizio Bussolo, November 2001. Working Paper No. 182, Clearing the Air in India: The Economics of Climate Policy with Ancillary Benefits, by Maurizio Bussolo and David O’Connor, November 2001. Working Paper No. 183, Globalisation, Poverty and Inequality in sub-Saharan Africa: A Political Economy Appraisal, by Yvonne M. Tsikata, December 2001. Working Paper No. 184, Distribution and Growth in Latin America in an Era of Structural Reform: The Impact of Globalisation, by Samuel A. Morley, December 2001. Working Paper No. 185, Globalisation, Liberalisation, Poverty and Income Inequality in Southeast Asia, by K.S. Jomo, December 2001. Working Paper No. 186, Globalisation, Growth and Income Inequality: The African Experience, by Steve Kayizzi-Mugerwa, December 2001. Working Paper No. 187, The Social Impact of Globalisation in Southeast Asia, by Mari Pangestu, December 2001. Working Paper No. 188, Where Does Inequality Come From? Ideas and Implications for Latin America, by James A. Robinson, December 2001. Working Paper No. 189, Policies and Institutions for E-Commerce Readiness: What Can Developing Countries Learn from OECD Experience?, by Paulo Bastos Tigre and David O’Connor, April 2002. Document de travail No. 190, La réforme du secteur financier en Afrique, par Anne Joseph, juillet 2002. Working Paper No. 191, Virtuous Circles? Human Capital Formation, Economic Development and the Multinational Enterprise, by Ethan B. Kapstein, August 2002. Working Paper No. 192, Skill Upgrading in Developing Countries: Has Inward Foreign Direct Investment Played a Role?, by Matthew J. Slaughter, August 2002. Working Paper No. 193, Government Policies for Inward Foreign Direct Investment in Developing Countries: Implications for Human Capital Formation and Income Inequality, by Dirk Willem te Velde, August 2002. Working Paper No. 194, Foreign Direct Investment and Intellectual Capital Formation in Southeast Asia, by Bryan K. Ritchie, August 2002. Working Paper No. 195, FDI and Human Capital: A Research Agenda, by Magnus Blomström and Ari Kokko, August 2002. Working Paper No. 196, Knowledge Diffusion from Multinational Enterprises: The Role of Domestic and Foreign Knowledge-Enhancing Activities, by Yasuyuki Todo and Koji Miyamoto, August 2002. Working Paper No. 197, Why Are Some Countries So Poor? Another Look at the Evidence and a Message of Hope, by Daniel Cohen and Marcelo Soto, October 2002. Working Paper No. 198, Choice of an Exchange-Rate Arrangement, Institutional Setting and Inflation: Empirical Evidence from Latin America, by Andreas Freytag, October 2002. Working Paper No. 199, Will Basel II Affect International Capital Flows to Emerging Markets?, by Beatrice Weder and Michael Wedow, October 2002. Working Paper No. 200, Convergence and Divergence of Sovereign Bond Spreads: Lessons from Latin America, by Martin Grandes, October 2002. Working Paper No. 201, Prospects for Emerging-Market Flows amid Investor Concerns about Corporate Governance, by Helmut Reisen, November 2002.
58
© OECD 2006
OECD Development Centre Working Paper No. 253 DEV/DOC(2006)07 Working Paper No. 202, Rediscovering Education in Growth Regressions, by Marcelo Soto, November 2002. Working Paper No. 203, Incentive Bidding for Mobile Investment: Economic Consequences and Potential Responses, by Andrew Charlton, January 2003. Working Paper No. 204, Health Insurance for the Poor? Determinants of participation Community-Based Health Insurance Schemes in Rural Senegal, by Johannes Jütting, January 2003. Working Paper No. 205, China’s Software Industry and its Implications for India, by Ted Tschang, February 2003. Working Paper No. 206, Agricultural and Human Health Impacts of Climate Policy in China: A General Equilibrium Analysis with Special Reference to Guangdong, by David O’Connor, Fan Zhai, Kristin Aunan, Terje Berntsen and Haakon Vennemo, March 2003. Working Paper No. 207, India’s Information Technology Sector: What Contribution to Broader Economic Development?, by Nirvikar Singh, March 2003. Working Paper No. 208, Public Procurement: Lessons from Kenya, Tanzania and Uganda, by Walter Odhiambo and Paul Kamau, March 2003. Working Paper No. 209, Export Diversification in Low-Income Countries: An International Challenge after Doha, by Federico Bonaglia and Kiichiro Fukasaku, June 2003. Working Paper No. 210, Institutions and Development: A Critical Review, by Johannes Jütting, July 2003. Working Paper No. 211, Human Capital Formation and Foreign Direct Investment in Developing Countries, by Koji Miyamoto, July 2003. Working Paper No. 212, Central Asia since 1991: The Experience of the New Independent States, by Richard Pomfret, July 2003. Working Paper No. 213, A Multi-Region Social Accounting Matrix (1995) and Regional Environmental General Equilibrium Model for India (REGEMI), by Maurizio Bussolo, Mohamed Chemingui and David O’Connor, November 2003. Working Paper No. 214, Ratings Since the Asian Crisis, by Helmut Reisen, November 2003. Working Paper No. 215, Development Redux: Reflections for a New Paradigm, by Jorge Braga de Macedo, November 2003. Working Paper No. 216, The Political Economy of Regulatory Reform: Telecoms in the Southern Mediterranean, by Andrea Goldstein, November 2003. Working Paper No. 217, The Impact of Education on Fertility and Child Mortality: Do Fathers Really Matter Less than Mothers?, by Lucia Breierova and Esther Duflo, November 2003. Working Paper No. 218, Float in Order to Fix? Lessons from Emerging Markets for EU Accession Countries, by Jorge Braga de Macedo and Helmut Reisen, November 2003. Working Paper No. 219, Globalisation in Developing Countries: The Role of Transaction Costs in Explaining Economic Performance in India, by Maurizio Bussolo and John Whalley, November 2003. Working Paper No. 220, Poverty Reduction Strategies in a Budget-Constrained Economy: The Case of Ghana, by Maurizio Bussolo and Jeffery I. Round, November 2003. Working Paper No. 221, Public-Private Partnerships in Development: Three Applications in Timor Leste, by José Braz, November 2003. Working Paper No. 222, Public Opinion Research, Global Education and Development Co-operation Reform: In Search of a Virtuous Circle, by Ida Mc Donnell, Henri-Bernard Solignac Lecomte and Liam Wegimont, November 2003. Working Paper No. 223, Building Capacity to Trade: What Are the Priorities?, by Henry-Bernard Solignac Lecomte, November 2003. Working Paper No. 224, Of Flying Geeks and O-Rings: Locating Software and IT Services in India’s Economic Development, by David O’Connor, November 2003. Document de travail No. 225, Cap Vert: Gouvernance et Développement, par Jaime Lourenço and Colm Foy, novembre 2003. Working Paper No. 226, Globalisation and Poverty Changes in Colombia, by Maurizio Bussolo and Jann Lay, November 2003. Working Paper No. 227, The Composite Indicator of Economic Activity in Mozambique (ICAE): Filling in the Knowledge Gaps to Enhance Public-Private Partnership (PPP), by Roberto J. Tibana, November 2003. Working Paper No. 228, Economic-Reconstruction in Post-Conflict Transitions: Lessons for the Democratic Republic of Congo (DRC), by Graciana del Castillo, November 2003. Working Paper No. 229, Providing Low-Cost Information Technology Access to Rural Communities In Developing Countries: What Works? What Pays? by Georg Caspary and David O’Connor, November 2003. Working Paper No. 230, The Currency Premium and Local-Currency Denominated Debt Costs in South Africa, by Martin Grandes, Marcel Peter and Nicolas Pinaud, December 2003. Working Paper No. 231, Macroeconomic Convergence in Southern Africa: The Rand Zone Experience, by Martin Grandes, December 2003. Working Paper No. 232, Financing Global and Regional Public Goods through ODA: Analysis and Evidence from the OECD Creditor Reporting System, by Helmut Reisen, Marcelo Soto and Thomas Weithöner, January 2004. Working Paper No. 233, Land, Violent Conflict and Development, by Nicolas Pons-Vignon and Henri-Bernard Solignac Lecomte, February 2004. Working Paper No. 234, The Impact of Social Institutions on the Economic Role of Women in Developing Countries, by Christian Morrisson and Johannes Jütting, May 2004. Document de travail No. 235, La condition desfemmes en Inde, Kenya, Soudan et Tunisie, par Christian Morrisson, août 2004. Working Paper No. 236, Decentralisation and Poverty in Developing Countries: Exploring the Impact, by Johannes Jütting, Céline Kauffmann, Ida Mc Donnell, Holger Osterrieder, Nicolas Pinaud and Lucia Wegner, August 2004. Working Paper No. 237, Natural Disasters and Adaptive Capacity, by Jeff Dayton-Johnson, August 2004.
© OECD 2006
59
Policy Coherence for Development: A Background Paper on Foreign Direct Investment DEV/DOC(2006)07 Working Paper No. 238, Public Opinion Polling and the Millennium Development Goals, by Jude Fransman, Alphonse L. MacDonnald, Ida Mc Donnell and Nicolas Pons-Vignon, October 2004. Working Paper No. 239, Overcoming Barriers to Competitiveness, by Orsetta Causa and Daniel Cohen, December 2004. Working Paper No. 240, Extending Insurance? Funeral Associations in Ethiopia and Tanzania, by Stefan Dercon, Tessa Bold, Joachim De Weerdt and Alula Pankhurst, December 2004. Working Paper No. 241, Macroeconomic Policies: New Issues of Interdependence, by Helmut Reisen, Martin Grandes and Nicolas Pinaud, January 2005. Working Paper No. 242, Institutional Change and its Impact on the Poor and Excluded: The Indian Decentralisation Experience, by D. Narayana, January 2005. Working Paper No. 243, Impact of Changes in Social Institutions on Income Inequality in China, by Hiroko Uchimura, May 2005. Working Paper No. 244, Priorities in Global Assistance for Health, AIDS and Population (HAP), by Landis MacKellar, June 2005. Working Paper No. 245, Trade and Structural Adjustment Policies in Selected Developing Countries, by Jens Andersson, Federico Bonaglia, Kiichiro Fukasaku and Caroline Lesser, July 2005. Working Paper No. 246, Economic Growth and Poverty Reduction: Measurement and Policy Issues, by Stephan Klasen, (September 2005). Working Paper No. 247, Measuring Gender (In)Equality: Introducing the Gender, Institutions and Development Data Base (GID), by Johannes P. Jütting, Christian Morrisson, Jeff Dayton-Johnson and Denis Drechsler (March 2006). Working Paper No. 248, Institutional Bottlenecks for Agricultural Development: A Stock-Taking Exercise Based on Evidence from SubSaharan Africa by Juan R. de Laiglesia, March 2006. Working Paper No. 249, Migration Policy and its Interactions with Aid, Trade and Foreign Direct Investment Policies: A Background Paper, by Theodora Xenogiani, June 2006. Working Paper No. 250, Effects of Migration on Sending Countries: What Do We Know? by Louka T. Katseli, Robert E.B. Lucas and Theodora Xengiani, June 2006. Document de travail No. 251, L’aide au développement et les autres flux nord-sud : complémentarité ou substitution ?, par Denis Cogneau et Sylvie Lambert, juin 2006. Working Paper No. 252, Angel or Devil? China’s Trade Impact on Latin American Emerging Markets, by Jorge Blázquez-Lidoy, Javier Rodríguez and Javier Santiso, June 2006.
60
© OECD 2006