R. Agarwal and R. K. Mishra, J. Phys. Stu. 2, 4 99 (2008)
Journal of
Physics
This article is released under the Creative Commons Attribution-NoncommercialNo Derivative Works 3.0 License.
Students
http://www.jphysstu.org
Role of high-speed solar wind streams on cosmic ray nucleonic intensity and solar/interplanetary/geomagnetic parameters during low amplitude days R. Agarwal1, R. K. Mishra2 1
2
Department of Physics, Govt. Model Science College (Autonomous), Jabalpur (M.P.) 482 001, India Computer and IT Section, Tropical Forest Research Institute, P.O.: RFRC, Mandla Road, Jabalpur (M.P.) 482 021, India E-mail:
[email protected] or
[email protected] Received 11 November 2007; received in revised form 29 July 2008; accepted 18 August 2008
Abstract - There are two types of high-speed solar wind streams classified in two categories: coronal hole associated and flare generated streams. These two types of streams are classified in two categories based on magnetic field and solar wind plasma parameters. In the present work we have studied the characteristic of cosmic ray nucleonic intensity along with solar/geomagnetic parameters and their inter correlation on the onset of highspeed solar wind streams during low amplitude days. The two types of solar wind streams (corotating streams and flare-generated streams) produced significant deviations in cosmic ray intensity and other solar/ geomagnetic parameters during low amplitude anisotropic wave train events. The cosmic ray intensity tends to decrease, whereas the solar wind velocity tends to increase after the on set of corotating stream. Both the geomagnetic activity index (Ap) and disturbance storm time index (Dst) decreases sharply from one day prior to one day after the arrival of corotating stream. Both of these are also found to depressed significantly five days after the arrival of corotating stream. Both the cosmic ray intensity as well solar wind velocity are found to decrease prior to the arrival of flare generated stream and increase after the arrival of stream with a time lag of 1 or 2 days. The solar activity (represented by sunspot numbers) increases sharply prior to the arrival of flare-generated stream up to day +3 with a significant depression on the onset of stream. It is noteworthy that both Ap and Dst index significantly depressed on the arrival of flare-generated stream, whereas both of these are found to increase prior to the arrival of stream. PACS: 96.40.Kk, 96.40. -z, 96.40.cd Keywords: cosmic ray, interplanetary magnetic field, solar wind, flare-generated streams and corotating streams.
1. Introduction The enhancement or subsidence of both high-speed solar wind streams (HSSWS) and the galactic cosmic rays in the minimum or the maximum phase of the solar cycle are interpreted in a unified manner by the concept of geometrical evolution of the general magnetic field of corona-helio-magnetosphere system. The subsidence of HSSWS in the maximum phase is understood as a braking of the solar wind streams by the tightly closed and strong coronal field lines in the lower corona in the maximum phase. 99
R. Agarwal and R. K. Mishra, J. Phys. Stu. 2, 4 99 (2008)
The decrease of the galactic cosmic rays in the maximum phase (known as the Forbush’s negative correlation between the galactic cosmic rays and solar activity or the Forbush solar cycle modulation of the galactic cosmic rays) is interpreted as a braking of galactic cosmic rays by the closed magnetic field lines at the heliopause. The high-speed solar wind streams lasting for several days are observed by satellites and spacecrafts. These HSSWS produce significant geomagnetic disturbances and variations in the level of cosmic ray intensity. The HSSWS are thus a key link in the complex chain of events that link geomagnetic activity/cosmic ray intensity to the solar activity and are therefore, of great interest to the solar terrestrial physics community [1-4]. Two types of high-speed solar wind streams namely flare generated streams (FGS) and corotating streams (CS) are found equally effective in producing cosmic ray intensity decreases. Iucci et al. [1] and Shukla et al. [5] have shown that the close correspondence between the cosmic ray intensity decreases observed by high-speed streams produced by solar flares accompanied by Forbush decreases whose amplitudes are not directly correlated with the increase in solar wind speed. These latter decreases are usually large and are dependent on the location of the solar flares. Yadav et al. [6] studied the effect of two types of HSSWS on cosmic ray intensity using the data of three neutron-monitoring stations. They reported that cosmic ray depressions associated with coronal hole streams are much smaller than the typically Forbush-like depressions and no spectral difference is found in the Forbush-like decreases between the periods before and after the polarity changes. Jadhav et al. [7] have studied the behaviour of semi-diurnal anisotropy for low amplitude anisotropic wave train events (LAEs) by comparing the average semi-diurnal amplitude for each event with 27-day or annual average semi-diurnal amplitude. They found that there is no significant difference between the two wave trains. For these LAE cases the semi-diurnal amplitude is found to be normal, which shows that the diurnal and semi-diurnal anisotropies are not related with each other for these LAEs. Number of low amplitude events has been studied and it was observed that the diurnal time of maximum consistently remains along the corotational direction for majority of the events or shifts towards later/earlier hours and the occurrence of these events do not found to depend upon the HSSWS [8-11]. The occurrence of LAE is dominant for the positively directed Bz component of IMF polarity [12]. 2. Data and analysis Using the long-term plots of the cosmic ray intensity data as well as the amplitude observed from the cosmic ray pressure corrected hourly neutron monitor (NM) data using harmonic analysis the low amplitude wave train events have been selected on the basis of following criteria: LAE events of continuous days have been selected when the amplitude of diurnal anisotropy remains lower than 0.3% on each day of the event for at least five or more days. In the selection of these types of events, special care has been taken, i.e. if there occurred any preForbush decrease or post-Forbush decrease before or after the event or the event is in recovery phase or declining phase are not considered. On the basis of above selection criteria we have selected 29 LAE events during the period 198194. The hourly CR intensity data for Deep River NM station [Geog. Lat. 46.10 (Deg.), Geog. Long. 282.50 (Deg.), Vertical cut off rigidity 1.02 (GV)] has been investigated in the present study. 3. Results and Discussion In the present study we have identified the two types of high-speed solar wind streams using the plots of hourly values of interplanetary parameters [13-17] to study the role of these two types of streams in modulating cosmic ray intensity as well as solar/geomagnetic activity parameters during LAE. 100
R. Agarwal and R. K. Mishra, J. Phys. Stu. 2, 4 99 (2008)
Low Amplitude Anisotropic Wave Train Events
Number of Events
2
1
0
3
4
5
9
CS
2
2
1
2
FGS
0
1
0
0
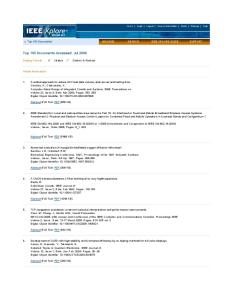
Duration (in Days) Fig. 1. Frequency histogram of high-speed solar wind streams according to the duration of high-speed streams in days: Corotating and Flare-generated for LAE events during 1981-1994.
These two types of high-speed solar wind streams namely corotating or coronal hole associated streams (CS) and the flare-generated streams (FGS) have been identified following the criteria suggested by Mavromichalaki et al. [18]. The large Forbush decreases in cosmic ray intensity if any have been excluded to avoid their influence. On the basis of above selection criteria we have identified 7 corotating streams and 1 flare-generated stream during 29 LAEs. The occurrence of these two types of HSSWS during LAE for the period 1981-94 has been plotted in Fig 1. It is clearly seen from the figure that the number of corotating streams is greater than the number of flare-generated streams and also indicates the tendency for larger duration in corotating streams during LAE. To study the effect of these streams on cosmic ray intensity as well as solar/geomagnetic activity parameters during LAE, we have plotted the data for days –6 to +6 days on the onset of these streams (CS and FGS) in Fig 2 & 3 as a percent deviation of cosmic ray intensity (for Deep River NM), solar wind velocity, sunspot numbers, Bz component of interplanetary magnetic field, geomagnetic activity index Ap and Dst along with statistical error bars (I) for the period 1981-94 during LAE. Deviation for each event is obtained from the overall average of 13 days. Zero days correspond to the starting days of the respective HSSWS. As depicted in Fig 2a the decrease in cosmic ray intensity starts from –6 day with significant deviations up to the onset of corotating stream. A sharp decease is evident, one day after the onset of stream, which continues up to +5 day. The solar wind velocity significantly decreases from its maximum (day –6) with slight deviations and reaches its minimum, one day after the onset of CS. The solar wind 101
R. Agarwal and R. K. Mishra, J. Phys. Stu. 2, 4 99 (2008)
150
a
1
100
0.5
50
Bz (%)
CRI (%)
1.5
0
0
-6 -5 -4 -3 -2 -1 0 1 2 3 4 5 6
-6 -5 -4 -3 -2 -1 0 1 2 3 4 5 6
-0.5
-50
-1
-100
b
40
50 Ap-index (%)
SWV (%)
e
100
30 20 10 0 -6 -5 -4 -3 -2 -1 0 1
2 3 4
0 -6 -5 -4 -3 -2 -1 0 1 2 3 4 5 6 -50 -100
5 6
-10
-150
-20
-200
10
200
c
0
-20 -30 -40 -50
f
100
4 5 6 Dst-index (%)
-10 -6 -5 -4 -3 -2 -1 0 1 2 3 SSN (%)
d
0 -6 -5 -4 -3 -2 -1 0 1 2 3 4 5 6 -100 -200
-60 -70
-300
Days
Days
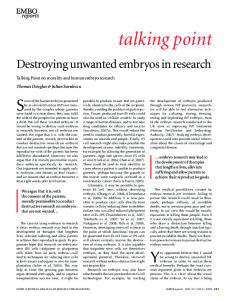
Fig. 2. Percent deviation of (a) cosmic ray intensity (for Deep River NM), (b) solar wind velocity, (c) sunspot numbers, (d) north south component of interplanetary magnetic field (Bz), (e) geomagnetic activity index Ap and (f) disturbance storm time index (Dst) along with statistical error bars (I) for days –6 to +6 on the onset of corotating stream for the period 1981-94 during LAE.
velocity then increases with some deviations up to +6 day. Here, we observe that the cosmic ray intensity tends to decrease, whereas the solar wind velocity tends to increase after the on set of CS. The solar activity as represented by sunspot numbers (Fig 2c) shows very interesting picture. The sunspot numbers significantly enhanced starting from its minimum (–6 day) and continues one day prior to the onset of CS. A significant decrease is evident in the sunspot number starting from one day after the 102
R. Agarwal and R. K. Mishra, J. Phys. Stu. 2, 4 99 (2008)
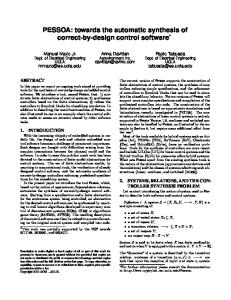
arrival of CS and continues up to its minimum (+6 day). The sunspot numbers shows a sharp decrease before and after one day of the arrival of CS. The north-south component of interplanetary magnetic field (Bz) does not show any significant trend as it fluctuates quite frequently before and after the arrival of CS. The geomagnetic activity index Ap decreases gradually one day prior to the arrival of CS up to day +1 and then increases sharply up to day +3. Ap depressed significantly from day +3 and reaches its minimum on day +5 then enhanced and reaches its usual value on day +6. It is also evident from these plots that Bz component of interplanetary magnetic field significantly enhanced, whereas geomagnetic activity index Ap depressed 5 days after the arrival of CS. The disturbance storm time index (Dst) as depicted in Fig 2e decreases sharply 4 days prior to the arrival of CS up to day –3. A significant enhancement is evident in Dst index on day +4 starting from day +1. Dst then decreases sharply and reaches its minimum on day +5. It is evident from these plots that both Ap and Dst index decreases sharply from one day prior to one day after the arrival of CS. Both of these are also found to depressed significantly five days after the arrival of CS. Fig 3a clearly demonstrate that the intensity of cosmic rays decreases very sharply from day –4 to the arrival of FGS and then significantly enhanced to reach it’s maximum on day +2. However, the solar wind velocity as depicted in Fig 3b decreases sharply from day –6 with some fluctuation on day –3 and reaches its minimum, 2 days prior to the arrival of FGS. The solar wind velocity then increases up to the arrival of FGS. The solar wind velocity is observed to increase one day after the arrival of CS and reaches its maximum on day +5. It is clearly observed from these plots that both cosmic ray intensity as well solar wind velocity are found to decrease prior to the arrival of FGS and increase after the arrival of FGS with a time lag of 1 or 2 days. The solar activity (represented by sunspot numbers) increases sharply prior to the arrival of FGS up to day +3 with a significant depression on the onset of FGS. The north south component of interplanetary magnetic field (Bz) as shown in Fig 3d increases gradually prior to the onset of FGS, whereas fluctuates quite frequently after the on set of FGS. A significant enhancement is also evident in Bz, 5 days after the arrival of FGS. The geomagnetic activity index (Ap) increases very sharply from day –5 up to the onset of FGS. Ap significantly depressed on the arrival of FGS and reaches its minimum on day +1 and then significantly enhanced and reaches its usual position on day +3. The disturbance storm time index (Dst) as depicted in Fig 3f is also found to increase sharply 5 days prior to the arrival of FGS up to the onset of FGS. Similar to the Ap index, Dst is also significantly depressed on the onset of FGS and reaches its minimum in two days interval i.e. on day +2. Dst then increases gradually with some fluctuation on day +4 and reaches its maximum on day +5. It is noteworthy from these plots that both Ap and Dst index significantly depressed on the arrival of FGS, whereas both of these are found to increase prior to the arrival of FGS. To further find out a possible correlation between these parameters we have also calculated the correlation coefficient between them, for –6 to +6 days of the arrival of both types of HSSWS (CS and FGS) and shown in Table 1 & 2. As depicted in Table 1, on the arrival of CS, the cosmic ray intensity shows a significant anti-correlation (r = - 0.73) with north south component of interplanetary magnetic field (Bz), whereas it shows a good correlation with solar wind velocity and geomagnetic activity index Ap (r = 0.55, 0.58). However, it shows nearly good anti-correlation (r = - 0.42) with disturbance storm time index (Dst), whereas it shows very weak correlation with solar activity (SSN). The north south component of IMF (Bz) is found to significantly correlate (r = 0.74) with Dst index and shows a good anti-correlation (r = - 0.56) with Ap index. Both the solar wind velocity and Dst index shows a good correlation with geomagnetic activity index (r = 0.56, - 0.53). Thus it is evident that on the arrival of corotating solar wind streams during the passage of LAE, both the cosmic ray intensity and disturbance storm time index (Dst) are found to significantly associated with north south component of interplanetary magnetic field (Bz).
103
R. Agarwal and R. K. Mishra, J. Phys. Stu. 2, 4 99 (2008)
1.5
350
a
d
1
150 Bz (%)
CRI (%)
250
0.5
50 -50 -6 -5 -4 -3 -2 -1 0 1 2 3 4 5 6 -150
0 -6 -5 -4 -3 -2 -1 0 1
2 3
4 5
6
30
-250
b
e
20
50 Ap-index (%)
SWV (%)
10 0 -10 -6 -5 -4 -3 -2 -1 0 1
2 3
4 5
6
-20 -30
-50
-6 -5 -4 -3 -2 -1 0 1 2 3 4 5 6
-150
-40 -50
-250
100
c
40
50
0 -20
-6 -5 -4 -3 -2 -1 0 1 2 3 4 5 6
-40 -60
Dst-index (%)
SSN (%)
20
f
0 -6 -5 -4 -3 -2 -1 0 1 2 3 4 5 6 -50 -100
-80 -100
-150 Days
Days
Fig. 3. Percent deviation of (a) cosmic ray intensity (for Deep River NM), (b) solar wind velocity, (c) sunspot numbers, (d) north south component of interplanetary magnetic field (Bz), (e) geomagnetic activity index Ap and (f) disturbance storm time index (Dst) along with statistical error bars (I) for days –6 to +6 on the onset of flare generated stream for the period 1981-94 during LAE.
As depicted in Table 2, on the arrival of FGS, the cosmic ray intensity shows very weak correlation with solar/interplanetary/geomagnetic parameters, whereas in case of corotating streams it shows a significant association with Bz and good correlation with solar wind velocity and Ap index. The north south component of IMF (Bz) is found to significantly correlated with both geomagnetic activity index (Ap) and disturbance storm time index (r = - 0.75, 0.72), whereas it shows nearly good anticorrelation (r = - 0.46) with solar activity (sunspot numbers). However, for corotating streams Bz shows a 104
R. Agarwal and R. K. Mishra, J. Phys. Stu. 2, 4 99 (2008)
Table 1. Correlation coefficient (r) between cosmic ray intensity and different solar/ geomagnetic parameters on the onset of Corotating streams during the passage of low amplitude anisotropic wavetrains.
Correlation Bz Coefficient (nT) (r) CRI -0.73 Bz (nT) V (km/s) Ap (nT) SSN
V (km/s)
Ap (nT)
SSN
Dst (nT)
0.55 -0.28
0.58 -0.56 0.56
0.27 -0.23 -0.21 0.06
-0.42 0.74 -0.22 -0.53 -0.09
Table 2. Correlation coefficient (r) between cosmic ray intensity and different solar/ geomagnetic parameters on the onset of Flare generated streams during the passage of low amplitude anisotropic wave trains.
Correlation Bz Coefficient (nT) (r) CRI -0.19 Bz (nT) V (km/s) Ap (nT) SSN
V (km/s)
Ap (nT)
SSN
Dst (nT)
0.24 -0.07
0.06 -0.75 0.26
0.24 -0.46 -0.15 0.44
0.05 0.72 -0.43 -0.75 -0.43
significant correlation with Dst index and a good anti-correlation with Ap index, whereas it does not show any significant association with solar activity during the passage of LAEs. The geomagnetic activity index (Ap) is found to significantly anti-correlated (r = -0.75) with Dst index and shows nearly good correlation (r = 0.44) with solar activity, whereas both the solar wind velocity and sunspot numbers shows nearly good anti-correlation (r = - 0.43) with Dst index. However, in case of FGS, the Ap index shows a good association with Dst index, whereas it does not show any association with solar activity. Both the solar wind velocity and sunspot numbers do not show any significant association with Dst index. However, the geomagnetic activity index shows a good association with both solar wind velocity and Dst index. Further it is evident that on the arrival of Flare generated solar wind streams during the passage of LAE, the geomagnetic activity index (A) is found to significantly anti-correlate with both the north south component of interplanetary magnetic field (Bz) and disturbance storm time index (Dst), whereas the disturbance storm time index (Dst) is found to significantly associated with Bz. Thus, we observed that both types of streams produce significant deviation in cosmic ray intensity as well as solar/interplanetary/geomagnetic parameters during the passage of LAE. However, the cosmic ray intensity shows a significant association with north south component of interplanetary magnetic field (Bz) on the arrival of corotating stream, whereas, it does not show any significant association with any of the solar/interplanetary/geomagnetic parameters on the onset of flare generated streams during the passage of LAE. Shrivastava and Jaiswal [19] and Shrivastava [20] reported almost equal influence of FGS and CS solar wind streams on cosmic ray transient decreases. Badruddin [21] studied the two classes, coronal hole and solar flare associated streams alongwith the observed heliospheric plasma and field parameters of these streams such as speed, field strength and its variance in a systematic manner in order to see their effects in cosmic ray modulation. He found that 105
R. Agarwal and R. K. Mishra, J. Phys. Stu. 2, 4 99 (2008)
flare associated streams are much more effective in modulation than streams from coronal holes. However, the possibility that solar wind structures during two types of streams might be different, the field variance appears to be the most critical parameter responsible for this difference in their effectiveness in modulation. Sabbah [22] studied the behavior of cosmic rays observed by three stations during a time of highspeed solar-wind events. These stations cover the median rigidity range 16-164 GV. The influence of the interplanetary magnetic field associated with HSSW has also been studied. They reported that both the cosmic-ray intensity and geomagnetic activity are enhanced by coronal-mass-ejection events. They argued that IMF magnitude and fluctuation are responsible for the depression of cosmic-ray intensity during HSSW events and this depression is rigidity dependent. Low-energy cosmic rays suffer more intensity depression. The rigidity spectrum of the cosmic-ray intensity decreases is dependent upon the phase of the solar cycle. 4.Summary and Conclusion From the present study we observe that during the passage of low amplitude anisotropic wave train events: 1. The cosmic ray intensity tends to decrease, whereas the solar wind velocity tends to increase after the on set of corotating stream. 2. Both the geomagnetic activity index (Ap) and disturbance storm time index (Dst) decreases sharply from one day prior to one day after the arrival of corotating stream. Both of these are also found to depressed significantly five days after the arrival of corotating stream. 3. Both the cosmic ray intensity as well solar wind velocity are found to decrease prior to the arrival of flare generated stream and increase after the arrival of stream with a time lag of 1 or 2 days. 4. The solar activity (represented by sunspot numbers) increases sharply prior to the arrival of flaregenerated stream up to day +3 with a significant depression on the onset of stream. 5. It is noteworthy that both Ap and Dst index significantly depressed on the arrival of flare-generated stream, whereas both of these are found to increase prior to the arrival of stream. 6. On the arrival of corotating solar wind stream during the passage of LAE, both the cosmic ray intensity and disturbance storm time index (Dst) are found to significantly associated with north south component of interplanetary magnetic field (Bz). 7. On the arrival of Flare generated solar wind streams during the passage of LAE, the geomagnetic activity index (Ap) is found to significantly anti-correlate with both the north south component of interplanetary magnetic field (Bz) and disturbance storm time index (Dst), whereas the disturbance storm time index (Dst) is found to significantly associate with Bz. Acknowledgements The authors are indebted to various experimental groups, in particular, Prof. Margret D. Wilson, Prof. K. Nagashima, Miss. Aoi Inoue and Prof. J. H. King for providing the data. We also acknowledge the use of NSSDC OMNI database and NGDC geophysical data. The authors are also very much thankful to the anonymous referees for their useful comments/suggestions. References N. Iucci, M. Parisi, M. Storini and G. Villoresi, Nuovo Cimento, 2C, 421 (1979). D. Venkatesan, A. K. Shukla, and S. P. Agrawal, Solar Phys., 81, 375 (1982). 106
R. Agarwal and R. K. Mishra, J. Phys. Stu. 2, 4 99 (2008)
H. Mavromichalaki, A. Vassilaki, E. Martmatsouri, Solar Phys., 115, 345 (1988). B. A. Lindblad, H. Lundstedt, B. Larsson, 120, 145, (1989). J.P. Shukla, A.K., Shukla, R.L. Singh, and S.P. Agrawal, Ind. J. Rad. And Space Phys., 8, 230 (1979). R. S. Yadav, N. K. Sharma, and Badruddin, Solar Phys., 151, 393 (1994). D. K. Jadhav, M. Shrivastava, A. K. Tiwari, and P. K. Shrivastava, 18th Int. Cosmic Ray Conf., Bangalore, 3, 337 (1983). S. Kumar, and M. L. Chauhan, Ind. J. Radio & Space Phys., 25, 106 (1996a). S. Kumar, and M. L. Chauhan, Ind. J. Radio & Space Phys., 25, 232 (1996b). S. Kumar, M. L. Chauhan, and S. K. Dubey, Solar Phys., 176, 403 (1997). Rajesh K Mishra, Ph.D. thesis, Rani Durgawati University, Jabalpur, INDIA (2006). S. Kumar, Rajesh K. Mishra, Rekha Agarwal Mishra, and S. K. Dubey, 29th Int. Cosmic Ray Conf., Pune, 2, 69 (2005). J. King, Interplanetary Medium Data Book-Supplement 2, NSSD/WDC-A, Goddard Space Flight Centre, Greenbelt, Maryland (1983) J. King, Interplanetary Medium Data Book-Supplement 3, NSSD/WDC-A, Goddard Space Flight Centre, Greenbelt, Maryland (1986a). J. King, Interplanetary Medium Data Book-Supplement 3A, NSSD/WDC-A, Goddard Space Flight Centre, Greenbelt, Maryland (1986b). J. King, Interplanetary Medium Data Book-Supplement 4, NSSD/WDC-A, Goddard Space Flight Centre, Greenbelt, Maryland (1989). J. King, and N. E. Papitashvili, Interplanetary Medium Data Book, NSSCD/WDC-A-R@S94-08, Goddard Space Flight Centre, Greenbelt, Maryland (1994). H. Mavromichalaki, A. Vassilaki, and E. Marmatsouri, Solar Phys., 115, 345 (1988). P. K. Shrivastava, and K. L. Jaiswal, Solar Phys., 214, 195 (2003). P. K. Shrivastava, 28th Int. Cosmic Ray Conf., Tsukaba, 3, 3731 (2003). Badruddin, Astrophys. and Space Sci., 246, 2, 171 (1996). Sabbah, Can. J. Phys./Rev. can. phys., 78, 4, 293 (2000).
107