Diversity and Distributions, (Diversity Distrib.) (2008) 14, 818–828 Blackwell Publishing Ltd
BIODIVERSITY RESEARCH
Phylogeography of the widespread marine invader Microcosmus squamiger (Ascidiacea) reveals high genetic diversity of introduced populations and non-independent colonizations Marc Rius1*, Marta Pascual2 and Xavier Turon3
1
Departament de Biologia Animal, Departament de Genètica, Universitat de Barcelona, Av. Diagonal 645, 08028 Barcelona, Spain, 3Centre d’Estudis Avançats de Blanes (CEAB, CSIC). Accés a la Cala S. Francesc, 14, 17300 Blanes (Girona), Spain
ABSTRACT
2
*Correspondence: Marc Rius, Departament de Biologia Animal, Facultat de Biologia, Universitat de Barcelona, Av. Diagonal 645, 08028 Barcelona, Spain. E-mail:
[email protected]
The spread of non-indigenous species into new marine habitats represents an increasing threat to global diversity. Genetic techniques provide basic understanding of the invasion processes. The ascidian Microcosmus squamiger is considered to be native to Australia, having been spread worldwide via transoceanic vessels. It has successfully invaded artificial and natural habitats where it has become a pest. We studied phylogeography and genetic structure of 12 M. squamiger populations, including samples from its native range (Australia) and introduced populations from the Indian, Pacific, and Atlantic oceans, as well as the Mediterranean Sea. We amplified 574 bp of the mitochondrial COI gene in 258 individuals and found a total of 52 haplotypes. A haplotype tree revealed two main groups of haplotypes. The relative frequency of each group of haplotypes, multidimensional scaling, and analysis of molecular variance showed important differences between the western Australia localities and the remaining ones (eastern Australia and introduced populations). Furthermore, we found that the colonization of the different areas by M. squamiger has not occurred independently, as many introduced populations shared some low frequency alleles. A nested clade analysis showed a global pattern of restricted gene flow with isolation by distance, although we found episodes of long-distance dispersal in some clades. A contiguous range expansion was detected between Australian populations. We conclude that M. squamiger is native to Australia and has most likely expanded its range of distribution sequentially through worldwide shipping, especially from the harbours of the more populated eastern Australia. In introduced populations, we found a high genetic diversity which suggests enhanced invasive potential. Consequently, there is a need to control this species, as it outcompetes local biota and is an economic threat. Keywords Ascidian, biological invasions, COI, genetic diversity, invasive species, Microcosmus squamiger, mtDNA, population differentiation.
INTRODUCTION Alien species have been identified as one of the major threats to the maintenance of biodiversity and ecosystem functioning in marine systems (Carlton & Geller, 1993; Mack et al., 2000; Crooks, 2002). The dispersal potential of an invasive species is crucial to its successful establishment in a new area (Carlton, 1996). Marine organisms have been spread through humanmediated transport since people first began navigating the seas, which has allowed many introductions of marine organisms worldwide (Carlton, 1999). However, the recent increase in
818
transoceanic ship transport has drastically increased the number of introductions of alien marine species (Carlton, 1996; Cohen & Carlton, 1998; Mack et al., 2000; Wonham et al., 2001). Most of these recent introductions are attributed to two vectors. The first is transport in ballast waters of shipping vessels (Williamson & Fitter, 1996; Wonham et al., 2000), wherein larval organisms are transported from their native ports and dumped in other harbours (Carlton, 1987; Chu et al., 1997), and the second is fouling on the hulls and sea chests of ships and recreational vessels (Wasson et al., 2001; Lambert, 2002; Coutts & Dodgshun, 2007). When an introduced species manages to establish itself in
DOI: 10.1111/j.1472-4642.2008.00485.x © 2008 The Authors Journal compilation © 2008 Blackwell Publishing Ltd www.blackwellpublishing.com/ddi
Phylogeography of the marine invader M. squamiger a new environment it can potentially spread out to neighbouring regions by larval dispersal or asexual processes (Branch & Steffani, 2004). Ascidians are increasingly recognized as major invaders of the seas around the world (Lambert, 2007). They have the ability to outcompete sessile organisms and to alter ecosystem functioning in numerous ways (Castilla et al., 2004; Bourque et al., 2007; Bullard et al., 2007; Wallentinus & Nyberg, 2007). The solitary ascidian Microcosmus squamiger was first described in a study of Australian samples undertaken by Michaelsen (1927), and is considered to be native to this region (Kott, 1985; Monniot et al., 2001) where it lives in open, undisturbed habitats. However, this animal has spread throughout the world and has been detected as an introduced species in locations such as the west coast of North America (Lambert & Lambert, 1998; Lambert & Lambert, 2003), South Africa (Monniot et al., 2001), the east coast of Africa (Monniot, 2002), the south coast of India (Abdul & Sivakumar, 2007), along the Atlantic Iberian Peninsula coast (Naranjo & García-Gómez, 1994; Turon et al., 2007), Madeira and the Canary Islands (Turon et al., 2007) and the Mediterranean Sea (Monniot, 1981; Naranjo et al., 1996; Mastrototaro & Dappiano, 2005; Zenetos et al., 2005; Turon et al., 2007). In its introduced range, the species is usually found in harbours and marinas (Lambert & Lambert, 1998; Lambert & Lambert, 2003; Ranasinghe et al., 2005), but it can spread to adjacent habitats as well, altering local benthic communities as it forms dense populations (Turon et al., 2007). This species has a short-lived larval stage (maximum larval swimming time of 24 h in the laboratory; M. Rius, pers. obs.) and a small larval size (total length of c. 0.1 mm), which do not allow active long-range dispersal. As a result, considering that M. squamiger has successfully established itself across the globe, and that the localities where M. squamiger is more abundant are generally in or close to large shipping harbours (Lambert & Lambert, 1998; Turon et al., 2007), it is reasonable to assume that transoceanic vessels are
the most probable method of initial introduction of the M. squamiger populations, followed by further spread enhanced by local recreational vessels (Wasson et al., 2001). Genetic markers are a useful tool for phylogeographical studies of colonizing species (Holland, 2000; Sakai et al., 2001; Féral, 2002; Turon et al., 2003; Zardi et al., 2007). The genetic diversity of introduced populations is a key factor in their successful establishment in new areas and, hence, in the invasive potential of the species (Pascual et al., 2007; Roman & Darling, 2007). Furthermore, the study of genetic variability in the native range provides valuable information in order to understand the colonization processes (Roman & Palumbi, 2004). M. squamiger is a good model for this type of study as the presumed native range is known and it has spread around the world. In this study we investigated the global genetic structure of M. squamiger, based on 12 populations collected from all the oceans where this species is found. We did this by using sequence data of the mitochondrial cytochrome c oxidase subunit I (COI) gene, which has been shown to be highly informative for intraspecies studies in ascidians (Tarjuelo et al., 2004; López-Legentil et al., 2006). We aim, first, to determine the phylogeographical relationships between worldwide populations in order to track the spread of this organism from its native area, second, to assess whether the colonization of different regions has been an independent process or not, and finally to study the relationships between populations situated inside and outside of harbours. METHODS Sampling This study was based on specimens from 12 localities (Fig. 1, Table 1): three from the Mediterranean Sea (Iberian Peninsula and north African coast), four from the north-eastern Atlantic Ocean (Iberian Peninsula and Canary Islands), one from the
Table 1 Population and genetic characteristics of the Microcosmus squamiger populations. Population
Geographical region/Country
Latitude/Longitude
Bunbury Albany Manly Bahía Falsa Port Elizabeth Santa Cruz de Tenerife Santander Cascais Cádiz Ceuta Cubelles Barcelona Total
SE Indian Ocean/Australia 33°19′13″S/115°39′39″E Southern Ocean/Australia 35°01′56″S/117°53′25″E SW Pacific Ocean/Australia 27°27′10″S/153°11′22″E NE Pacific Ocean/Mexico 37°56′18″N/122°25′36″W SW Indian Ocean/South Africa 33°57′60″S/25°38′06″E NE Atlantic Ocean/Spain 28°27′59″N/16°14′39″W NE Atlantic Ocean/Spain 43°27′45″N/3°47′22″W NE Atlantic Ocean/Portugal 38°41′34″N/9°25′03″W NE Atlantic Ocean/Spain 36°31′51″N/6°17′03″W SW Mediterranean Sea/Spain 35°53′43″N/5°18′44″W NW Mediterranean Sea/Spain 41°11′37″N/1°39′17″E NW Mediterranean Sea/Spain 41°20′33″N/2°09′41″E
Status
n
Nh
h ± SD
π ± SD
D
N-H N-O N-O I-O I-H I-H I-H I-H I-H I-H I-O I-H
23 23 21 19 17 23 22 24 20 24 20 22 258
11 8 11 10 7 6 6 11 5 5 9 10 52
0.692 ± 0.109 0.712 ± 0.092 0.867 ± 0.059 0.825 ± 0.083 0.596 ± 0.139 0.514 ± 0.120 0.641 ± 0.107 0.841 ± 0.063 0.674 ± 0.098 0.587 ± 0.102 0.853 ± 0.053 0.875 ± 0.052 0.794 ± 0.022
0.004 ± 0.0014 0.006 ± 0.0014 0.008 ± 0.0012 0.005 ± 0.0019 0.003 ± 0.0014 0.002 ± 0.0011 0.003 ± 0.0011 0.004 ± 0.0013 0.005 ± 0.0015 0.004 ± 0.0014 0.008 ± 0.0079 0.005 ± 0.0015 0.007 ± 0.0004
–1.961* – 0.242 – 0.158 –1.447* –2.230* –2.193* –2.002* –1.591* – 0.452 –0.762 –0.004 –1.429 –1.595
Status (N, native; I, introduced; H, inside harbour; O, outside harbour), sample size (n), number of haplotypes (Nh), haplotype diversity (h) and their standard deviations (SD), nucleotide diversity (π), and their standard deviations (SD), Tajima’s D statistic s and their significance obtained by coalescent simulations (*< 0.05) are indicated. © 2008 The Authors Diversity and Distributions, 14, 818–828, Journal compilation © 2008 Blackwell Publishing Ltd
819
M. Rius et al.
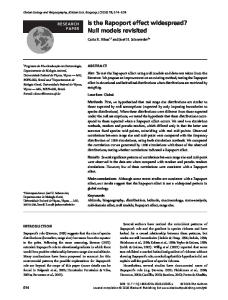
Figure 1 Sampled populations of Microcosmus squamiger. Boxes indicate the populations that were considered as introduced. The underlined population names indicate the populations outside of harbours, while the remaining populations were collected inside of harbours. The pie charts indicate the proportion of H1 (black) and H2 (white) haplotype groups for each population (see Results).
south-western Indian Ocean (South Africa), one from the southeastern Indian Ocean (western Australia), one from the northeastern Pacific Ocean (Mexico) and one from the south-western Pacific Ocean (eastern Australia), and, finally, one from the Southern Ocean (southern Australia). These locations were chosen as they represented the majority of regions around the world where M. squamiger is currently found. These included the presumed native area and the main regions where the species has spread, with particular emphasis on the historically more navigated East Atlantic–Mediterranean zone. All locations consisted of rocky substrata, with samples collected from either inside or outside of harbours (see Fig. 1 for details). The shortest distances (in kilometres) by sea between location pairs were calculated using the ‘measure line’ tool of the Google Earth program (version 3.0, Google Inc., Menlo Park, CA, USA). The specimens were collected at each locality from depths of between 1 and 3 m through either SCUBA diving, direct collection during low tide, or by pulling up harbour ropes. The samples were collected between February 2005 and December 2006. For each individual, the tunic was cut in situ and a piece of muscular
820
tissue from the mantle was immediately preserved in absolute ethanol. A few hours after the collection, the ethanol was changed, in order to extract all the water from the tissue and to ensure the preservation of the DNA. Once in the laboratory, the specimens were dissected in order to confirm that they belonged to the study species following Kott (1985). The tissue samples were stored at –80 °C until DNA was extracted. DNA extraction and sequencing DNA was extracted using the REALPURE extraction kit (Durviz, Valencia, Spain). The universal primers LCO1490 and HCO2198 described by Folmer et al. (1994) were used to amplify a fragment of the COI mitochondrial gene. For the amplification reaction, a total volume of 25 μL consisting of 0.5 μL of each primer (10 mm), 3.2 μL dNTP (1 mm), 5.11 μL 10× buffer, 2.3 μL MgCl2 (25 mm), 0.26 μL Taq polymerase (Promega), and 1 μL DNA was used. The PCR program followed an initial denaturing step at 94 °C for 2 min, 30 amplification cycles (94 °C for 1 min, 50 °C for 1 min and 72 °C for 1 min), and a final step at 72 °C for 5 min in a GeneAmp PCR System 9700 (Applied Biosystems,
© 2008 The Authors Diversity and Distributions, 14, 818–828, Journal compilation © 2008 Blackwell Publishing Ltd
Phylogeography of the marine invader M. squamiger Foster City, CA, USA). Subsequently, the PCR products were visualized on 1.5% agarose gels. The PCR products were purified using MultiScreen® PCRμ96 plates and resuspended in 30 μL of water. A sequencing reaction was run with the same primers. For this reaction, we used 7 μL of the purified PCR product, 2.75 μL buffer and 0.5 μL BigDye (both versus 3.1, Applied Biosystems), 1 μL primer (10 mm), and 2.75 μL distilled water, and 25 PCR cycles (96 °C for 10 s, 49 °C for 5 s and 60 °C for 5 min) were performed. Finally, the sequences were obtained in an automated sequencer (ABI PRISM 3100 Genetic Analyser, Applied Biosystems) from the Serveis Científico-Tècnics of the Universitat de Barcelona. Population genetic analysis The sequences were aligned using the BioEdit Sequence Alignment Editor (Hall, 1999), and the resulting alignment was verified by eye. The number of haplotypes, as well as the haplotype and nucleotide diversity values per population, was computed. Neutrality tests were assessed globally and for each population using Tajima’s D statistic (Tajima, 1989), with the statistical significance obtained by coalescent simulations. To detect population growth we computed the R2 test (RamosOnsins & Rozas, 2002). All the analyses were performed using DnaSP 4.20 (Rozas et al., 2003). The populations were grouped according to their status: native or introduced, and inside or outside of harbours. Subsequently, we tested for differences in the genetic diversity and number of unique haplotypes per population between groups with the t-test using the program systat (version 11, 2004, Systat Software Inc., San Jose, CA, USA). In order to analyse genetic differences between populations, FST values were calculated between pairs of populations and their significance was tested by 2000 permutations using Arlequin version 3.1. (Excoffier et al., 2005). A multidimensional scaling (MDS) analysis was carried out with the program systat using the matrix of FST as an input to graphically represent the patterns of genetic differentiation. Subsequently, a hierarchical analysis of molecular variance (AMOVA) was conducted to study the distribution of genetic variability between localities grouped according to different criteria (significance of the variance components tested by 1000 permutations). The relationship between genetic (as FST/ (1 – FST)) and geographical distances (in logarithms) was evaluated using a Mantel test with 10,000 permutations of the data set. All these analyses were performed using Arlequin version 3.1. Phylogenetic and phylogeographical analysis A maximum-likelihood (ML) tree of the haplotypes was computed using the program Tree Finder (Jobb et al., 2004; January 2008 version). The best-fit model of nucleotide evolution for our data was selected using the ‘model proposal’ tool of Tree Finder following the Akaike Information Criterion. We then rooted the tree using a sequence of the congeneric species Microcosmus polymorphus (GenBank accession number
EU486430). The branch support was evaluated by 1000 bootstrap replicates. A haplotype network was obtained using the TCS program (Clement et al., 2000). Loops in the network that generated ambiguities were broken following the frequency, topology, and geographical criteria (Pfenninger & Posada, 2002; Duran et al., 2004). The nesting design was done by hand following Templeton et al. (1987). The nested clade analysis (NCA) (Templeton, 1998) was used, as implemented in GeoDis version 2.5 (Posada et al., 2000), to analyse the relationship between genetic and geographical patterns. The significance of the clade distance (Dc) and the nested clade distance (Dn) was calculated through running 10,000 random permutations (Posada et al., 2006). Templeton’s inference key (as of November 2005; http://darwin.uvigo.es/ download/geodisKey_11Nov05.pdf ) was used for the biological interpretation of the data whenever the distribution of haplotypes was not random with respect to geographical location. RESULTS A total of 258 individuals were sequenced and a final alignment of 574 bp in length was obtained, comprising 52 different haplotypes (Table 1, haplotype sequences deposited in GenBank, accession numbers EU486172–EU486429). We found 51 polymorphic positions (8.9%). Most positions (86.3%) had synonymous substitutions, while the remaining positions exhibited non-synonymous changes. Regarding nucleotide and haplotype diversity, no significant differences were found between native and introduced populations (t = 0.52, d.f. = 10, P = 0.61), or between populations inside and outside of harbours (t = –2.01, d.f. = 10, P = 0.07). When the haplotype distribution in each population (see Appendix S1 in Supplementary Material) was analysed, two frequent haplotypes were present in all of them (haplotype 1 and 7) and a high number of unique haplotypes per population were found. However, the number of unique haplotypes was significantly larger (t = 4.276, d.f. = 10, P = 0.002) in the Australian populations (mean ± standard deviation (SD) = 7.3 ± 2.1) than in the introduced populations (mean ± SD = 2.1 ± 1.8). In addition, the Australian populations shared only two haplotypes, which were the most frequently occurring ones, while 11 haplotypes, which appeared less frequently, were shared by two or more introduced populations (see Appendix S1). In the analysis of populations collected from either inside or outside of harbours, we found no significant differences in the number of unique haplotypes between groups (t = –1.642, d.f. = 10, P = 0.131). The neutrality test (Tajima’s D: –0.158) was not significant (P = 0.474) when calculated using the entire data set. However, when we carried out this test for each population separately, six populations (Bunbury, Bahía Falsa, Port Elizabeth, Tenerife, Santander, and Cascais) showed significantly negative Tajima’s D-values (Table 1) due to an excess of low frequency haplotypes. No relationship was observed between the distribution of haplotypes presenting non-synonymous changes and the populations with and without significant D-values. This would point to the neutrality of the gene under study. However, we cannot rule out
© 2008 The Authors Diversity and Distributions, 14, 818–828, Journal compilation © 2008 Blackwell Publishing Ltd
821
M. Rius et al. Table 2 FST values and their significance between populations. The FST values are shown above the diagonal, while their significance after 2000 permutations is shown below the diagonal.
BU AL MA BF PE TE SA CAS CAD CE CU BA
BU
AL
MA
BF
PE
TE
SA
CAS
CAD
CE
CU
BA
–
0.059 – *** *** *** *** *** *** *** *** *** ***
0.455 0.260 – * * *** *** *
0.689 0.524 0.084 –
0.739 0.566 0.095 – 0.010 –
0.784 0.628 0.148 0.016 –0.018 –
0.772 0.614 0.141 0.004 –0.020 –0.033 –
0.710 0.548 0.093 –0.003 –0.012 –0.000 –0.013 –
0.658 0.474 0.026 –0.007 –0.010 0.026 0.009 –0.018 –
0.691 0.518 0.054 0.008 –0.010 –0.006 –0.008 –0.009 –0.023 –
0.474 0.279 –0.031 0.073 0.088 0.140 0.124 0.071 0.005 0.039 –
0.693 0.527 0.082 – 0.001 – 0.019 – 0.006 – 0.025 – 0.015 – 0.016 – 0.021 0.061 –
ns
*** *** *** *** *** *** *** *** *** ***
ns ns
ns
ns
ns
ns
ns
ns
ns
ns
ns
ns
ns
ns
ns
ns
ns
ns
ns
ns
ns
ns
ns
ns
ns
*
*
ns
ns
ns
*
ns
ns
ns
ns
ns
ns
ns
ns
ns
Significance levels: ***P < 0.001, **P < 0.01, *P < 0.05, nsP > 0.05. Population abbreviations: Manly (MA), Albany (AL), Bunbury (BU), Port Elizabeth (PE), Bahía Falsa (BF), Santa Cruz de Tenerife (TE), Santander (SA), Cascais (CAS), Cádiz (CAD), Ceuta (CE), Cubelles (CU), Barcelona (BA).
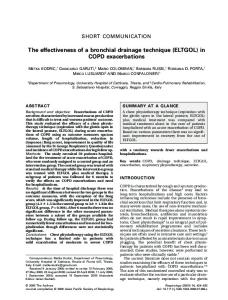
Figure 2 Multidimensional scaling plot obtained from the genetic distances (FST) between populations. Population names as in Table 2. The stress of the final configuration was 0.017 and the proportion of variance explained was 99.93%.
that selection acts in linked loci given the nature of mtDNA. Further studies with more unlinked markers are necessary to unravel any potential role of selection. From the analysis of the genetic differences between populations, we found that the largest genetic distance was between the western Australian populations (Albany and Bunbury) and the other 10 populations (Table 2). The pairwise comparisons between these two groups of populations were highly significant (P < 0.001). Similarly, the MDS plot separated the western Australia populations from the remaining populations (Fig. 2). The association between genetic differentiation (FST/1 – FST) and geographical distances in worldwide M. squamiger populations presented a shallow slope, which was marginally significant according to the Mantel test (R = 0.328, P = 0.068).
822
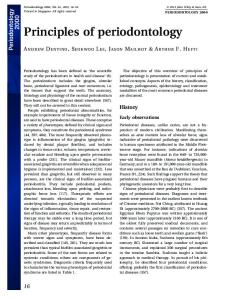
The AMOVA revealed that most genetic variance was attributable to differences between groups when we grouped populations as west Australia, east Australia, and other areas (Table 3). Similarly, significant differences were found between native and introduced populations. In contrast, when we grouped populations according to whether they were located inside or outside of harbours, no differences were found among groups. This was the case both when we analysed all the samples together and when we undertook the analysis separately within the introduced and native populations (Table 3). The variation among populations within groups was significant whenever one of the groups included the western Australian populations. The model selection analysis showed that the General Time Reversible model with a proportion of invariable sites (I) best suited the data. The substitution rates and parameter I were estimated using ML and the empirically observed nucleotide frequencies were used. The ML haplotype tree revealed two main well-supported groups that were named H1 and H2 (Fig. 3a). When the relative contribution of each group of haplotypes to every population was calculated, we found that H1 was predominant in most populations, with the exception of the two western Australian populations where H2 was more abundant (Fig. 1). The nested design applied to the haplotype network and obtained for all populations divided the haplotypes into two three-step clades, which coincided with the previously defined H1 and H2 haplotype groups (Fig. 3b). We considered clade 3-1 interior by comparison to a sequence of the congener species M. polymorphus. The results of the NCA revealed restricted gene flow with isolation by distance for the overall cladogram as well as for clade 1-1, which includes the most frequent haplotype in the H1 group (see Appendix S2a in Supplementary Material, Fig. 3b). However, restricted gene flow or dispersal with some long-distance dispersal was found for clades 2-4 and 3-1 (Appendix S2a). A similar cladogram structure was found when
© 2008 The Authors Diversity and Distributions, 14, 818–828, Journal compilation © 2008 Blackwell Publishing Ltd
Phylogeography of the marine invader M. squamiger Table 3 Analysis of molecular variance for Microcosmus squamiger populations considering different groupings. Grouping
Source of variation
1. Populations from western Australia 2. Manly 3. The remaining nine populations
Among groups Among populations Within populations Total Among groups Among populations Within populations Total Among groups Among populations Within populations Total Among groups Among populations Within populations Total Among groups Among populations Within populations Total
1. Australian populations 2. The remaining populations
1. Populations inside harbours 2. Populations outside harbours
Introduced populations: 1. Populations inside harbours 2. Populations outside harbours Native populations: 1. Populations inside harbours 2. Populations outside harbours
within groups
within groups
within groups
within groups
within groups
SS
d.f.
%V
158.32 16.63 329.89 504.84 126.09 48.86 329.89 504.84 16.14 158.81 329.89 504.84 3.76 9.42 219.90 233.07 17.66 18.02 109.99 145.67
2 9 246 257 1 10 246 257 1 10 246 257 1 7 182 190 1 1 64 66
51.50** 0.84ns 47.66** 44.76** 6.07** 49.17** 0.19ns 33.46** 66.36** 3.11ns 0.51ns 96.37ns –1.22ns 30.54** 70.68**
Sum of squares (SS), degrees of freedom (d.f.), and percentage of variation (% V) are indicated for each grouping. Significance levels tested by 1000 permutations: **P < 0.01, *P < 0.05, nsP > 0.05.
only the three Australian populations were included (figure not shown), indicating that the studied native populations of M. squamiger are good representatives of overall variability. The NCA analysis performed on the Australian populations inferred a contiguous range expansion from the whole cladogram, while a restricted gene flow with isolation by distance was found for clade 3-1 (Appendix S2b). DISCUSSION This study confirmed that Australia is the most likely origin of M. squamiger. We found that the Australian populations were genetically diverse and, alone, contained most of the global genetic variability. In addition, a significantly higher number of unique haplotypes was found in the Australian populations when compared to the other populations. This observation supports the hypothesis that the Australian populations are the ancestral ones. Dupont et al. (2007) found reduced genetic diversity in another southern hemisphere ascidian (Corella eumyota) that invaded the northern hemisphere, showing evidence of a bottleneck effect during the colonization process. In our study, Bahía Falsa and Port Elizabeth populations showed higher numbers of unique haplotypes (mean ± SD = 4.5 ± 0.7) than the other introduced populations (1.4 ± 1.3), suggesting that the colonization of South Africa and the west coast of North America by M. squamiger took place before that of other areas, or that multiple colonizing events have occurred. When we analysed all the populations together, we found two separate haplotype
groups, the first one (H1) dominant in the western Australian locations, while the second group (H2) dominated the eastern Australian sites and introduced populations. Interestingly, the same haplotype grouping was found in the two three-step clades of the NCA cladogram. The link between the most frequent haplotypes of each group included a few haplotypes found only in the Australian populations (clades 1-5 and 1-6), supporting the idea that this area is the origin of the two haplotype groups and the centre from which this species has radiated outwards. This is in accordance with the historical records of this species (Monniot, 1981; Kott, 1985; Monniot et al., 2001). The extensive classical studies of ascidian fauna during the first half of the 20th century (Harant & Vernières, 1933; Van Name, 1945) did not detect M. squamiger in European or in American waters. This observation, together with the results of the present study, suggests that M. squamiger has recently established populations all around the world. Given that it is a species with restricted dispersal corresponding to its type of larva (Svane & Young, 1989), it seems likely that anthropogenic transport via ships has played a key role in the shaping of the present-day distribution of the species. In addition to hull fouling, ships may carry species in sea chests, a transport vector whose importance has been underestimated so far (Coutts & Dodgshun, 2007; Lee & Chow, 2007). The NCA indicated a restricted gene flow in all clades with a significant geographical structure. Our results obtained for the complete cladogram showed isolation by distance, which is in accordance with the marginally significant
© 2008 The Authors Diversity and Distributions, 14, 818–828, Journal compilation © 2008 Blackwell Publishing Ltd
823
M. Rius et al.
824 © 2008 The Authors Diversity and Distributions, 14, 818–828, Journal compilation © 2008 Blackwell Publishing Ltd
Figure 3 (a) Maximum-likelihood haplotype tree for the cytochrome c oxidase subunit I (COI) sequences of Microcosmus squamiger. The values of the bootstrap support are indicated when > 50%. The tree is rooted using Microcosmus polymorphus as an outgroup (not shown); (b) statistical parsimony haplotype network. Population names as in Table 2. The asterisks indicate non-synonymous changes. Two groups of haplotypes can be observed and are defined as H1 and H2.
Phylogeography of the marine invader M. squamiger results of the Mantel test. However, we also detected some long-distance dispersal episodes in clades including most of the haplotypes (2-4 and 3-1). This finding is consistent with the idea that this species might have been dispersed through ship traffic from Australia to other parts of the world, especially due to the recent increase in shipping worldwide (Carlton, 1996). In contrast, when we restricted the NCA to Australian populations, although isolation by distance was found in one of the clades, the overall inference indicated that a history of contiguous expansion events shaped the present-day distribution of this species in Australia. The NCA method has been recently criticized (Panchal & Beaumont, 2007) on the basis of false negatives found in simulation studies. The most commonly inferred processes (restricted gene flow with isolation by distance and contiguous range expansion) are those more prone to appear spuriously. Thus, the results of this analysis should be taken with some caution until cross-validation with other DNA regions can be performed (Templeton, 2004). In the MDS and FST analyses close genetic similarities were found between the eastern Australian and introduced populations. This suggests that intense shipping from eastern Australia, where the earliest and most important harbours (i.e. most populated areas) are found (Denoon et al., 2000), might have extensively spread this species to many places around the world. Similarly, the Australian ascidian species Pyura praeputialis seems to have recently been introduced to Chile from the eastern Australian populations (Castilla et al., 2002). As shown in the present study, the colonization of the different areas by M. squamiger has not occurred independently, as many introduced populations share some low frequency alleles. This points to a complex history of introduction events with serial introductions from one colonized population to another (Pascual et al., 2007), which is consistent with the scenario of ship dispersal coupled with subsequent transport by small vessels (Wasson et al., 2001). When the number of shared alleles was examined, we found that the Atlanto-Mediterranean region populations shared the highest number of alleles (nine among all of them). These results suggest an active gene flow among the populations separated by the Strait of Gibraltar. The lower number of shared alleles between this area and Bahía Falsa (five alleles) or Port Elizabeth (three alleles), despite pointing to a smaller gene flow, still reveals the similarity of allele composition between geographically separated areas and a lack of independence of their colonization processes. We expected that the colonizing populations would be genetically less diverse than the native populations (Holland, 2000; Dupont et al., 2007). On the contrary, a high level of haplotype diversity in the introduced populations was found, which suggests that either a high number of colonizers arrived in a single episode, or that there have been multiple introduction events (Holland, 2001; Dupont et al., 2003; Simon-Bouhet et al., 2006). Human-mediated transport (Roman & Darling, 2007) can enhance both the number of individuals reaching new areas and the probability of multiple introductions, which consequently increases genetic variability and reduces the bottleneck effect caused by the colonizing event.
In the native region we expected that the populations inside harbours would be less genetically diverse than the ones outside, while in the introduced areas the opposite trend was expected as the external populations most likely originated from harbour sources. However, the results showed no differences between populations inside and outside of harbours in both the native and the introduced populations. Remarkably, a noticeable genetic diversity in populations outside of harbours in the introduced areas was found. This could indicate that the species thrives easily in natural habitats and suggests enhanced invasive potential. For example, in the Mediterranean Sea M. squamiger outcompetes native species (Turon et al., 2007), and in some sites outside of harbours this species colonizes all available substrata forming monospecific beds (M.R., M.P., and X.T., pers. obs.). In addition, this species is an economical threat, as in several areas it is considered a pest to bivalve cultures (e.g. Baja California, Mexico, L. Rodríguez, pers. comm.). Consequently, there is a need to effectively control this species, as it may become a pest in natural environments, particularly those close to harbours. Despite the potentially harmful effects of M. squamiger, very few studies have been conducted on the biology, life cycle, and population dynamics of this species. Studies of this nature should be carried out urgently to inform management plans in areas where this species may represent a risk for local communities and/or human activities. ACKNOWLEDGEMENTS We are grateful to S. López-Legentil and L. Rodríguez for providing samples from Cádiz and Bahía Falsa, respectively. We thank M. Ballesteros, A. Bucci, I. Calderón, A. Franzil, B. Galletly, and J. Murray for assistance in the field. I. Iturbe-Ormaetxe and E. O’Brien are acknowledged for their technical help. We are indebted to R. Pérez-Portela for sequencing the Microcosmus polymorphus COI gene fragment. We thank D. Posada for useful comments on the NCA. This research was funded by projects CTM2004-05265, CGL2006-13423, and CTM2007-66635 of the Spanish Government and a FPU scholarship to M. R. from the Spanish ‘Ministerio de Educación y Ciencia’. REFERENCES Abdul, J.A.H. & Sivakumar, V. (2007) Occurrence and distribution of ascidians in Vizhinjam Bay (south west coast of India). Journal of Experimental Marine Biology and Ecology, 342, 189– 190. Bourque, D., Davidson, J., MacNair, N.G., Arsenault, G., LeBlanc, A.R., Landry, T. & Miron, G. (2007) Reproduction and early life history of an invasive ascidian Styela clava Herdman in Prince Edward Island, Canada. Journal of Experimental Marine Biology and Ecology, 342, 78–84. Branch, G.M. & Steffani, C.N. (2004) Can we predict the effects of alien species? A case-history of the invasion of South Africa by Mytilus galloprovincialis (Lamarck). Journal of Experimental Marine Biology and Ecology, 300, 189–215.
© 2008 The Authors Diversity and Distributions, 14, 818–828, Journal compilation © 2008 Blackwell Publishing Ltd
825
M. Rius et al. Bullard, S.G., Lambert, G., Carman, M.R., Byrnes, J., Whitlatch, R.B., Ruiz, G., Miller, R.J., Harris, L., Valentine, P.C., Collie, J.S., Pederson, J., McNaught, D.C., Cohen, A.N., Asch, R.G., Dijkstra, J. & Heinonen, K. (2007) The colonial ascidian Didemnum sp. A: current distribution, basic biology and potential threat to marine communities of the northeast and west coasts of North America. Journal of Experimental Marine Biology and Ecology, 342, 99 –108. Carlton, J.T. (1987) Patterns of transoceanic marine biological invasions in the Pacific Ocean. Bulletin of Marine Science, 41, 452–465. Carlton, J.T. (1996) Pattern, process, and prediction in marine invasion ecology. Biological Conservation, 78, 97–106. Carlton, J.T. (1999) The scale and ecological consequences of biological invasions in the world’s oceans. Invasive species and biodiversity management (ed. by O.T. Sandlund, P.J. Schei & A. Viken), pp. 195–212. Kluwer Academic Publishers, Dordrecht, the Netherlands. Carlton, J.T. & Geller, J.B. (1993) Ecological roulette: the global transport of nonindigenous marine organisms. Science, 261, 78 –82. Castilla, J.C., Collins, A.G., Meyer, C.P., Guiñez, R. & Lindberg, D.R. (2002) Recent introduction of the dominant tunicate, Pyura praeputialis (Urochordata, Pyuridae) to Antofagasta, Chile. Molecular Ecology, 11, 1579 –1584. Castilla, J.C., Lagos, N.A. & Cerda, M. (2004) Marine ecosystem engineering by the alien ascidian Pyura praeputialis on a mid-intertidal rocky shore. Marine Ecology Progress Series, 268, 119 –130. Chu, K.H., Tam, P.F., Fung, C.H. & Chen, Q.C. (1997) A biological survey of ballast water in container ships entering Hong Kong. Hydrobiologia, 352, 201–206. Clement, M., Posada, D. & Crandall, K.A. (2000) TCS: a computer program to estimate gene genealogies. Molecular Ecology, 9, 1657–1659. Cohen, A.N. & Carlton, J.T. (1998) Accelerating invasion rate in a highly invaded estuary. Science, 279, 555 –558. Coutts, A.D.M. & Dodgshun, T.J. (2007) The nature and extent of organisms in vessel sea-chests: a protected mechanism for marine bioinvasions. Marine Pollution Bulletin, 54, 875–886. Crooks, J.A. (2002) Characterizing ecosystem-level consequences of biological invasions: the role of ecosystem engineers. Oikos, 97, 153 –166. Denoon, D., Mein-Smith, P. & Wyndham, M. (2000) A history of Australia, New Zealand, and the Pacific. Blackwell History of the World, London. Dupont, L., Jollivet, D. & Viard, F. (2003) High genetic diversity and ephemeral drift effects in a successful introduced mollusc (Crepidula fornicata: Gastropoda). Marine Ecology Progress Series, 253, 183 –195. Dupont, L., Viard, F., David, P. & Bishop, J.D.D. (2007) Combined effects of bottlenecks and selfing in populations of Corella eumyota, a recently introduced sea squirt in the English Channel. Diversity and Distributions, 13, 808 –817. Duran, S., Giribet, G. & Turon, X. (2004) Phylogeographical history of the sponge Crambe crambe (Porifera, Poecilosclerida):
826
range expansion and recent invasion of the Macaronesian islands from the Mediterranean Sea. Molecular Ecology, 13, 109–122. Excoffier, L., Laval, G. & Schneider, S. (2005) Arlequin (Version 3.0): an integrated software package for population genetics data analysis. Evolutionary Bioinformatics Online, 1, 47–50. Féral, J.P. (2002) How useful are the genetic markers in attempts to understand and manage marine biodiversity? Journal of Experimental Marine Biology and Ecology, 268, 121–145. Folmer, O., Black, M., Hoeh, W., Lutz, R. & Vrijenhoek, R. (1994) DNA primers for amplification of mitochondrial cytochrome c oxidase subunit I from diverse metazoan invertebrates. Molecular Marine Biology and Biotechnology, 3, 294–299. Hall, T.A. (1999) BioEdit: a user-friendly biological sequence alignment editor and analysis program for Windows 95/98/ NT. Nucleic Acids Symposium Series, 41, 95–98. Harant, D.H. & Vernières, P. (1933) Faune de France – Tuniciers. Paul Lechevalier, Paris. Holland, B.S. (2000) Genetics of marine bioinvasions. Hydrobiologia, 420, 63–71. Holland, B.S. (2001) Invasion without a bottleneck: microsatellite variation in natural and invasive populations of the brown mussel Perna perna (L.). Marine Biotechnology, 3, 407– 415. Jobb, G., von Haeseler, A. & Strimmer, K. (2004) TREEFINDER: a powerful graphical analysis environment for molecular phylogenetics. BMC Evolutionary Biology, 4, 18. Kott, P. (1985) The Australian Ascidiacea, Part 1. Phlebobranchia and Stolidobranchia. Memoirs of the Queensland Museum, 23, 1–438. Lambert, G. (2002) Nonindigenous ascidians in tropical waters. Pacific Science, 56, 291–298. Lambert, G. (2007) Invasive sea squirts: a growing global problem. Journal of Experimental Marine Biology and Ecology, 342, 3–4. Lambert, C.C. & Lambert, G. (1998) Non-indigenous ascidians in southern California harbors and marinas. Marine Biology, 130, 675–688. Lambert, C.C. & Lambert, G. (2003) Persistence and differential distribution of nonindigenous ascidians in harbors of the Southern California Bight. Marine Ecology Progress Series, 259, 145–161. Lee, J.E. & Chown, S.L. (2007) Mytilus on the move: transport of an invasive bivalve to the Antarctic. Marine Ecology Progress Series, 339, 307–310. López-Legentil, S., Turon, X. & Planes, S. (2006) Genetic structure of the star sea squirt, Botryllus schlosseri, introduced in southern European harbours. Molecular Ecology, 15, 3957–3967. Mack, R.N., Simberloff, D., Lonsdale, W.M., Evans, H., Clout, M. & Bazzaz, F.A. (2000) Biotic invasions: causes, epidemiology, global consequences, and control. Ecological Applications, 10, 689–710. Mastrototaro, F. & Dappiano, M. (2005) New record of the non-indigenous species Microcosmus squamiger (Ascidiacea: Stolidobranchia) in the harbour of Salerno (Tyrrhenian Sea, Italy). Journal of the Marine Biology Association of the UK, 85, 1555. Michaelsen, V.W. (1927) Einige neue westaustralische Ptychobranchiate Ascidien. Zoologischer Anzeiger, 71, 193–203.
© 2008 The Authors Diversity and Distributions, 14, 818–828, Journal compilation © 2008 Blackwell Publishing Ltd
Phylogeography of the marine invader M. squamiger Monniot, C. (1981) Apparition de l’ascidie Microcosmus exasperatus dans les ports Méditerranéens. Téthys, 10, 59 – 62. Monniot, C. (2002) Stolidobranch ascidians from the tropical western Indian Ocean. Zoological Journal of the Linnean Society, 135, 65 –120. Monniot, C., Monniot, F., Griffiths, C.L. & Schleyer, M. (2001) South African ascidians. Annals of the South African Museum, 108, 1–141. Naranjo, S.A., Carballo, J.L. & Garcia-Gomez, J.C. (1996) Effects of environmental stress on ascidian populations in Algeciras Bay (southern Spain). Possible marine bioindicators? Marine Ecology Progress Series, 144, 119 –131. Naranjo, S.A. & García-Gómez, J.C. (1994) Ascidias litorales del estrecho de Gibraltar: nuevas aportaciones faunísticas. Graellsia, 50, 57–69. Panchal, M. & Beaumont, M.A. (2007) The automation and evaluation of nested clade phylogeographic analysis. Evolution, 61, 1466 –1480. Pascual, M., Chapuis, M.P., Mestres, F., Balanyà, J., Huey, R.B., Gilchrist, G.W., Serra, L. & Estoup, A. (2007) Introduction history of Drosophila subobscura in the New World: a microsatellite-based survey using ABC methods. Molecular Ecology, 16, 3069 –3083. Pfenninger, M. & Posada, D. (2002) Phylogeographic history of the land snail Candidula unifasciata (Helicellinae, Stylommatophora): fragmentation, corridor migration, and secondary contact. Evolution, 56, 1776 –1788. Posada, D., Crandall, K.A. & Templeton, A.R. (2000) GeoDis: a program for the cladistic nested analysis of the geographical distribution of genetic haplotypes. Molecular Ecology, 9, 487– 488. Posada, D., Crandall, K.A. & Templeton, A.R. (2006) Nested clade analysis statistics. Molecular Ecology Notes, 6, 590 –593. Ramos-Onsins, S.E. & Rozas, J. (2002) Statistical properties of new neutrality tests against population growth. Molecular Biology and Evolution, 19, 2092–2100. Ranasinghe, J.A., Mikel, T.K., Velarde, R.G., Weisberg, S.B., Montagne, D.E., Cadien, D.B. & Dalkey, A. (2005) The prevalence of non-indigenous species in southern California embayments and their effects on benthic macroinvertebrate communities. Biological Invasions, 7, 679 – 686. Roman, J. & Darling, J.A. (2007) Paradox lost: genetic diversity and the success of aquatic invasions. Trends in Ecology and Evolution, 22, 454 – 464. Roman, J. & Palumbi, S.R. (2004) A global invader at home: population structure of the green crab, Carcinus maenas, in Europe. Molecular Ecology, 13, 2891–2898. Rozas, J., Sánchez-DelBarrio, J.C., Messeguer, X. & Rozas, R. (2003) DnaSP, DNA polymorphism analyses by the coalescent and other methods. Bioinformatics, 19, 2496 –2497. Sakai, A.K., Allendorf, F.W., Holt, J.S., Lodge, D.M., Molofsky, J., With, K.A., Baughman, S., Cabin, R.J., Cohen, J.E., Ellstrand, N.C., McCauley, D.E., O’Neil, P., Parker, I.M., Thompson, J.N. & Weller, S.G. (2001) The population biology of invasive species. Annual Review of Ecology and Systematics, 32, 305– 332.
Simon-Bouhet, B., Garcia-Meunier, P. & Viard, F. (2006) Multiple introductions promote range expansion of the mollusc Cyclope neritea (Nassariidae) in France: evidence from mitochondrial sequence data. Molecular Ecology, 15, 1699–1711. Svane, I. & Young, C.M. (1989) The ecology and behaviour of ascidian larvae. Oceanography and Marine Biology Annual Review, 27, 45–90. Tajima, F. (1989) Statistical method for testing the neutral mutation hypothesis by DNA polymorphism. Genetics, 123, 585– 595. Tarjuelo, I., Posada, D., Crandall, K.A., Pascual, M. & Turon, X. (2004) Phylogeography and speciation of colour morphs in the colonial ascidian Pseudodistoma crucigaster. Molecular Ecology, 13, 3125–3136. Templeton, A.R. (1998) Nested clade analysis of phylogeographic data: testing hypothesis about gene flow and population history. Molecular Ecology, 7, 381–397. Templeton, A.R. (2004) Statistical phylogeography: methods of evaluating and minimizing inference errors. Molecular Ecology, 13, 789–809. Templeton, A.R., Boerwinkle, E. & Sing, C.F. (1987) A cladistic analysis of phenotypic association with haplotypes inferred from restriction endonuclease mapping. I. Basic theory and an analysis of alcohol dehydrogenase activity in Drosophila. Genetics, 117, 343–351. Turon, X., Nishikawa, T. & Rius, M. (2007) Spread of Microcosmus squamiger (Ascidiacea: Pyuridae) in the Mediterranean Sea and adjacent waters. Journal of Experimental Marine Biology and Ecology, 342, 185–188. Turon, X., Tarjuelo, I., Duran, S. & Pascual, M. (2003) Characterising invasion processes with genetic data: an Atlantic clade of Clavelina lepadiformis (Ascidiacea) introduced into Mediterranean harbours. Hydrobiologia, 503, 29–35. Van Name, W.G. (1945) The North and South America ascidians. Bulletin of the American Museum of Natural History, 84, 1–476. Wallentinus, I. & Nyberg, C.D. (2007) Introduced marine organisms as habitat modifiers. Marine Pollution Bulletin, 55, 323–332. Wasson, K., Zabin, C.J., Bedinger, L., Diaz, M.C. & Pearse, J.S. (2001) Biological invasions of estuaries without international shipping: the importance of intraregional transport. Biological Conservation, 102, 143–153. Williamson, M.H. & Fitter, A. (1996) The characters of successful invaders. Biological Conservation, 78, 163–170. Wonham, M., Carlton, J.T., Ruiz, G.M. & Smith, L.D. (2000) Fish and ships: relating dispersal frequency to success in biological invasions. Marine Biology, 136, 1111–1121. Wonham, M.J., Walton, W.C., Ruiz, G.M., Frese, A.M. & Galil, B.S. (2001) Going to the source: role of the invasion pathway in determining potential invaders. Marine Ecology Progress Series, 215, 1–12. Zardi, G.I., McQuaid, C.D., Teske, P.R. & Barker, N.P. (2007) Unexpected genetic structure of mussel populations in South Africa: indigenous Perna perna and invasive Mytilus galloprovincialis. Marine Ecology Progress Series, 337, 135–144.
© 2008 The Authors Diversity and Distributions, 14, 818–828, Journal compilation © 2008 Blackwell Publishing Ltd
827
M. Rius et al. Zenetos, A., Çinar, M.E., Pancucci-Papadopoulou, A.M., Harmelin, J.G., Furnari, G., Andaloro, F., Bellou, N., Streftaris, N. & Zibrowius, H. (2005) Annotated list of marine alien species in the Mediterranean with records of the worst invasive species. Mediterranean Marine Science, 6, 63 –118. Editor: David Richardson SUPPLEMENTARY MATERIAL The following supplementary material is available for this article: Appendix S1 Haplotype frequency distribution in populations of Microcosmus squamiger.
828
Appendix S2 Significant clades and their inference in the nested clade analysis of Microcosmus squamiger, using all populations (a) and only the Australian populations (b). This material is available as part of the online article from: http://www.blackwell-synergy.com/doi/abs/10.1111/ j.1472-4642.2008.00485.x (This link will take you to the article abstract). Please note: Blackwell Publishing is not responsible for the content or functionality of any supplementary materials supplied by the authors. Any queries (other than missing material) should be directed to the corresponding author for the article.
© 2008 The Authors Diversity and Distributions, 14, 818–828, Journal compilation © 2008 Blackwell Publishing Ltd