phys. stat. sol. (a) 195, No. 2, 416– 421 (2003) / DOI 10.1002/pssa.200305943
Photoacoustic measurement of transport properties in doped GaAs epitaxial layers Sajan. D. George*, Dilna. S. P. Radhakrishnan, C. P. G. Vallabhan, and V. P. N. Nampoori International School of Photonics, Cochin University of Science and Technology, Cochin-682 022, India Received 24 June 2002, revised 22 October 2002, accepted 25 October 2002 Published online 24 January 2003 PACS 66.30Xj, 71.55.Eq, 72.20.Jv, 73.61.Ey, 78.20.Hp The photoacoustic technique under heat transmission configuration is used to determine the effect of doping on both the thermal and transport properties of p- and n-type GaAs epitaxial layers grown on GaAs substrate by the molecular beam epitaxial method. Analysis of the data is made on the basis of the theoretical model of Rosencwaig and Gersho. Thermal and transport properties of the epitaxial layers are found by fitting the phase of the experimentally obtained photoacoustic signal with that of the theoretical model. It is observed that both the thermal and transport properties, i.e. thermal diffusivity, diffusion coefficient, surface recombination velocity and nonradiative recombination time, depend on the type of doping in the epitaxial layer. The results clearly show that the photoacoustic technique using heat transmission configuration is an excellent tool to study the thermal and transport properties of epitaxial layers under different doping conditions.
1
Introduction
Photoacoustic (PA) and photothermal methods have emerged as valuable research and analytical tools in the study of material properties [1, 2]. Since the PA technique can directly monitor nonradiative processes, it is widely used to characterize the thermal, transport and optical properties of semiconductors [3 –8]. The thermal waves generated in the coupling medium within the PA cell following illumination of the sample with chopped optical radiation induce pressure fluctuations in the ambient gas column, which in turn produce the PA signal. The PA signal thus generated depends not only on the amount of heat generated but also on how the heat diffuses through the sample and how it is exchanged with the surroundings. As is well known, the phase as well as the amplitude of the PA signal carries valuable information on the sample properties [1 –10]. GaAs is an important semiconducting material with a wide range of applications in the electronic and optoelectronic industry. The power handling capability, reliability and performance of these devices depend on the thermal and transport properties of the semiconducting material. The material parameters are influenced by the doping concentration and the nature of the dopant [9 –11]. By making layered structures of these compound semiconductors, one can engineer the band gap of these materials. In recent years, the PA technique under heat transmission configuration has been effectively employed in characterizing the thermal and transport properties of semiconductor epitaxial layers [10], especially in the low chopping frequency range [12]. In this paper, we investigate the influence of the nature of dopants (n-type Si doped and p-type Be doped) of GaAs epitaxial layers grown on GaAs substrate, by *
Corresponding author: e-mail:
[email protected]
© 2003 WILEY-VCH Verlag GmbH & Co. KGaA, Weinheim 0031-8965/03/19501-0416 $ 17.50+.50/0
phys. stat. sol. (a) 195, No. 2 (2003)
417
fitting the phase of the PA signal to the thermal piston model of Rosencwaig and Gersho [13]. The parameters used for fitting are thermal diffusivity, diffusion coefficient, nonradiative recombination time and surface recombination velocity.
2
Experimental
Optical radiation from an argon ion laser at 488 nm (Liconix 5000) was used as the source of excitation, which was intensity modulated using a mechanical chopper (Stanford Research Systems SR 540) before it reached the sample surface. Detection of the PA signal in the cavity was made using a sensitive electret microphone (Knowles BT 1754). The phase of the PA signal was measured using a dual-phase digital lock-in amplifier (Stanford Research Systems SR 830), which was highly sensitive and could read a change of 0.01° in phase angle occurring even for a small variation in chopping frequency (~2 Hz) so that the data obtained had a high degree of accuracy. The laser power used for the present studies was 50 mW with a stability of ±0.5%. The samples were fixed on the PA cell using vacuum grease at the edges and illumination by periodically modulated light was done on the exposed portion of the sample. The samples used for the present study were Si-doped n-type GaAs epitaxial layer and Be-doped p-type GaAs epitaxial layer grown on 400 µm GaAs substrate by the molecular beam epitaxial (MBE) method. They were prepared by the Semiconductor Group, Technical University of Eindhoven, The Netherlands. The epitaxial layers had a thickness of 2 µm and a doping concentration of 2 × 1018 cm−3.
3
Theoretical background
In order to explain the behavior of our semiconducting samples, we resort to the thermal piston model of Rosencwaig and Gersho (RG), from which the pressure fluctuation δP in the PA cell due to periodic heating of the sample is given by [13] δP =
P0Θ jω t e , T0 lgσ g
(1)
where P0(T0) is the ambient pressure (temperature), lg is the length of the gas chamber, σg = (1 + j) ag, where ag = (πf/αg)1/2 = 1/µg (µg is the thermal diffusion length in the gas with thermal diffusivity αg), Θ is the sample temperature fluctuation at the sample–gas interface (x = 0) and ω = 2πf, where f is the modulation frequency. The geometry of the PA cell used for the present studies is shown in Fig. 1. In the case of semiconductors, if we excite the sample with an energy greater than the band gap energy, the heat power density and hence the temperature fluctuation Θ can be due to three processes, namely thermalization, bulk recombination and surface recombination processes. The thermalization component is due to fast intraband transition (of the order of picoseconds) of the electrons in the conducEpitaxial layer Incident Chopped
v
Microphone
Gas
x = lg
v0
Radiation
Substrate
x=0
x = −l s
Gas
Fig. 1 PA cell geometry for the heat transmission configuration.
418
S. D. George et al.: Photoacoustic measurement of transport properties in GaAs layers
tion band. The bulk and surface recombination are due to nonradiative recombination of photoexcited carriers in the bulk and surface of the specimen, respectively. Taking into account these three distinct processes, the expression of the PA signal is δP =
2ε I 0 P0 T0 lgσ g ksσ s
ε − 1 − lsσ s Fσ s 1 vτ + + . e 2 2 Dγτ σ s − γ σ s ε
(2)
The first term represents the thermalization component, which dominates in the low chopping frequency range followed by the bulk and surface recombination processes. In Eq. (2) σs = (1 + j) as, where as = (πf/αs)1/2 = 1/µs (µs is the thermal diffusion length of the sample), γ = [(1 + jωt)/Dτ]1/2 is the carrier diffusion coefficient, ε = Eg/hν, r = v/Dγ, r0 = v0/Dγ and F=
1 . (1 + r0 ) (1 + r ) e − (1 − r ) (1 − r0 ) e −γ l γl
Eg is the band gap energy, hv is the incident energy, v and v0 are the recombination velocity of photoexcited carriers at x = −ls and x = 0, respectively, D is the diffusion coefficient and τ is the nonradiative recombination time. It is reported in [5] that the PA signal under the heat transmission configuration for GaAs samples in the thermally thick (lsσs Ⰷ 1) region is essentially determined by nonradiative recombination processes. Thus the expression for pressure fluctuation is given by δP =
2ε f0 P0 F T0 lg ks Dγτσ g
1 vτ + 2 2 σ σ − γ s s
(3)
and in the experimental frequency range for which ωτ Ⰶ 1, it can be shown that the phase of the PA signal is given by Φ = π/2 + ∆Φ
(4)
where
tan ∆Φ =
aD v (ωτ eff + 1) aD 2 v (1 − ωτ eff ) − 1 − (ωτ eff )
(5)
with τeff = τ[(D/αs) − 1] and a = (π f/αs)1/2. We took thermal diffusivity, diffusion coefficient, surface recombination velocity and relaxation time as adjustable parameters and then we fitted the variable part of Eq. (5) with the experimentally obtained phase angle ∆Φ.
4
Results and discussion
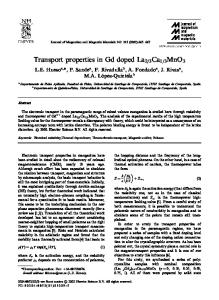
Figures 2 and 3 show the best theoretical fit to the experimentally obtained phase of the PA signal. The fitting program follows essentially the least squares method developed using MATLAB (version 6.1). Table 1 contains the values of the fitted parameters obtained by the fitting procedure for both n- and ptype GaAs epitaxial layers. The fitting procedure analysis resulted in the following accuracy of the fitted parameters: thermal diffusivity, ±2%; diffusion coefficient, ±5%; nonradiative recombination time, ±3%; surface recombination velocity, ±8%. It is obvious from Table 1 that the thermal diffusivity of doped epitaxial layer is less than the previously reported value of thermal diffusivity of n-type GaAs [5]. Thermal diffusivity is an important thermophysical parameter and it is a measure of how heat diffuses through the material in which a transient
phys. stat. sol. (a) 195, No. 2 (2003)
419
-53.0
theoretical fit experimental
-53.5
Phase (deg.)
-54.0 -54.5 -55.0 -55.5 -56.0 -56.5 -57.0 -57.5 400
500
600
700
800
900
Frequency (Hz) Fig. 2 PA phase angle for sample 1 versus modulation frequency. The solid line represents the data fitting to Eq. (5).
temperature change has occurred. The reduction in thermal diffusivity for the doped samples can be understood in terms of a dominant phonon contribution to the thermal conductivity. Particularly for thinlayered semiconductors, heat is transported by both phonons and carriers. However, the contribution to thermal conductivity from the phonons is much greater than that from the electrons. Addition of dopant introduces scattering centers in the lattice, which in turn reduce the phonon mean free path. This is also applicable to carriers. A decrease in the value of the mean free path reduces the thermal conductivity. It is also seen from Table 1 that the thermal diffusivity of the n-type epitaxial layer is slightly greater than that of the p-type epitaxial layer. This can be explained in terms of the effective mass of the photoexcited carriers. In the case of the p-type epitaxial layer, scattering is more effective than in the n-type epitaxial layer due to the greater effective mass of the holes. Here we assumed an isothermal contact between the doped/undoped layer so that the interface has negligible influence on our analysis. By considering the interface as a charge trapping region, both monolayer and double layer approximation yield similar results, especially in the low chopping frequency range [14]. The diffusion coefficient of a semiconductor is a very important quantity, which determines the distance traveled by the photoexcited carriers before their recombination [15]. The diffusion coefficient depends on the scattering processes, which control the mean free path of photoexcited carriers [16]. The PA signal, which depends on the diffusion and recombination of minority carriers, gives us an idea about Table 1 Values of the fitted parameters.
sample number thickness of the epitaxial layer (µm) thickness of the substrate (µm) type of dopant (concentration (cm−3)) thermal diffusivity, α (cm−2 s−1) diffusion coefficient, D (cm−2 s−1) surface recombination velocity, v (cm s−1) nonradiative recombination time, τ (µs)
1 2 400 Si (2 × 10¹⁸) 0.21 4.5 525 7
2 2 400 Be (2 × 10¹⁸) 0.19 5.6 634 5
420
S. D. George et al.: Photoacoustic measurement of transport properties in GaAs layers -53.0
theoretical fit experimental
-53.5 -54.0
Phase (deg.)
-54.5 -55.0 -55.5 -56.0 -56.5 -57.0 -57.5 400
500
600
700
800
900
Frequency (Hz) Fig. 3 PA phase angle for sample 2 versus modulation frequency. The solid line represents the data fitting to Eq. (5).
the influence of dopant on the value of the diffusion coefficient. It is clear from Table 1 that the diffusion coefficient of the n-type epitaxial layer is less than that of the p-type epitaxial layer. This can be attributed to the fact that in the n-type epitaxial layer the minority carriers are the holes. At constant temperature, the diffusion coefficient is directly proportional to the mobility of the carriers. It also has an inverse square root relation with effective mass. The holes with higher effective mass move slowly resulting in a higher value of the diffusion coefficient for p-type material than that for n-type material. The surface recombination velocity has a very significant impact on the behavior of optoelectronic devices. Usually a surface contains a large number of recombination centers due to the presence of numerous dangling bonds at the surface. In addition, impurities can also act as recombination centers on the surface of a semiconductor wafer. It was reported previously that surface recombination velocity of the photoexcited carriers increases with an increase in doping concentration of the epitaxial layer [10]. The difference in surface recombination velocity may be due to the specific growth mechanism of the epitaxial layer. The highly polished surface of MBE-grown specimen results in a lower value for the surface recombination velocity. The present investigation reveals the fact that the dopant type strongly influences the surface recombination velocity of photoexcited carriers. It is clear from Table 1 that the p-type epitaxial layer has a surface recombination velocity that is greater than that of the n-type epitaxial layer. This effect can be understood from the fact that the PA technique is sensitive to recombination of minority carriers. The surface recombination velocity of the photoexcited carriers is given by the expression v = σvthNst, where σ is the capture cross-section for the photoexcited carriers, vth is the thermal velocity of the photoexcited carriers and Nst is the number of trapping centers per unit area. Thus for a given doping concentration, the surface recombination velocity is directly proportional to the thermal velocity of the photoexcited carriers. However, at constant temperature the thermal velocity of the photoexcited carriers is inversely proportional to the square root of the effective mass of photoexcited carriers [17]. Thus the n-type epitaxial layer has a lower surface recombination velocity than the p-type epitaxial layer, which is in agreement with the present results. The PA technique allows us to determine the nonradiative recombination time of the photoexcited carriers. The nonradiative lifetime (τnr) is related to the total lifetime (τT) through its relation with radiative lifetime (τr), given by 1/τT = (1/τr) + (1/τnr). The nonradiative lifetime is an important quantity, which
phys. stat. sol. (a) 195, No. 2 (2003)
421
determines the quantum efficiency of semiconductor light sources. For a doping concentration as used in our studies, both the radiative and nonradiative lifetimes are comparable in magnitude. It is also clear that the nonradiative recombination depends on the nature of the dopant. Such an effect occurs because for a given doping concentration the nonradiative recombination time of carriers is inversely proportional to the thermal velocity of the photoexcited carriers through the relation τnr = 1/Nstvthσ, and hence it is directly related to the square root of the effective mass of the holes. The PA signal is dependent mainly on the mobility of minority carriers. Since holes have higher effective mass, the corresponding recombination time for the n-type epitaxial layer is more than that for the p-type epitaxial layer, which is evident in the present studies.
5
Conclusion
In this paper, we have carried out a PA investigation of the thermal and transport properties of the photoexcited carriers in both n- and p-type GaAs epitaxial layers grown on GaAs substrate by the MBE method. The values for thermal diffusivity, diffusion coefficient, surface recombination velocity and nonradiative recombination time are found by fitting the experimentally obtained phase of the PA signal to the theoretical curve. From the analysis of the data, it is verified that these thermal and transport properties depend upon the type of doping. By judging the sensitivity of fitting between the experimental and the theoretical data, we can conclude that thermal diffusivity and transport properties of epitaxial layers can be easily and accurately obtained using the PA effect under heat transmission configuration. It is also suggested that the PA technique is a valuable tool to study the dynamics of photoexcited carriers. Acknowledgements This work was supported by the Netherlands University Federation for International Collaboration (NUFFIC). The authors wish to acknowledge Prof. J. H. Wolter and Prof. J. E. M. Haverkort (COBRA Group, Technical University of Eindhoven, The Netherlands). Dilna. S. wishes to acknowledge the Department of Science and Technology, India, for financial assistance. Sajan. D. George wishes to acknowledge the Council of Scientific and Industrial Research, India, for providing financial assistance.
References [1] A. Mandelis, Photoacoustic and Thermal Wave Phenomena in Semiconductors (North-Holland, New York, 1987). [2] A Rosencwaig, Photoacoustic and Photoacoustic Spectroscopy (Wiley Interscience, New York, 1983). [3] P. M. Nikolic, D. M. Todorovic, A. I. Bojicic, K. T. Radulovic, D. Urosevic, J. Elzar, V. Blagojevic, P. Mihajlovic, and M. Miletic, J. Phys.: Condens. Matter 8, 5673 (1996). [4] A. Pinto Neto, H. Vargas, N. F. Leite, and L. C. M. Miranda, Phys. Rev. B 40, 3924 (1989). [5] A. Pinto Neto, H. Vargas, N. F. Leite, and L. C. M. Miranda, Phys. Rev. B 41, 9971 (1990). [6] M. D. Dramicanin, Z. D. Ristovskvi, P. M. Nikolic, D. G. Vasiljevic, and D. M. Todorovic, Phys. Rev. B 51, 14226 (1995). [7] A. Fukuyama, Y. Akashi, K. Yoshino, K. Maeda, and T. Ikari, Phys. Rev. B 58, 12868 (1998). [8] I. Reich, P. Diaz, T. Prutskij, J. Mendoza, H. Vargas, and E. Marian, J. Appl. Phys. 86, 6222 (1999). [9] I. Reich, E. Marian, P.Diaz, J. J. Alvaradi-Gil, J. G. Mendeza Alvarez, H. Vargas, and J. Bernel Alvarado, phys. stat. sol (a) 169, 275 (1998). [10] I. Reich, P. Diaz, and E. Marian, phys. stat. sol. (b) 220, 305 (2000). [11] D. M. Todorovic, P. M. Nikolic, and A. I. Bojicic, J. Appl. Phys. 85, 7716 (1999). [12] D. M . Todorovic and P. M. Nikolic, Opt. Eng. 36, 432 (1997). [13] A. Rosencwaig and A. Gersho, J. Appl. Phys. 47, 64 (1976). [14] C. Christofides, F. Diakonos, A. Seas, C. Christou, M. Nestoros, and A. Mandelis, J. Appl. Phys. 80, 1713 (1996). [15] J. Singh, Semiconductor Optoelectronics Physics and Technology (Mc-Graw Hill, 1995). [16] S. Adachi, Physical Properties of III – V Semiconductor Components (Wiley, New York, 1992), p. 59. [17] S. M. Sze, Physics of Semiconductor Devices (Wiley Eastern, 1986).