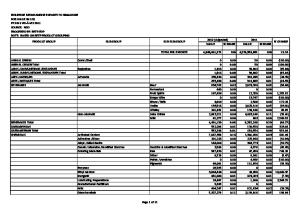
PHILIPPINE MERCHANDISE EXPORTS TO NETHERLANDS FOB VALUE IN US$ FY 2012 VIS-À-VIS 2011 SOURCE: NSO PROCESSED BY: BETP-EDP NOTE: BASED ON BETP PRODUCT GROUPING PRODUCT GROUP
SUB GROUP
SUB SUB GROUP TOTAL PHL EXPORTS
ANIMAL ORIGIN ANIMAL ORIGIN Total ARMS /AMMUNITIONS /EXPLOSIVES ARMS /AMMUNITIONS /EXPLOSIVES Total ARTS /ANTIQUES ARTS /ANTIQUES Total BEVERAGES BEVERAGES Total CARRAGEENAN CARRAGEENAN Total CHEMICALS
Coral /Shell Arms /Ammunitions Artworks Alcoholic Non-Alcoholic
Activated Carbon Adhesives /Glues Coloring Materials Ethyl Alcohol Inorganic Lubricating Preparations Misc Oleochemicals Plastic
Beer Juice Drinks
Inks Paints /Varnishes
Other Primary Form
Surfactants CHEMICALS Total COCONUT COCONUT Total CONSTRUCTION MATERIALS
Coir Aggregates Builders' Woodwork Cement Marble Tile /Slab Metal
Misc Tube /Pipe /Fitting
Misc Page 1 of 8
2012 (Adjusted) VALUE % SHARE
2011 VALUE % SHARE
% CHANGE
1,554,360,753
100
1,744,950,542
100
(10.92)
359,939 359,939 71 71 44,051 44,051 0 33,411 33,411 1,212,800 1,212,800 659,083 3,772 2,665 98,121 0 13,634 500 0 74,017,024 253,793 218,482 84,960 75,352,034 1,478 1,478 54,928 11,309 503,205 0 0 2,683 290,697
0.02 0.02 0.00 0.00 0.00 0.00 0.00 0.00 0.00 0.08 0.08 0.04 0.00 0.00 0.01 0.00 0.00 0.00 0.00 4.76 0.02 0.01 0.01 4.85 0.00 0.00 0.00 0.00 0.03 0.00 0.00 0.00 0.02
89,525 89,525 0 0 0 0 2,422 104,703 107,125 1,102,585 1,102,585 64,000 0 0 0 1,052 91,090 0 200,273 62,536,595 0 96,625 133,400 63,123,035 0 0 38,152 0 232,561 38,987 15,513 13,151 178,455
0.01 0.01 0.00 0.00 0.00 0.00 0.00 0.01 0.01 0.06 0.06 0.00 0.00 0.00 0.00 0.00 0.01 0.00 0.01 3.58 0.00 0.01 0.01 3.62 0.00 0.00 0.00 0.00 0.01 0.00 0.00 0.00 0.01
302.05 302.05
(100.00) (68.09) (68.81) 10.00 10.00 929.82
(100.00) (85.03) (100.00) 18.36 126.11 (36.31) 19.37
43.97 116.38 (100.00) (100.00) (79.60) 62.90
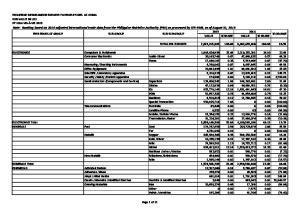
PRODUCT GROUP
SUB GROUP
SUB SUB GROUP
Prefab Building CONSTRUCTION MATERIALS Total ELECTRICALS
Generators & Transformers Instruments /Apparatus /Equipment Lighting /Fitting
Misc Plugs & Sockets
Misc Wires /Cables ELECTRICALS Total ELECTRONICS
Computers & Peripherals Consumer Electronics Measuring /Checking Instruments Office Equipment Scientific /Laboratory Apparatus Security /Safety /Control Apparatus Semiconductors (Components and Devices)
Telecommunications
ELECTRONICS Total FASHION ACCESSORIES
Gloves /Mittens Handbags /Belts Hats /Headgears Jewellery Misc
Travelgoods
Audio Visual Home
Capacitors Diodes ICs PCBs Resistors Special Transaction Facsimile Landline Phone Mobile /Cellular Phone Transmission /Radar Fashion Sport /Work
Costume Precious Article /Accessory Eyewear Lighters /Pipes Wigs /Toupees Misc Sport Bags Trunks /Cases /Satchels
FASHION ACCESSORIES Total Page 2 of 8
2012 (Adjusted) VALUE % SHARE 0 862,822 4,679,239 269,293 27,385,186 25,434 272,052,372 8,867,607 313,279,131 5,888,195 4,327,976 6,789,103 8,132,606 655,374 596,850 7,857 1,847 93,593,658 319,207,421 10,475 2,515 17,313,339 352,158 239,571 29,577,509 879,326 487,575,780 201,348 52,034 1,102,245 52,150 394,297 5,998 4,110 21,895,053 12,081,016 28,091 1,285,511 12,550 342,793 37,457,196
0.00 0.06 0.30 0.02 1.76 0.00 17.50 0.57 20.15 0.38 0.28 0.44 0.52 0.04 0.04 0.00 0.00 6.02 20.54 0.00 0.00 1.11 0.02 0.02 1.90 0.06 31.37 0.01 0.00 0.07 0.00 0.03 0.00 0.00 1.41 0.78 0.00 0.08 0.00 0.02 2.41
2011 VALUE % SHARE 25,279 542,098 750,519 89,857 12,279,720 94,175 243,173,841 99,386 256,487,498 5,562,578 6,466,266 9,883,743 105,884 4,654,768 3,020,239 0 0 268,359,233 190,338,415 54,071 0 59,863,621 0 0 0 2,899,229 551,208,047 41,074 85,366 671 85,119 943,197 0 0 18,013,152 8,970,702 35,017 225 0 0 28,174,523
0.00 0.03 0.04 0.01 0.70 0.01 13.94 0.01 14.70 0.32 0.37 0.57 0.01 0.27 0.17 0.00 0.00 15.38 10.91 0.00 0.00 3.43 0.00 0.00 0.00 0.17 31.59 0.00 0.00 0.00 0.00 0.05 0.00 0.00 1.03 0.51 0.00 0.00 0.00 0.00 1.61
% CHANGE (100.00) 59.16 523.47 199.69 123.01 (72.99) 11.88 8,822.39 22.14 5.85 (33.07) (31.31) 7,580.68 (85.92) (80.24)
(65.12) 67.71 (80.63) (71.08)
(69.67) (11.54) 390.21 (39.05) 164,169.00 (38.73) (58.20)
21.55 34.67 (19.78) 571,238.22
32.95
PRODUCT GROUP FLOWER /PLANT FLOWER /PLANT Total FOOTWEAR FOOTWEAR Total FOREST-BASED
FOREST-BASED Total FRESH FOOD
SUB GROUP Live Misc
Fibreboard Non-Wood Rough Wood Cocoa Beans Coffee Beans Fruits
Furnishing Furniture
FURNITURE /FURNISHINGS Total GAMES /SPORTS
GAMES /SPORTS Total GARMENT /TEXTILE
Misc
Slippers /Sandals Special Use
Roots & Tubers Seeds Spices
FRESH FOOD Total FURNITURE /FURNISHINGS
SUB SUB GROUP
Fishing /Hunting Games Sports
Apparel
Pit-props Misc Arabica Banana Mango Misc Pineapple Manioc, Arrowroot etc. Chili Misc Pepper Lamp /Lighting Matress / Cushion Indigenous Metal Parts /Supplies Plastic Stone Wood
Balls Gym / Athlete Cotton Man-Made Other Silk /Vegetable Wool Page 3 of 8
2012 (Adjusted) VALUE % SHARE 338,802 36,929 375,731 0 9,174,570 9,174,570 56,158 37,777 4,570 98,505 0 66,245 378,078 15,980 6,900 0 0 0 359 0 0 467,562 307,230 3,100 526,454 3,004,698 226,652 62,349 100,520 1,570,479 5,801,482 498,110 8,611 9,648,980 60 10,155,761 8,950,630 22,915,713 2,776,809 1,645,422 609,960
0.02 0.00 0.02 0.00 0.59 0.59 0.00 0.00 0.00 0.01 0.00 0.00 0.02 0.00 0.00 0.00 0.00 0.00 0.00 0.00 0.00 0.03 0.02 0.00 0.03 0.19 0.01 0.00 0.01 0.10 0.37 0.03 0.00 0.62 0.00 0.65 0.58 1.47 0.18 0.11 0.04
2011 VALUE % SHARE 788,321 112,800 901,121 47,830 7,484,501 7,532,331 0 6,650 0 6,650 39,688 0 0 5,000 0 6,890 279 381 0 12,626 1,602 66,466 637,884 132,474 713,592 2,719,003 373,478 124,664 54,574 1,834,174 6,589,843 484,795 0 9,676,255 0 10,161,050 19,426,566 14,264,259 1,187,361 2,158,388 1,070,002
0.05 0.01 0.05 0.00 0.43 0.43 0.00 0.00 0.00 0.00 0.00 0.00 0.00 0.00 0.00 0.00 0.00 0.00 0.00 0.00 0.00 0.00 0.04 0.01 0.04 0.16 0.02 0.01 0.00 0.11 0.38 0.03 0.00 0.55 0.00 0.58 1.11 0.82 0.07 0.12 0.06
% CHANGE (57.02) (67.26) (58.30) (100.00) 22.58 21.80 468.08 1,381.28 (100.00)
219.60 (100.00) (100.00) (100.00) (100.00) (100.00) 603.46 (51.84) (97.66) (26.22) 10.51 (39.31) (49.99) 84.19 (14.38) (11.96) 2.75 (0.28) (0.05) (53.93) 60.65 133.86 (23.77) (42.99)
PRODUCT GROUP
SUB GROUP Non-Apparel
GARMENT /TEXTILE Total GLASS MANUFACTURES GLASS MANUFACTURES Total HEALTH SUPPLEMENTS HEALTH SUPPLEMENTS Total HOUSEWARES
SUB SUB GROUP Fabric Made-Up Articles Yarn
Misc
Artificial Flowers / Trees Basketworks Holiday Décor Misc Shellcraft Statuette Table /Kitchen
Misc Utensil
Woodware HOUSEWARES Total INDUSTRIAL SCRAPS /PARINGS /WASTES
Metal
Iron /Steel Misc
Misc Plastic INDUSTRIAL SCRAPS /PARINGS /WASTES Total LIVE ANIMALS LIVE ANIMALS Total MACHINERY
MACHINERY Total MARINE /AQUACULTURE
Misc Agro-Forestry Conveyors /Handling Excavation /Construction Heating /Material Treatment Lathes Mechanical Machines /Apparatus Office Machines Parts /Tools /Accessories Printing /Binding /Packaging Pumps /Compressors /Fans Rolling /Filtering Crustaceans
Crabs Shrimps /Prawns
Fish Eggs Fish Eggs/Sardines Page 4 of 8
2012 (Adjusted) VALUE % SHARE 72,229 1,565,666 319 38,536,748 306,744 306,744 88,601 88,601 11,656 177,989 117,354 311,216 458,627 1,793,694 206,740 29,645 112,999 3,219,920 44,474 0 535 78,000 123,009 94,463 94,463 86,367 111,004 83 22,298,500 405,349 393,899 13,260 3,949,331 51,944 1,608,220 14,331 28,932,288 0 97,791 23,830 9,368,789
0.00 0.10 0.00 2.48 0.02 0.02 0.01 0.01 0.00 0.01 0.01 0.02 0.03 0.12 0.01 0.00 0.01 0.21 0.00 0.00 0.00 0.01 0.01 0.01 0.01 0.01 0.01 0.00 1.43 0.03 0.03 0.00 0.25 0.00 0.10 0.00 1.86 0.00 0.01 0.00 0.60
2011 VALUE % SHARE 388,843 171,398 0 38,666,817 181,847 181,847 45,956 45,956 1,886 425,231 309,321 325 763,435 2,927,956 156,316 0 99,897 4,684,367 222,190 5,000 0 272,400 499,590 98,821 98,821 0 0 0 0 0 16,108 93,932 3,427,310 0 6,390,349 47,488 9,975,187 30 162,055 28,600 170,921
0.02 0.01 0.00 2.22 0.01 0.01 0.00 0.00 0.00 0.02 0.02 0.00 0.04 0.17 0.01 0.00 0.01 0.27 0.01 0.00 0.00 0.02 0.03 0.01 0.01 0.00 0.00 0.00 0.00 0.00 0.00 0.01 0.20 0.00 0.37 0.00 0.57 0.00 0.01 0.00 0.01
% CHANGE (81.42) 813.47 (0.34) 68.68 68.68 92.80 92.80 518.03 (58.14) (62.06) 95,658.77 (39.93) (38.74) 32.26 13.12 (31.26) (79.98) (100.00) (71.37) (75.38) (4.41) (4.41)
2,345.36 (85.88) 15.23 (74.83) (69.82) 190.04 (100.00) (39.66) (16.68) 5,381.36
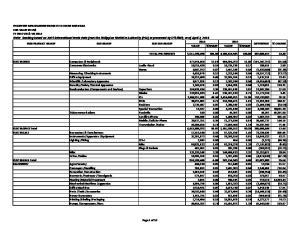
PRODUCT GROUP
SUB GROUP Fish Fillet /Meat Fresh /Chilled /Frozen Molluscs Tuna
MARINE /AQUACULTURE Total MEDIA /ENTERTAINMENT MEDIA /ENTERTAINMENT Total MEDICAL SUPPLY /DEVICE MEDICAL SUPPLY /DEVICE Total METAL MANUFACTURES
Recorded
Aluminum Copper Iron /Steel /Alloy
SUB SUB GROUP
Fresh /Chilled /Frozen Misc Other
Bolts /Nuts Misc
Misc METAL MANUFACTURES Total MINERALS MINERALS Total MISC. INDUSTRIAL PRODUCTS MISC. INDUSTRIAL PRODUCTS Total MUSICAL INSTRUMENTS MUSICAL INSTRUMENTS Total OILS /FATS /WAXES
OILS /FATS /WAXES Total PACKAGING PACKAGING Total PAPER MANUFACTURES PAPER MANUFACTURES Total PERSONAL CARE
PERSONAL CARE Total PET FOOD /ANIMAL FEEDS PET FOOD /ANIMAL FEEDS Total PHARMACEUTICALS
Metallic
Misc
Misc Animal Coconut Vegetable
Land Palm /Palm Kernel /Babassu
Paper Plastic Coated Misc Beauty /Make-up Haircare Misc Vegetable Fats /Oils /Oil Cake Residues Goods /Supplies Medicaments
Bandage /Poultice /Dressing Specialised Vitamin Page 5 of 8
2012 (Adjusted) VALUE % SHARE 7,000 0 0 1,336,100 3,602,353 14,435,863 0 0 904,133 904,133 15,431 68,377 743,142 175,994 2,149,027 3,151,971 0 0 1,430,099 1,430,099 2,384 2,384 41,219,966 329,497,117 196,818 370,913,901 16,527 707,013 723,540 0 171,530 171,530 8,074 8,107 57,576 73,757 7,577,439 7,577,439 146,849 0 0
0.00 0.00 0.00 0.09 0.23 0.93 0.00 0.00 0.06 0.06 0.00 0.00 0.05 0.01 0.14 0.20 0.00 0.00 0.09 0.09 0.00 0.00 2.65 21.20 0.01 23.86 0.00 0.05 0.05 0.00 0.01 0.01 0.00 0.00 0.00 0.00 0.49 0.49 0.01 0.00 0.00
2011 VALUE % SHARE 7,500 420 72,525 739,891 8,794,773 9,976,715 806 806 703,066 703,066 0 64,100 2,033,259 25,562 86,117 2,209,038 160,922 160,922 1,087,472 1,087,472 2,066 2,066 0 552,808,295 0 552,808,295 78,722 342,665 421,387 144 671,373 671,517 34,482 10,270 122,743 167,495 0 0 1,695 1,591 7,200
0.00 0.00 0.00 0.04 0.50 0.57 0.00 0.00 0.04 0.04 0.00 0.00 0.12 0.00 0.00 0.13 0.01 0.01 0.06 0.06 0.00 0.00 0.00 31.68 0.00 31.68 0.00 0.02 0.02 0.00 0.04 0.04 0.00 0.00 0.01 0.01 0.00 0.00 0.00 0.00 0.00
% CHANGE (6.67) (100.00) (100.00) 80.58 (59.04) 44.70 (100.00) (100.00) 28.60 28.60 6.67 (63.45) 588.50 2,395.47 42.69 (100.00) (100.00) 31.51 31.51 15.39 15.39 (40.40) (32.90) (79.01) 106.33 71.70 (100.00) (74.45) (74.46) (76.58) (21.06) (53.09) (55.96)
8,563.66 (100.00) (100.00)
PRODUCT GROUP
PHARMACEUTICALS Total PHOTOGRAPHY PHOTOGRAPHY Total PROCESSED FOOD
SUB GROUP
SUB SUB GROUP
Therapeutic /Diagnostic Use Veterinary Use Waste
Misc
Supplies /Accessories
Misc
Cereals /Flours
Biscuit /Waffle /Wafer Bread /Cake /Pastry Meal /Powder /Flake /Pellet Misc Mixes /Dough Pasta /Noodle Misc
Cocoa Coconut Coffee Confectionery
Dairy Food Ingredients Fruits & Extracts
Meat /Meat Preparation Nuts Sauce /Spread Seasonings /Condiments
Soup /Broth Sugar /Sweeteners
Tea /Mate Vegetables
Not Decaffeinated Candy Chocolate Misc Cheese /Curd Dried Frozen Jam /Jellie /Marmalade Juices & Concentrates Prepared /Preserved Provisionally Preserved Puree Misc Misc Misc Mixed Seasonings & Condiments Vinegar /Substitutes Cane /Beet Sugar Misc Molasses Muscovado Dried Fresh /Chilled /Frozen Page 6 of 8
2012 (Adjusted) VALUE % SHARE 5,760 523 212,486 365,618 0 0 28,377 643 68,390 400,217 18,338 441,246 420,063 18,025,796 0 1,485 4,228 1,031 56 13,720 1,866,685 47,802 27,838 16,437,385 5,351,043 0 1,063,754 0 8,585 267,832 78,229 133,035 43,702 44,168 0 44,190 0 0 1,800 3,849 131
0.00 0.00 0.01 0.02 0.00 0.00 0.00 0.00 0.00 0.03 0.00 0.03 0.03 1.16 0.00 0.00 0.00 0.00 0.00 0.00 0.12 0.00 0.00 1.06 0.34 0.00 0.07 0.00 0.00 0.02 0.01 0.01 0.00 0.00 0.00 0.00 0.00 0.00 0.00 0.00 0.00
2011 VALUE % SHARE 0 0 0 10,486 575,316 575,316 23,911 6,481 82,151 479,249 46,756 738,845 632,207 23,245,190 39,688 5,759 768 0 0 12,220 3,084,505 70,833 69,031 8,278,489 4,867,394 2,424 773,347 15,889 9,652 226,478 134,889 278,548 71,367 122,264 103,260 0 1,657,500 50,100 0 6,046 1,226
0.00 0.00 0.00 0.00 0.03 0.03 0.00 0.00 0.00 0.03 0.00 0.04 0.04 1.33 0.00 0.00 0.00 0.00 0.00 0.00 0.18 0.00 0.00 0.47 0.28 0.00 0.04 0.00 0.00 0.01 0.01 0.02 0.00 0.01 0.01 0.00 0.09 0.00 0.00 0.00 0.00
% CHANGE
3,386.73 (100.00) (100.00) 18.68 (90.08) (16.75) (16.49) (60.78) (40.28) (33.56) (22.45) (100.00) (74.21) 450.52
12.27 (39.48) (32.51) (59.67) 98.56 9.94 (100.00) 37.55 (100.00) (11.05) 18.26 (42.00) (52.24) (38.76) (63.87) (100.00) (100.00) (100.00) (36.34) (89.31)
PRODUCT GROUP
SUB GROUP
SUB SUB GROUP Prepared /Preserved Provisionally Preserved
PROCESSED FOOD Total PULPS /FIBERS
Natural
Abaca Misc
Synthetic PULPS /FIBERS Total RUBBER MANUFACTURES RUBBER MANUFACTURES Total SEAWEEDS SEAWEEDS Total SOAP /DETERGENT SOAP /DETERGENT Total SPECIAL TRANSACTIONS
Misc Tube /Pipe
Consignment
Clothing Articles Footwear Jewellery Misc
Misc Replacement/Returned Temporary Import /Export SPECIAL TRANSACTIONS Total STATIONERY
STATIONERY Total TIMEPIECES TIMEPIECES Total TOBACCO
TOBACCO Total TOYS
TOYS Total TRANSPORT
Misc Paper Printed Matter Publications
Books
Clock Watch Leaves
Dried Misc Rolled
Dolls Misc Puzzle /Constructional Scale Models Aviation /Aerospace Land
Bicycles /Parts Page 7 of 8
2012 (Adjusted) VALUE % SHARE 12,977 0 44,856,595 22,096,411 0 22,200 22,118,611 189,546 2,618,182 2,807,728 21,370 21,370 4,918 4,918 8,326,178 0 2,252,150 36,425,773 442,687 3,443,231 1,229,143 52,119,162 157,076 296 100 26,544 184,016 71,446 7,022,995 7,094,441 462,792 353,975 63,360 880,127 390,679 175,751 6,632 12,285 585,347 31,445 4,715,262
0.00 0.00 2.89 1.42 0.00 0.00 1.42 0.01 0.17 0.18 0.00 0.00 0.00 0.00 0.54 0.00 0.14 2.34 0.03 0.22 0.08 3.35 0.01 0.00 0.00 0.00 0.01 0.00 0.45 0.46 0.03 0.02 0.00 0.06 0.03 0.01 0.00 0.00 0.04 0.00 0.30
2011 VALUE % SHARE 1,723 1,957 45,140,147 24,689,869 6,844 23,125 24,719,838 193,109 0 193,109 469,053 469,053 6,790 6,790 32,491,325 30,098 3,212,733 64,106,720 691,867 9,598,616 495,228 110,626,587 337,979 35,173 1,128 2,883 377,163 0 0 0 3,460,684 280,647 0 3,741,331 261,855 324,109 0 73,332 659,296 0 3,643,639
0.00 0.00 2.59 1.41 0.00 0.00 1.42 0.01 0.00 0.01 0.03 0.03 0.00 0.00 1.86 0.00 0.18 3.67 0.04 0.55 0.03 6.34 0.02 0.00 0.00 0.00 0.02 0.00 0.00 0.00 0.20 0.02 0.00 0.21 0.02 0.02 0.00 0.00 0.04 0.00 0.21
% CHANGE 653.16 (100.00) (0.63) (10.50) (100.00) (4.00) (10.52) (1.85) 1,353.96 (95.44) (95.44) (27.57) (27.57) (74.37) (100.00) (29.90) (43.18) (36.02) (64.13) 148.20 (52.89) (53.52) (99.16) (91.13) 820.71 (51.21)
(86.63) 26.13 (76.48) 49.20 (45.77) (83.25) (11.22) 29.41
PRODUCT GROUP
SUB GROUP
SUB SUB GROUP Motor Vehicle Parts Motorcycle Parts
Maritime TRANSPORT Total TWINES /CORDAGES /NETS TWINES /CORDAGES /NETS Total
Page 8 of 8
2012 (Adjusted) VALUE % SHARE 4,537,394 48 642,116 9,926,265 457,841 457,841
0.29 0.00 0.04 0.64 0.03 0.03
2011 VALUE % SHARE 4,970,748 35,267 878,089 9,527,743 450,422 450,422
0.28 0.00 0.05 0.55 0.03 0.03
% CHANGE (8.72) (99.86) (26.87) 4.18 1.65 1.65