J. Phys. Chem. B 2005, 109, 5375-5382
5375
pH Dependence of the Electronic Structure of Glycine B. M. Messer,† C. D. Cappa,† J. D. Smith,† K. R. Wilson,‡ M. K. Gilles,‡ R. C. Cohen,† and R. J. Saykally*,† Department of Chemistry, UniVersity of California, Berkeley, California 94720-1460, and AdVanced Light Source, Lawrence Berkeley National Laboratory, Berkeley, California 94720 ReceiVed: September 17, 2004; In Final Form: NoVember 15, 2004
The carbon, nitrogen, and oxygen K-edge spectra were measured for aqueous solutions of glycine by total electron yield near-edge X-ray absorption fine structure (TEY NEXAFS) spectroscopy. The bulk solution pH was systematically varied while maintaining a constant amino acid concentration. Spectra were assigned through comparisons with both previous studies and ab initio computed spectra of isolated glycine molecules and hydrated glycine clusters. Nitrogen K-edge solution spectra recorded at low and moderate pH are nearly identical to those of solid glycine, whereas basic solution spectra strongly resemble those of the gas phase. The carbon 1s f π*CdO transition exhibits a 0.2 eV red shift at high pH due to the deprotonation of the amine terminus. This deprotonation also effects a 1.4 eV red shift in the nitrogen K-edge at high pH. Two sharp preedge features at 401.3 and 402.5 eV are also observed at high pH. These resonances, previously observed in the vapor-phase ISEELS spectrum of glycine,1 have been reassigned as transitions to σ* bound states. The observation of these peaks indicates that the amine moiety is in an acceptor-only hydrogen bond configuration at high pH. At low pH, the oxygen 1s f π*CdO transition exhibits a 0.25-eV red shift due to the protonation of the carboxylic acid terminus. These spectral differences indicate that the variations in electronic structure observed in the NEXAFS spectra are determined by the internal charge state and hydration environment of the molecule in solution.
1. Introduction Individual amino acids exist as cations in acidic media, charge neutral zwitterions at intermediate pH values, and anions in basic solutions. This strong pH dependence of the charge state is reflected in the sensitivity of properties of the peptides and proteins built from individual amino acids to changes in their environment. Such changes in local environment can alter protein shape and reactivity, which in turn can have dramatic effects on their biological activity.2 Hence, the electronic structure and chemical behavior of amino acids has been of continued interest to both chemists and molecular biologists. Soft X-ray spectroscopy has been used extensively to characterize electronic structure in amino acids and peptides.1,3-11 Nearedge X-ray absorption fine structure (NEXAFS) spectroscopy, inner shell electron energy loss spectroscopy (ISEELS), and scanning transmission X-ray microscopy (STXM) have been employed in studies of spin- cast thin films of all 20 basic amino acids,6 amino acid monolayers adhered to metallic substrates,3,4 and both vapor9-11 and solid thin film samples of specific amino acids and their respective di- and tripeptides.1,7,8 These experiments have been supported by a variety of theoretical efforts.3,4,6,12,13 Because of technical limitations, all of these studies have been performed on amino acids in nonbiological environments. Biological systems are almost universally aqueous systems.2 Isolated amino acids are strictly neutral in the gas phase but take the form of zwitterions in the condensed phase. However, in solution, a wide variety of charge states exist, the relative * Corresponding author. E-mail:
[email protected]. † University of California. ‡ Lawrence Berkeley National Laboratory.
populations of which are determined by the pH of the solution. If these differences in charge state were caused simply by the addition or removal of an electron, one might expect that the NEXAFS spectra of amino acids would be relatively insensitive to changes in pH. However, the addition or removal of a proton alters the local symmetry of the electric field surrounding the terminal nitrogen or oxygen. Thus, a change in pH can engender a dramatic difference in the energy levels of any molecular orbitals involving the amine or carboxylic acid moieties. Recent studies by Gordon et al.1 and Zubavichus et al.5 invoke this interpretation to explain the disappearance of resonances in the oxygen K-edge spectrum of glycine observed upon condensation. The nitrogen K-edge spectrum also exhibited dramatic differences between solid and gas-phase glycine.1 Two of the sharp resonances in the vapor phase spectrum have been assigned to Rydberg states, and Gordon et al. rationalize the disappearance of these peaks in the thin film spectrum by noting that gas-phase NEXAFS spectra have sharp resonances that often either broaden into a continuum or disappear altogether upon condensation. However, given the change in charge state that occurs upon condensation, their interpretation is not unique. In aqueous solutions of glycine, both solvent and solute molecules surround each amino acid molecule. Therefore, if condensation effects were responsible for the observed spectral variations, the nitrogen K-edge spectrum of aqueous glycine should exhibit little pH dependence. A strong pH dependence in the nitrogen K-edge would instead suggest that charge state and solvation environment dominate the behavior of the NEXAFS spectrum. Kaznacheyev et al.6 have previously attempted to measure the pH dependence of the carbon K-edge using STXM, although
10.1021/jp0457592 CCC: $30.25 © 2005 American Chemical Society Published on Web 01/22/2005
5376 J. Phys. Chem. B, Vol. 109, No. 11, 2005 the results of those measurements were ambiguous, as the small liquid droplets sandwiched between silicon nitride windows used in that study yielded insufficient sensitivity. Ultimately, the carbon K-edge is unlikely to exhibit any strong pH dependence, as the solid and vapor spectra are very similar to each other, and little change in the electronic structure is expected as the charge state is varied. Additionally, there is some uncertainty as to the charge state of the solid thin films used in previous STXM studies.6 To produce the amorphous thin films appropriate for STXM measurement, the amino acid samples were first dissolved in trifluoroacetic acid (TFA). The TFA then rapidly evaporates, and the acidity of the resulting sample is assumed to be the same as that of the original material. At least two other techniques have also been employed to determine the pH dependence of amino acid and protein solutions. NMR spectroscopy has been used to investigate the folding and interchain coupling of numerous proteins as a function of pH.14-16 Additionally, NMR studies have been used to determine the number of water molecules participating in hydrogen bonding with either the amine or carboxylic acid portions of amino acids.17,18 Raman spectroscopy studies have been used to determine when polypeptide chains first start to form R-helixes,19 to determine the helical content of various proteins as a function of pH,20 and along with vibrational circular dichroism (VCD) were used to measure the optical activity of alanine21 and asparagine22 as a function of pH. NEXAFS differs from NMR and Raman spectroscopies in that it is a direct probe of electronic structure.23 Ideally, our understanding of the electronic structure of proteins and complex biomolecules could be enhanced from a thorough description of the electronic structure of the constituent amino acids and polypeptides. It is the goal of this work to improve such understanding by systematically exploring the effect of solvation and pH on amino acid electronic structure. Here we report the experimental measurement of the NEXAFS spectra of aqueous glycine for all relevant charge states and elemental K-edges. To overcome the technical difficulties inherent in characterizing volatile liquids, we have exploited the technology of liquid microjets originally developed by Faubel et al.24 and further developed by Wilson et al.25-27 Extensive density functional theory studies were performed using a commercial software package28 to make spectral assignments and analyze the effect of pH on the electronic structure of aqueous glycine. To our knowledge, this is the first such study of this system performed in an aqueous environment. 2. Experimental and Computational Methods 2.1. Samples. Glycine (C2H5NO2, NH2CH2CO2H) was obtained commercially from Fischer Scientific in the form of a crystalline powder with a stated purity of better than 99%. This was used without further purification. Sample solutions were prepared by dissolving enough glycine in 18 MΩ water (Millipore) to create a 10% by mass glycine solution. To create acidic or basic samples, an equimolar amount of reagent grade HCl or NaOH, also obtained from Fischer, were added to the crystalline glycine before being diluted to 10% glycine with 18 MΩ water. These solutions were later mixed with equal volumes of deionized water to form an approximately 5% by mass (∼0.6 M) solution. 2.2. NEXAFS Spectroscopy of Aqueous Solutions. The X-ray absorption spectra were recorded over all pertinent energy ranges for each sample solution. The carbon K-edge (∼300 eV), nitrogen K-edge (∼400 eV), and oxygen K-edge (∼530 eV)
Messer et al. were recorded at Beamline 8.0.1 of the Advanced Light Source in Berkeley, CA. A detailed description of the experimental apparatus has recently been given by Wilson et al.27 Briefly, an intense (1012 photons s-1) tunable beam of X-ray radiation is generated by means of a undulator insertion device. This spectrally narrow (∆E/E ) 4000 at 500 eV) radiation is focused onto an approximately 30 µm diameter jet of the sample solution. The jet is produced by an HPLC pump (Jasco PU2089) pressurizing the liquid to ∼5 MPa behind a fused glass capillary tip pulled with a CO2 laser to a final diameter of 30 µm. This jet is then injected horizontally into an evacuated chamber, parallel to the polarization vector of the incident radiation. After traveling briefly (∼2 mm ) ∼80 µs) in a vacuum, the jet is intersected by a 50 µm diameter X-ray beam at 90°. The room temperature solution evaporatively cools upon injection into the vacuum chamber, and the sample is determined to be 15-20 °C27 when probed by the X-ray beam. The jet is subsequently collected in a separate cryogenic trapping chamber. The liquid microjet approach provides a continuous supply of fresh sample solution, avoiding the introduction of contamination from radiation damage. The probability of a molecule being doubly excited during the ∼5 µs exposure time is calculated to be approximately 10-7. The pressure in the interaction chamber is maintained at ∼6 × 10⁻⁵ Torr, whereas two sections of differential pumping allow windowless coupling to the beamline, maintained at ∼5 × 10⁻¹⁰ Torr. This windowless coupling permits the measurement of all three edges without any interference or loss of flux introduced by a Si3N4 window, used in the previous NEXAFS studies of amino acids and poly-peptides.1,5-8 The decreased background pressure is sufficiently low to allow efficient collection of the electrons created by the X-ray excitation of the sample. In this way, the total electron yield (TEY) is sampled by means of a positively biased 1 mm2 copper electrode placed within 0.5 mm of the interaction region. The detected current is amplified and converted to a voltage before being sent to a V-F converter for input into the beamline computer. This signal is then normalized to the current measured from a gold mesh located 3 m upbeam of the interaction region. Specific metal impurities in the monochromator optics provide an X-ray energy calibration over the entire range of interest. For gas-phase systems, observed line widths in the energy range 200-500 eV are generally determined by the lifetime of the respective core hole decay processes and the lifetime of the resulting photoelectron. These natural line widths are inhomogeneously broadened in the condensed phase because of the increased density of states and solvent interactions. 2.3. Computational Methods. To analyze the spectra collected in these experiments, the NEXAFS spectra of each charge state of glycine were calculated using density functional and transition-potential methods. The StoBe DeMon 2.028 software package is a commercially available implementation of these approaches, and was used for all energetic and spectral calculations presented in this work. In these calculations, the correlation functional formulated by Perdew, Berke, and Ernzerhof29 and the revised exchange functional formulated by Hammer30 were used along with the optimized DZVP basis set provided. The single point energies and optimized geometries were calculated for several conformers of each glycine charge state under investigation. The resulting energy of each conformer was then used to generate a Boltzman distribution for each charge state. For each species, only one conformer was found to be significantly populated at the jet temperature (15 °C). These geometries, depicted in Figure 1, were then used for all
pH Dependence of Electronic Structure of Glycine
J. Phys. Chem. B, Vol. 109, No. 11, 2005 5377
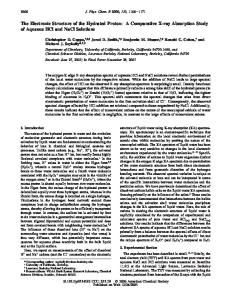
Figure 1. Neutral, zwitterionic, cationic, and anionic forms of glycine. In each case, the minimum-energy geometry was determined for each charge state. At room temperature, these are the only significantly populated species for each charge state, as determined by a Boltzmann weighting of the calculated single point energies of several possible conformers for each species.
TABLE 1. Geometries Used for StoBe DeMon 2.0 DFT Calculations Corresponding to Those Shown in Figure 1a neutral
zwitterion
position (Å) atom
X
Y
C1 C2 N O1 O2 H H H H H
0.1973 0.1973 -1.1183 1.4801 -0.7995 1.3774 0.7765 0.7765 -1.6494 -1.6494
position (Å) Z
-1.1107 0.0000 0.4322 0.0000 -1.7546 0.0000 0.9356 0.0000 1.1507 0.0000 1.9106 0.0000 -1.4414 0.8761 -1.4414 -0.8761 -1.4294 0.8115 -1.4294 -0.8115
atom
X
Y
C1 C2 N O1 O2 H H H H H
0.4140 0.4139 -1.0636 1.5511 -0.7765 -1.2525 0.8850 0.8850 -1.4980 -1.4980
-1.0024 0.0000 0.5934 0.0000 -1.4147 0.0000 1.1103 0.0000 1.0763 0.0000 -2.4271 0.0000 -1.4175 0.8981 -1.4175 -0.8981 -0.9287 0.7999 -0.9287 -0.7999
cation
anion
position (Å)
position (Å)
atom
X
C1 C2 N O1 O2 H H H H H H
0.2237 0.2237 -1.2422 1.4669 -0.8340 1.4181 -1.7641 0.7216 0.7216 -1.5078 -1.5078
Y
Z
-1.1325 0.0000 0.4136 0.0000 -1.5342 0.0000 0.9048 0.0000 1.0436 0.0000 1.8877 0.0000 -0.6192 0.0000 -1.5248 0.8928 -1.5248 -0.8928 -2.0756 0.8325 -2.0756 -0.8325
atom
X
C1 C2 N O1 O2 H H H H
0.3089 0.3089 -1.0219 1.4734 -0.8400 0.8810 0.8810 -1.5265 -1.5265
Z
Y
Z
-1.0415 0.0000 0.5486 0.0000 -1.7299 0.0000 1.0738 0.0000 1.1172 0.0000 -1.3819 0.8794 -1.3819 -0.8794 -1.3061 0.7895 -1.3061 -0.7895
a Lowest-energy geometry of each charge species investigated in this work. See the text for a detailed description of the basis set, excitation scheme, and exchange/correlation functionals used.
further calculations. For reference, the Cartesian coordinates of each atom are provided in Table 1. To calculate the NEXAFS spectra of each conformer, the minimum-energy geometries and exchange/correlation functionals were maintained while the basis sets were changed as follows. The atom of interest was modeled using the IGLO basis set developed by Huzinaga,31 and all remaining non-hydrogen atoms were replaced with the prepackaged model core potentials developed by Pettersson.28 This allows the energetic isolation of the 1s state of interest, which is then partially excited by replacing its R electron with a half core hole. This “transitionpotential” method has been used in multiple R scattering calculations and DFT calculations to simulate the excited state of the system.23 The transition-potential method has been found
to approximate the relaxation of the molecule under the influence of the core-hole and is sufficiently accurate and self-consistent for the relative comparisons made in this work. The resulting list of transitions and oscillator strengths are then convoluted with a series of Gaussians to reproduce the experimental spectrum. Care was taken to maintain a reasonable width for each transition, varying between 0.25 eV for sharp 1s f π* transitions and 2-4 eV for 1s f σ* and continuum transitions. These values were chosen to reflect the widths observed in previous experimental spectra, as well as to reasonably reproduce the spectra measured in this work. Transition assignments were obtained by examining the spatial extent of the molecular orbital of the final state and by comparison of relative oscillator strengths and positions. Varying the exchange/correlation functionals and basis sets used was found to change the absolute value and position of the calculated transitions, but the relative spacing and intensities were well preserved, requiring only a constant energetic offset to provide consistent agreement with the experimental spectra. To determine the effect of solvent interaction on the NEXAFS spectra, the process described above was repeated on several hydrated glycine clusters, each containing a single glycine molecule surrounded by seven water molecules. No qualitative difference was observed between the calculated spectra of the isolated molecule and that of the hydrated cluster at the carbon and oxygen K edges, and the effect of hydration at the nitrogen K-edge is discussed below. 3. Results and Discussion Both subtle and dramatic changes are observed in the NEXAFS spectra of aqueous glycine upon shifting the pH away from the isoelectric point (pI). These effects can be rationalized via a combination of DFT calculations and comparison to the analogous NEXAFS spectra of solid (thin film) and gas-phase glycine. To provide a systematic rationalization of these effects, the next three subsections will address the NEXAFS spectra of each pertinent atomic region (K-edges of C, N, and O) in order of increasing energy. 3.1. Carbon K-Edge. Figure 2 shows the carbon K-edge TEY NEXAFS spectrum of a 0.6 M aqueous glycine solution at pH ) pI ) 5.97 (B), compared to the solid scanning transmission microscopy (STXM) spectrum (C), and the gas-phase innershell electron energy-loss spectroscopy (ISEELS) spectrum (A) measured by Gordon et al.1 Although the spectra of all three species are quite similar, there are noticeable differences in the width and relative intensities of the resonances located between 290 and 300 eV. These resonances have been assigned to transitions to a combination of σ* and Rydberg states on either the carboxylic or amine carbons.1,5,6 The oscillations apparent in both the solid and aqueous phase spectra are absent in the gas phase spectrum. This is most likely due to the fact that the gas phase spectrum was measured using ISEELS, and the resulting loss in resolution has broadened these peaks into a single continuum. Furthermore, the higher-energy resonances of the solid phase spectrum have also been broadened into a single feature. As STXM and TEY NEXAFS have very similar spectral resolution, this broadening is most likely due to interactions between neighboring glycine molecules within the crystalline sample. In many crystalline solids, the numerous Rydberg transitions located around the ionization potential merge to form a single broad resonance.32 As will be demonstrated below, the density of states within the 295-305 eV range is quite large, and these resonances can quite easily form a single continuum band.
5378 J. Phys. Chem. B, Vol. 109, No. 11, 2005
Figure 2. Carbon 1s NEXAFS spectra of glycine. A. Gas-phase signal measured by inner-shell electron energy loss spectroscopy (ISEELS) in the dipole regime.1 B. Aqueous (0.6 M, pH 5.97) signal measured by total electron yield (TEY) NEXAFS. C. Thin solid film measured by scanning transmission X-ray microscopy (STXM).1
As evident in Figure 1, the carbon backbone is expected to be relatively unaffected by pH, compared to the nitrogen and oxygen termini. This suggests that any changes in electronic structure around the carbon atoms will be subtle, and that the resulting differences in the TEY NEXAFS of the carbon K-edge will be minor. This prediction is verified in Figure 3, which depicts the TEY spectra of 0.6 M glycine solutions at pH ) 11.86 (A), 5.97 (B), and 1.11 (C). The only noticeable changes observed as one varies [H+] over 11 decades are a small (0.15 eV) red shift in the first sharp resonance around 287 eV at high pH and a redistribution in the relative heights and widths of the broad resonances between 290 and 305 eV. The sharp resonance has previously been assigned to a 1s f π* transition localized on the carboxylic carbon,1,5,6 whereas the broad transitions have been assigned to transitions to mixed σ*Rydberg states.1,5,6 It is somewhat surprising that the shift in the π* orbital occurs in basic solution, because the carboxyl terminus is qualitatively identical in the anionic and zwitterionic species. To rationalize this energy shift, as well as the other subtle spectral differences observed, the carbon K-edge spectra for each functional group were calculated for the lowest-energy conformer of the cation, zwitterion, and anion. The calculated spectra of the amine (solid) and carboxylic (dotted) carbons are compared to the corresponding experimental spectra in Figure 4. The stick spectra used to create each spectrum are also included. From this information, a spectral assignment can be made for each of the observed species. A strong peak near 287 eV is observed for all three forms of glycine. From the calculated spectra and previous assignments1,5,6 this can be assigned to the C 1s f πCdO* transition. The red shift of this transition at high pH is actually overestimated in the calculated spectra (0.375 eV). A smaller red shift (0.07 eV) is also predicted for the acidic species. Although this shift is below the experimental resolution of this work, there is
Messer et al.
Figure 3. Effect of pH on the TEY NEXAFS C K-edge spectra of 0.6 M glycine (aq). The solution pH was 11.86, 5.97, 1.11 for spectra A, B, and C, respectively. Each spectrum has been background subtracted and normalized to the excitation flux. Offsets have been included for clarity and to correct for energy calibration. Special note should be made of the small (0.15 eV) energy shift observed in the C 1s f π*Cd O resonance centered at 289 eV at pH 11.86.
a shift of ∼0.1 eV in the peak position of the C 1s f πCdO* transition when the acidic and neutral spectra are fit to a Lorentzian line shape. The relative position of the C 1s f πCd O* transition is extremely sensitive to the electronegativity of the neighboring substituents of the carbonyl carbon,33 with an observed red shift of 3.8 eV in poly(vinyl methyl ketone) when compared to polycarbonate. In light of this sensitivity, the red shift at high pH can be explained in terms of the decrease in electronegativity that occurs upon deprotonation. The smaller shift at low pH can be explained by the breaking of the degeneracy of the πCOO* orbital that occurs upon protonation of the carboxylic group. This loss of degeneracy destabilizes the bonding πCdO orbital, resulting in a stabilization of the πCd O* system. Another test of this explanation can be realized by comparing the solid (zwitterionic) and vapor (neutral) spectra collected by Gordon et al.1 The 0.3 eV red shift observed in the vapor relative to the solid is in agreement with the incremental changes observed here. That the position of the C 1s f πCdO* transition can be affected by such a minor change in the electronegativity of the amine carbon is surprising and highlights the sensitivity of NEXAFS as a probe of chemical environment and electronic structure. The broad resonances observed in all three spectra are more difficult to assign. As evident in Figure 4, the transition density between 290 and 305 eV is quite large. Because no single transition in this region appears to dominate the spectrum, each of the broad resonances can be assigned as a transition to a variety of σ* and Rydberg states. The first feature around 290 eV appears to be consistently formed by transitions on the amine carbon, whereas the remaining features appear to have significant contribution from both the carboxyl and amine carbons. This interpretation is in agreement with that of Gordon et al.1
pH Dependence of Electronic Structure of Glycine
J. Phys. Chem. B, Vol. 109, No. 11, 2005 5379
Figure 4. Experimental C K-edge TEY spectra and corresponding calculated spectra for 0.6 M glycine as a function of pH. A. pH 1.11. B. pH 5.97. C. pH 11.86. From top to bottom, each graph includes the experimental spectrum and calculated spectrum (thick black), as well as the calculated amine carbon (C1) spectrum (thin gray), and calculated carboxylic carbon (C2) spectrum (thin black). The calculated spectra were created via a Gaussian convolution of the computed stick spectra, which have been included for reference under each curve. A precise spectral assignment (1s f π*CdO) is only possible for the sharp resonance observed near 289 eV, as the large spectral density between 290 and 305 eV creates a broad continuum over this energy range.
Figure 5. Nitrogen 1s NEXAFS spectra of glycine. A. Vapor signal measured by inner-shell electron energy loss spectroscopy (ISEELS) in the dipole regime.1 B. Aqueous (0.6 M) signal measured by total electron yield (TEY) NEXAFS. C. Thin solid film measured by scanning transmission X-ray microscopy (STXM) from Gordon.1
Ultimately, none of the spectral differences observed for the carbon K-edge are large enough to alter the interpretation of the measurements previously made on thin film samples.6 3.2. Nitrogen K-Edge. The nitrogen K-edge TEY NEXAFS spectrum of aqueous glycine at pH ) pI ) 5.97 (B) is compared to the solid scanning transmission microscopy (STXM) spectrum (C) and the gas-phase inner-shell electron energy-loss spectroscopy (ISEELS) spectrum (A) measured by Gordon et. al.1 in Figure 5. There is little qualitative difference between the solid
Figure 6. pH dependent TEY NEXAFS N K-edge spectra of 0.6 M glycine (aq). The solution pH was held at 11.86, 5.97, 1.11 for spectra A, B, and C, respectively. Each spectrum has been background subtracted and normalized to the excitation flux. Offsets have been included for clarity and to correct for energy calibration. No qualitative spectral differences are observed between the acidic (pH 1.11) and neutral (pH 5.97) solutions. There is a large (1.3 eV) energy shift in the main edge for the basic (pH 11.86) solution, as well as the appearance of two sharp preedge resonances at 405 and 406.3 eV. These sharp resonances have been assigned to the N 1s f σ* transitions.
and aqueous spectra, but both appear quite distinct from that of the vapor phase. The main resonance has been red shifted by 1.4 eV in the vapor compared to the bulk. Additionally, a sharp preedge resonance and a strong shoulder peak are observed at
5380 J. Phys. Chem. B, Vol. 109, No. 11, 2005
Messer et al.
Figure 7. TEY N K-edge spectra for 0.6 M glycine at A. pH ) 5.97 and B. pH ) 11.86. The experimental spectra (solid black) are compared to the calculated N K-edge spectra (solid gray) for zwitterionic and anionic hydrated glycine clusters, respectively. The calculated spectra were created via a Gaussian convolution of the calculated stick spectra (gray sticks), which have been included for reference under each curve.
401.3 and 402.5 eV, respectively. These resonances have previously been assigned to Rydberg transitions1 on the basis of the argument that they are not observed in the solid spectrum. Although it is generally believed that Rydberg transitions broaden into a continuum upon condensation,23,32 this is not the only possible explanation for the spectral differences observed. It is well known that isolated vapor phase amino acids are a strictly charge-neutral species, whereas crystalline amino acid samples occur in the form of zwitterions.2 Because of this, the amine terminus becomes protonated upon condensation, changing the local charge environment of the nitrogen atom from the pyramidal R-NH2 to the tetrahedral R-NH3+. This change in charge state is another possible cause of the spectral shift observed in Figure 5. This interpretation is strengthened by the pH dependence of the aqueous nitrogen K-edge spectra depicted in Figure 6. When compared to the spectra in Figure 5, the basic solution spectrum (A) of Figure 6 is virtually identical to that of the vapor phase. The appearance of a second preedge peak at 401.3 eV is made possible by the improved resolution of TEY NEXAFS (∼0.1 eV) compared to ISEELS (∼1 eV), for which instrument broadening blurs this resonance into the shoulder seen in the vapor spectrum in Figure 5. Meanwhile, both the neutral (B) and acidic (C) spectra are qualitatively identical to the condensed phase spectra of Figure 5. As all three aqueous spectra were taken at identical glycine concentrations, the degree of glycineglycine interaction should be identical for all three spectra. This supports the proposal that charge state is responsible for the spectral differences observed, rather than condensed phase broadening due to glycine-glycine interactions. To more thoroughly interpret the spectral changes observed in Figures 5 and 6, the computed nitrogen K-edge spectra of zwitterionic (A) and anionic (B) hydrated glycine clusters (glycine surrounded by seven water molecules) are depicted in
Figure 7. The TEY NEXAFS spectra of aqueous glycine at neutral and basic pH are included for comparison, as well as the stick spectra for both species. The two resonances responsible for the preedge features at 401.3 and 402.5 eV can be assigned to nitrogen 1s f σ* transitions. For the isolated glycine zwitterion (spectrum not shown), these resonances are both blue shifted upon protonation, and the resulting transitions are closer in energy to both each other and to the main 1s f σ* peak. Furthermore, in the hydrated zwitterion cluster, these three resonances are reduced in intensity and overlap to form a single peak at 406 eV. Previous studies of glycine monolayers adhered to metal substrates3,4 have found that the presence of a preedge resonance in the nitrogen K-edge is indicative of a free amine proton, and that the formation of hydrogen bonds to this moiety causes the preedge intensity to significantly decrease. The amine moiety of each glycine molecule forms a single hydrogen bond when a monolayer of the anion is formed on a metal surface. When the polarization of the excitation beam is aligned with the non-hydrogen bonding NH bond, the spectra exhibits a single preedge feature. The presence of two preedge resonances in Figure 7B suggest that the glycine amine moiety is in an acceptor-only configuration in high pH solutions. Although it is possible to arbitrarily force both amine protons to form donor hydrogen bonds with the surrounding solvent molecules, all of the energetic minima found for the hydrated anion clusters undergo a rearrangement such that the amine group rotates toward the negatively charge carboxylic acid terminus. In these conformations, the amine protons are stericly shielded from the solvent molecules, in agreement with the acceptor- only interpretation. Under neutral and acidic conditions, the nitrogen terminus is a positively charged ammonium moiety. For all calculated energetic minima, this moiety consistently forms several hydrogen bonds with the surrounding solvent molecules. From these observations, it appears that the position of the
pH Dependence of Electronic Structure of Glycine
Figure 8. Oxygen 1s NEXAFS spectra of glycine. A. Vapor signal measured by inner-shell electron energy loss spectroscopy (ISEELS) in the dipole regime.1 B. Aqueous (0.6 M) signal measured by total electron yield (TEY) NEXAFS. C. Thin solid film measured by scanning transmission X-ray microscopy (STXM).1
nitrogen main edge is dominated by the charge state of the glycine molecule, and presence or absence of any preedge features are controlled by the hydrogen bonding environment of the nitrogen terminus of the amino acid. 3.3. Oxygen K-Edge. The oxygen K-edge TEY NEXAFS spectrum of aqueous glycine at pH ) pI ) 5.97 (B) is compared to the solid scanning transmission microscopy (STXM) spectrum (C) and the gas-phase inner-shell electron energy-loss spectroscopy (ISEELS) spectrum (A) measured by Gordon et. al.1 in Figure 8. Because of the aqueous nature of the liquid sample, spectrum B is completely dominated by the oxygen K-edge spectrum of the water background. Only one additional small resonance is observed at 532 eV, which has been assigned to the oxygen 1s f π*CdO transition.1,5 The dominance of the water background makes comparison between spectra difficult for Figure 8, and the solid and vapor phase spectra are included primarily to demonstrate the reproducibility of the oxygen 1s f π*CdO transition. As this is the only resolvable transition for glycine in this energy range, we have chosen to focus on it to study the effect of pH on the oxygen K-edge spectrum. Figure 9 shows the oxygen 1s f π*CdO transition for basic, (A) neutral, (B) and acidic (C) glycine solutions. The width and position of this transition are identical for the basic and neutral solutions, whereas the acidic solution spectrum exhibits both a small (0.25 eV) red shift and a noticeable broadening. As previously discussed, the carboxyl terminus of glycine is protonated at low pH, lifting the degeneracy of the two CdO bonds and creating a C-O bond. In the gas-phase spectrum, the presence of a C-O bond leads to the appearance of a second peak at 535.3 eV, which is obscured by the strong background signal in the aqueous spectrum. Additionally, the red shift observed in the acidic spectrum is identical to that observed in the gas phase. Attempts were made at background subtraction to identify and characterize other resonances in the aqueous glycine spectra.
J. Phys. Chem. B, Vol. 109, No. 11, 2005 5381
Figure 9. TEY NEXAFS O K-edge spectra of 0.6 M glycine (aq) as a function of pH. The solution pH was held at 11.86, 5.97, 1.11 for spectra A, B, and C, respectively. Because of the strong water background, only the spectral region before the first background resonance is shown. Each spectrum has been background subtracted and normalized to the excitation flux. Offsets have been included for clarity and to correct for energy calibration. A small (0.25 eV) red shift is observed for the acidic (pH 1.11) solution, which has been illustrated by drawing a line through the center of each peak. This shift is caused by the protonation of the carboxylate subgroup at low pH, and the resultant breaking of the degeneracy in the O 1s f π*CdO transition.
Unfortunately, the addition of an amino acid, or a solute of any kind, perturbs the local water environment, further convoluting the oxygen K-edge of aqueous solutions.34 The resulting spectrum is therefore a convolution of the solute spectrum and the perturbed solvent spectrum, making a direct subtraction of the background solvent spectrum unreliable. Any assignments of the resulting difference spectra are completely dependent on the subtraction scheme used, and no meaningful assignments were possible. The more detailed analysis of this complex system represents an area for future investigation. 4. Summary The carbon, nitrogen, and oxygen K-edge spectra of aqueous glycine have been systematically examined as a function of pH. The insights provided by the pH dependence have led to a reassignment of the previously reported nitrogen K-edge spectrum of vapor phase glycine.1 All three edges were shown to exhibit a dependence on solution pH, with the most salient variations occurring at the nitrogen K-edge. We find that the solid phase nitrogen K-edge spectrum is nearly identical to the solution spectra recorded at low and moderate pH, whereas the basic solution species strongly resembles that of the gas phase. The addition of a water environment around the glycine species, and the resulting hydrogen bonds formed with that environment induce additional changes in the TEY NEXAFS spectra of the amino acid. Only minor changes are observed in the transitions to σ* and Rydberg states in the carbon K-edge and the
5382 J. Phys. Chem. B, Vol. 109, No. 11, 2005 experimentally accessible portion of the oxygen K-edge is unperturbed by hydration. More significantly, the presence of two preedge features in the nitrogen K-edge at high pH indicate that the amine terminus is in an acceptor-only configuration. It was not possible to meaningfully determine the concentration dependence of the glycine NEXAFS spectra. The biological concentration of amino acids varies widely, ranging from submicromolar to as much as 40% by mass in some subcellular structures.2 It would be interesting to use a more soluble amino acid, such as proline, to examine spectral changes that occur as a function of concentration. Acknowledgment. This research was supported by the Chemical Sciences, Geosciences and Biosciences Division, Office of Basic Energy Sciences, U.S. Department of Energy. C.D.C. is supported by the Department of Defense-National Defense Science and Engineering Graduate Fellowship. The Advanced Light Source is supported by the Director, Office of Science, Office of Basic Energy Sciences, Materials Sciences Division, of the U.S. Department of Energy under contract no. DE-AC03-76SF00098 at Lawrence Berkeley National Laboratory. We warmly thank the Advanced Light Source support staff, especially J. Denlinger, B.S. Rude, and D. Shuh for their advice and support. References and Notes (1) Gordon, M. L.; Cooper, G.; Morin, C.; Araki, T.; Turci, C. C.; Kaznatcheev, K.; Hitchcock, A. P. J. Phys. Chem. A 2003, 107, 6144. (2) Stryer, L. Biochemistry; W. H. Freeman and Co.: New York, 1975. (3) Hasselstro¨m, J.; Karis, O.; Weinelt, M.; Wassdahl, N.; Nilsson, A.; Nyberg, M.; Pettersson, L. G. M.; Samant, M. G.; Sto¨hr, J. Surf Sci. 1998, 407, 221. (4) Nyberg, M.; Hasselstro¨m, J.; Karis, O.; Wassdahl, N.; Weinelt, M.; Nilsson, A.; Pettersson, L. G. M. J. Chem. Phys. 2000, 112, 5420. (5) Zubavichus, Y.; Zharnikov, M.; Schaporenko, A.; Grunze, M. J. Electron Spectrosc. Relat. Phenom. 2004, 134, 25. (6) Kaznacheyev, K.; Osanna, A.; Jacobsen, C.; Plashkevych, O.; Vahtras, O.; Ågren, H.; Carravetta, V.; Hitchcock, A. P. J. Phys. Chem. A 2002, 106, 3153. (7) Tanaka, M.; Nakagawa, K.; Koketsu, T.; Agui, A.; Yokoya, A. J. Synchrotron Radiat. 2001, 8, 1009. (8) Boese, J.; Osanna, A.; Jacobsen, C.; Kirz, J. J. Electron Spectrosc. Relat. Phenom. 1997, 85, 9. (9) Cannington, P. H.; Ham, N. S. J. Electron Spectrosc. Relat. Phenom. 1983, 32, 139.
Messer et al. (10) Ricker, G.; Sandorfy, C.; Nascimento, M. A. C. J. Electron Spectrosc. Relat. Phenom. 1984, 34, 327. (11) Bomben, K. D.; Dev, S. B. Anal. Chem. 1988, 60, 1393. (12) Carravetta, V.; Plashkeych, O.; Ågren, H. J. Chem. Phys. 1998, 109, 1456. (13) Yang, L.; Plashkevych, O.; Vahtras, O.; Carravetta, V.; Ågren, H. J. Synchrotron Radiat. 1999, 6, 708. (14) Ripoll, D. R.; Vorobjev, Y. N.; Liwo, A.; Vila, J. A.; Scheraga, H. A. J. Mol. Biol. 1996, 264, 770. (15) Mun˜oz, V.; Serrano, L. J. Mol. Biol. 1995, 245, 297. (16) Nishino, H.; Kosaka, A.; Hembury, A.; Matsushima, K.; Inoue, Y. J. Chem. Soc., Perkin Trans. 2 2002, 582. (17) Lauterwein, J.; Gerothanassis, I. P.; Hunston, R. N.; Schumacher, M. J. Phys. Chem. 1991, 95, 3804. (18) Troganis, A. N.; Tsanaktsidis, C.; Gerothanassis, I. P. J. Magn. Reson. 2003, 164, 294. (19) Schweitzer-Stenner, R.; Eker, F.; Griebenow, K.; Cao, X.; Nafie, L. A. J. Am. Chem. Soc. 2004, 126, 2768. (20) Ozdemir, A.; Lednev, I. K.; Asher, S. A. Biochemistry 2002, 41, 1893. (21) Barron, L. D.; Gargano, A. R.; Polavarapu, P. L.; Hecht, L. Spectrochim. Acta 1991, 47A, 1001. (22) Navarrete, J. T. L.; Casado, J.; Herna´ndez, V.; Ramirez, F. J. J. Raman Spectrosc. 1997, 28, 501. (23) Sto¨hr, J. NEXAFS Spectroscopy; Springer-Verlag: Berlin, 1992. (24) Faubel, M.; Schlemmer, S.; Toennies, J. P. Z. Phys. D 1988, 10, 269. (25) Wilson, K. R.; Rude, B. S.; Catalano, T.; Schaller, R. D.; Tobin, J. G.; Co, D. T.; Saykally, R. J. J. Phys. Chem. B 2001, 105, 3346. (26) Wilson, K. R.; Cavalleri, M.; Rude, B. S.; Schaller, R. D.; Nilsson, A.; Pettersson, L. G. M.; Goldman, N.; Catalano, T.; Bozek, J. D.; Saykally, R. J. J. Phys: Condens. Matter 2002, 14, L221. (27) Wilson, K. R.; Rude, B. S.; Smith, J.; Cappa, C. D.; Co, D. T.; Schaller, R. D.; Larsson, M.; Catalano, T.; Saykally, R. J. ReV. Sci. Instrum. 2004, 75, 725. (28) Hermann, K.; Pettersson, L. G. M.; Casida, M. E.; Daul, C.; Goursot, A.; Koester, A.; Proynov, E.; St-Amant, A.; Salahub, D. R.; Carravetta, V.; Duarte, H.; Godbout, N.; Guan, J.; Jamorski, C.; Leboeuf, M.; Malkin, V.; Malkina, O.; Nyberg, M.; Pedocchi, L.; Sim, F.; Triguero, L.; Vela, A. StoBe-deMon, version 1.0; StoBe Software, 2002. (29) Perdew, J. P.; Burke, K.; Ernzerhof, M. PRL 1996, 77, 3865. (30) Hammer, B.; Hansen, L. B.; Nøskov, J. K. Phys. ReV. B 1999, 59, 7413. (31) Huzinaga J. Chem. Phys. 1965, 42, 1293. (32) Steinberger, I. T.; Teodorescu, C. M.; Gravel, D.; Flesch, R.; Wasserman, B.; Reinhardt, G.; Hutchings, C. W.; Hitchcock, A. P.; Ru¨hl, E. Phys. ReV. B 1999, 60, 3995. (33) Urquhart, S. G.; Ade, H. J. Phys. Chem. B 2002, 106, 8531. (34) Hura, G.; Sorenson, J. M.; Glaeser, R. M.; Head-Gordon, T. H. Perspect. Drug DiscoVery 1999, 17, 97.