Performance Evaluation of IEEE 802.11e based on ON-OFF Traffic Model I. Papapanagiotou
J.S. Vardakas
G.S. Paschos
PhD. Student Wireless Telecommunication Laboratory
PhD. Student Wire Communications Laboratory
Researcher
University of Patras
265 04 Patras, Greece
265 04 Patras, Greece
[email protected]
University of Patras
[email protected]
M.D. Logothetis
VTT, Digitalo Po Box 1000, 02044 VTT, Finland
[email protected]
S.A. Kotsopoulos
Associate Professor Wire Communications Laboratory
Professor Wireless Telecommunication Laboratory
University of Patras
University of Patras
265 04 Patras, Greece
265 04 Patras, Greece
[email protected]
[email protected]
ABSTRACT We investigate the performance of the IEEE 802.11e while emphasizing on the end-to-end delay performance. In our MAC delay analysis, we are based on elementary conditional probabilities, avoiding the complex Markov Chains method. For a thoroughly study of the MAC delay, we take the Ztransform of the backoff duration in order to provide higher moments of the MAC delay distribution. The first moment corresponds to the mean MAC delay, while the second moment to the Standard Deviation of the MAC delay, which depicts the jitter. We also estimate the Probability Mass Function (PMF) of the MAC delay through the Lattice Poisson Algorithm. For the queuing delay, we consider a queue for each Access Category (AC) with one common server and an input process which is described by an ON-OFF model depicting the bursty nature of traffic. The service time follows the MAC delay distribution. Analyzing this queue, we provide results both for saturated and non-saturated channel condition. The end-to-end delay is estimated by the sum of queuing and MAC delay. The analytical results are validated through simulation.
Keywords IEEE 802.11e, QoS, MAC delay, queuing delay, end-to-end delay.
1. INTRODUCTION Nowadays, WLANs have become very popular and meet a broad range of applications, based on the main protocol standard for Wireless Local Area Communications, IEEE 802.11 [1], which has turned out to be a major factor of growth in the network industry. Due to heterogeneous applications in the Internet, with diverse end-to-end delay requirements, the IEEE has certified a newer IEEE 802.11 version, the IEEE 802.11e for providing QoS (Quality of Service) [2]. In the IEEE 802.11e, a Hydrid Coordination Function (HCF) is introduced to control the
medium access. Two different access methods are defined based on whether the medium access is centrally or distributed controlled. The central MAC procedure is called HCCA (HCF Controlled Channel Access), while the distributed is called EDCA (Enhanced Distributed Channel Access). The performance analysis of these standards is widely spread in the research community not only for the legacy 802.11 [3], [4] but also for the 802.11e [5],[6]. Most of the analyses tend to provide analytical results based on mean values and saturation conditions of the channel, by formulating large Markov Chains. Some few works exist which provide analysis for non-saturation conditions by studying the queues of the stations [7]. In this paper we analyzed both the MAC and the queuing delay for the IEEE 802.11e. Starting with the MAC delay, the proposed performance analysis is avant-garde due to the fact, that we do not use complex solutions of Markov Chains, but we base the analysis on elementary conditional probabilities [8], [9] which are defined for each Access Category (AC) separately. Moreover, in order to thoroughly study the MAC delay we do not provide only mean values, but we take the Z-transform of the backoff duration in order to provide higher moments of the MAC delay distribution. The use of the Z-transform is done due to the fact, that the standard [2] is based on time slots rather than continuous time. More precisely, from the first and second derivatives of the Ztransform of the backoff duration, the mean and the Standard Deviation (SD) of the MAC delay is provided, respectively. It is readily seen that the Variance depicts the jitter that a multimedia application faces in the MAC layer. Afterwards, we aim at estimating the Probability Mass Function (PMF) of the MAC delay. To this end we need the inverse transform of the Z-transform of the backoff duration [10]. This is achieved approximately, through the Lattice Poisson Algorithm [11]. The PMF of the MAC delay depicts the exact performance of the Backoff Exponential Algorithm of IEEE 802.11 in correlation with the QoS features of the IEEE 802.11e.
To analyze the queuing delay, we consider a queue for each AC, with one common server, and an input process that is described by an ON-OFF model. The choice for such an input was made in order to express the bursty character of multimedia traffic. As far as the service-time is concerned, it follows the MAC delay distribution with mean value, the mean MAC delay. With the aid of this queue, we can provide results both for saturated and nonsaturated channel condition, as a unified model. It is readily seen that when λ/μ<1 the model is transformed to a non-saturation analysis and when λ/μ to a saturation analysis. Having determined the queuing delay the total mean end-to-end delay is estimated by the sum of mean queuing and mean MAC delay. The rest of the paper is organized in the following way: Section 2 provides a brief overview of EDCA access method. Section 3 presents the proposed Performance Analysis of the IEEE 802.11e both in terms of throughput and delay (with emphasis to the latter). Section 4 validates the accuracy of the analytical results through simulations made by Opnet Modeler 12 [11]. Finally, concluding remarks are given in Section 5.
2. OVERVIEW OF EDCA The IEEE 802.11e has been certified as a QoS extension of the IEEE 802.11. In the following paper we investigate the case of the Enhanced Distributed Coordination Access (EDCA) mechanism, in which there is not any central coordinator, and the network is in ad-hoc mode. The QoS provisioning is done via the use of four Access Categories, its one having different EDCA parameters; Arbitration Inter Frame Space (AIFS), Contention Window (CW) and Transmission Opportunity (TxOP) limits. In our case TxOP is not studied explicitly. In 802.11e standard if there is a packet ready to be transmitted, EDCA must sense the channel idle and complete an AIFS interval prior to starting the transmission. In order to determine a differentiation of access probabilities between ACs the AIFS[i] interval has different values for each Access Category i (ACi), where 0 ≤ i ≤ 3 . Similarly to the legacy of 802.11, CW[i] stands for the backoff delay that the packet encounters. In 802.11e the CWmin[i] and CWmax[i] values are differently set so as to have lower probability of delay in delay-prone ACi’s, for example those that serve VoIP/Video. In EDCA each ACi is functions its backoff counter independently from the other ACi’s of the same station, but its access probability has a correlation. An internal collision handler is run by granting access to the ACi with the highest priority. All these are analysed in detail in [8] and [10].
3. Performance Analysis of the IEEE 802.11e In the following we suppose ni stations in each ACi separately, trying to contend for the channel access. The channel is considered perfect and there are not any hidden node problems.
3.1 Transmission Probability The performance analysis is verified by supposing simple probabilities than difficult solution of Markov Chains. We can envision the Binary Exponential Backoff (BEB) Algorithm as a function of two coordinates (x,y), where xi ∈ [0, mi ] represents the backoff stage (mi is the ACi’s retry count), and yi ∈ 0, CWx, i − 1 represents the value of the backoff counter at
[
]
the backoff stage xi. In order for an ACi to be in a specific xi = f position a number of collisions have happened in the previous xi = f − j where j ∈ [0, f − 1] and xi ≥ f . Thus the event that the station is in position xi is given by the geometric series, which is the number of collision in a geometric progression:
Pi (x ) =
(1 − pi ) pi x
(1)
1 − pi m i +1
The probability that a station transmits while being in the backoff stage x is obtained from the mean value of the uniform distribution that each y is chosen, plus a time slot that it is needed to leave the specific y coordinate and go to another y of a different x or transmit. Pi ( y ) =
1 1 + E [BD ]i , y
(2)
where E [BD ]x is the average value of the backoff counter at stage x. In order to find the transmission probability, the above equations should be divided and summed over a region of xi ∈ [0, mi ] :
τi =
1 m
∑ x =0
(3)
Pi (x ) Pi ( y )
3.2 Accurate MAC Delay Distribution To find the accurate MAC delay distribution we need to know the mean value, the variance and the Probability Mass Function (PMF). The first two can be easily found from the first and second moments of the discrete Z-transform of the Backoff Duration, since the BEB Algorithm is slotted, whereas the third one can be found by the Lattice-Poisson algorithm. The interruption of the backoff period of the tagged station can occur by two different events and is analyzed as follows. The first one is the collision of two or more ACi’s and the second is the transmission of a single ACi other than the tagged one. In both of them we take into account. The probability, of a slot of the tagged station to be interrupted from the transmission of any other station (one or more), is given by:
(
pi = 1 − 1 − (1 − π i ,0 )τ i
)n −1∏ (1 − τ i )n i
i
(4)
z >i
where π i ,0 is the probability that the ACi’s queue is empty. The case where π i ,0 = 0 refers to saturated conditions of the channel, whereas in any other case with 0 < π i ,0 < 1 refers to non-saturated conditions. The probability pi that the tag station is interrupted by the transmission of a single station (one exactly) is given by:
⎛ n − 1⎞ pi ' = ⎜⎜ i ⎟⎟ ⋅τ i ⋅ 1 − (1 − π i ,0 )τ i ⎝ 1 ⎠
(
)n − 2 ∏ (1 − τ i )n i
(5)
i
BDi (Z ) = (1 − pi ) ⋅ S i (Z ) ⋅
z >i
m
⎡
i
i
x
x =0 ⎣
+ ( pi ⋅ Ci (Z ))mi +1 ⋅
Moreover the probability that the channel is busy is defined as
mi
∏D
f ,i
⎤
x
∑ ⎢⎢( p ⋅ C (Z )) ⋅ ∏ D f =0
f .i
(Z )⎥⎥ +
(13)
⎦
(z )
f =0
pb = 1 − (1 − τ i )ni
(6)
The probabilities that the slot is interrupted by a successful transmission or a collision of another station/s are respectively given by:
P(successful transmission | slot is interrupted ) = p′s ,i = p − pi′ P(collision AC | slot is interrupted ) = pc′ , i = i pi
pi′ pi
(7)
Ci (Z ) = Z
T s ,i
The mean value E[Mi] and the variance Var[Mi] of the MAC delay can be derived by taking the derivative of (18), with respect to Z: E[ M i ] = BDi′ ( Z ) Z =1
(14)
(8)
(
Var 2 ( M i ) = BDi′′( Z ) Z =1 + BDi′ ( Z ) Z =1 − BDi′ ( Z ) Z =1
According to [8] there is a probability that the station will definitely transmit another packet, after a successful transmission. This occurs when in the second transmission chooses a backoff value equals to zero. Hence the Z-transform of the transmission period and the collision period are respectively given by: S i (Z ) = Z
The first term of the second part of (18) signifies the transmission delay multiplied by the delay encountered in the previous x and y stages, whereas the second term is the delay of the dropping packet, which has encountered in all x collisions.
(9)
)2
(15)
where the prime indicates the derivative. In order to calculate the PGF (Probability Generating Function) of the MAC delay, the Z-transform of the delay can also be expressed as: ∞
BDi ( Z ) =
∑d
i, k Z
k
(16)
k =0
Tc ,i
(10)
The values of Ts,i and Tc,i can be found from [5]. In order to decrement the backoff process, the channel must not be interrupted and multiplied by the respective time of the idle slot, whereas the probability to stay at the same state is the sum of two multiplications where the station stays at the same state. Thus the Probability Generating Function (PGF) of each state is given by:
(1 − pi )⋅ Z Dx, y , i (Z ) = 1 − pi ⋅ ( p ′s , i S i (Z ) + pc′ , i Ci (Z ))
The goal is to calculate d i , k , which expresses the PMF of the backoff duration of each ACi. A method that gives the inverse Ztransform with a predefined error bound is the Lattice-Poisson Algorithm [11], which is valid for d i , k ≤ 1 . However in the situation of BDi(Z), d i , k is a PMF and thus validates the above method. Thus, the PMF is:
d i, k =
σ
(11)
1 2kr k
∑ (− 1) Re(BD (re π )) 2k
h
i
j h/k
(17)
h =1
where Re(BDi(Z)) stands for the real part of the complex BDi(Z).
However, the backoff duration is not doubled after mi times, and stays at the same value for the remaining backoff stages:
Eq. (17) is derived by integration of BDi(Z) over a circle with radius r, where 0
⎧CWx −1 D x , y ,i (Z ) , ⎪⎪ D x,i (Z ) = ⎨ CW x,i y =0 ⎪ ⎪⎩ Dm′,i (Z ),
∑
10 −γ we let r = 10 −γ / 2 k [11]. 0 ≤ x ≤ mi′ mi′ < x ≤ mi
Thus, for each x the backoff duration is given by:
(12)
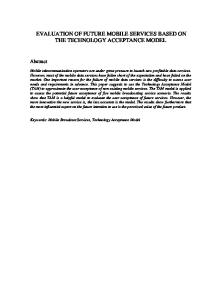
3.3 Queuing Delay – End-to-End Delay The average end-to-end packet delay can be calculated as the sum of the mean MAC delay E[Mi] and the queuing delay E[Qi]. Such a sum is possible due to the linear characteristics of the mean values. We consider that each ACi is a discrete-time queuing system, with the wireless channel as the single server and infinite duffer capacity. In order to describe the arrival procedure, we consider a two-state Markov chain; the arrivals are modeled by an ON-OFF source, shown in Fig.1. The parameters qi,1 and qi,2 are the probabilities that the Markov chain remains in states
ON and OFF respectively. Calls arrive in the queue for each time slot when the system is in state ON; the arrival rate is denoted λi. Every transition of the queue is done in a time slot, as defined in the MAC layer. The probability of two consecutive arrivals is denoted by f i ,1 = qi,1 , where fi,n is the inter-arrival time distribution. Similarly, following an arrival, the probability that the system is in state OFF and jumps to the state ON is f i, 2 = 1 − qi,1 1 − qi ,2 .
(
)(
)
Subsequently, the general expression of the inter-arrival distribution is ([13]): ⎧⎪ qi ,1 f i, n = ⎨ n−2 ⎪⎩ 1 − qi ,1 qi ,2 1 − qi , 2
(
)
(
n =1
)
n >1
(18)
E[ S i ]
λi
=
1
E [Di ] = E [M i ] + E [Qi ]
(27)
3.4 Throughput Analysis In order to find the throughput of our analysis the following formula is defined PS , i E[ L]
Si =
(28)
3
P ∑ ι
S , iTS , i
+ Pc, iTc, i
=0
Where the transmission probability is
2
z 1 − qi , 2 z
(19)
(26)
μ i (1 − ρ i )
Finally, the average end-to-end packet delay E[Di] is given by:
Pidleσ +
The probability generating function (PGF) is given by ([13]): Fi ( z ) = qi ,1 z + (1 − qi ,1 )(1 − qi , 2 )
E[Qi ] =
PS , i = N i ⋅τ i ⋅ (1 − τ i ) ni −1 ⋅
∏ (1 − τ
k)
(29)
k ≠i
and the mean inter-arrival time can be calculated as: dFi ( z ) dz
=
2 − qi ,1 − qi ,2 1 − qi , 2
z =1
=
1
λi
The probability that the channel is idle is defined as (20)
m=0 ⎧ 1 − ξi m -1 ρ ρ ξ (1 ) m ≥1 i i ⎩ i
∏ (1 − τ ) i
ni
(30)
i
The stationary queue size distribution π i, m is in the form ([13]):
π i, m = ⎨
Pidle =
(21)
Similarly the collision probability is defined as the inverse probability of the sum of the idle and successful probabilities. Additionally E[L] is the mean packet length which is equal to 1024 bytes in our case in order to be lower from the TxOP and fragmentation threshold [2]. The rest are equally defined from [5].
where ξi is a constant and ρi is the unique root of the equation: z = Fi ( μ i z + (1 - μ i ))
(22)
where μi is the mean service time of the queue of the ACi and equals to the mean MAC delay. Solving equation (21) we find that:
ρi =
⎤ 1 − μi ⎡ 1 − 1⎥ ⎢ μ i ⎣ μi (1 − q1 − q2 ) + q2 ⎦
(23)
Following [13], by equating the mean probability of the arrival to the mean probability of departure we find that
λi = μ i (1 − π i ,0 ) ⇔ π i,0 = 1 −
λi μi
(24)
By using Little’s theorem and (20) we calculate the mean queue size and the mean waiting time, which are respectively given by: ∞
E[ S i ] =
∑ lπ l =1
i,l
=
ξi
1 − ρi
=
λi μ i (1 − ρ i )
(25)
Figure 1: State transition diagram of the ON-OFF arrival process.
4. EVALUATION The analytical results are defined both under saturation and nonsaturation conditions of the channel. In order to validate the mathematical results, Opnet Modeler 12, was used which implements the exact model of the IEEE 802.11e. The simulation parameters, included error free channel, a packet generator with mean packet length of 1024 bytes, and basic bit rate (1Mbps). Nodes are equally distributed to every class. In the following results are provided for the two upper classes, named as AC0 and AC1. The other two classes are omitted due to the unimportance of their role. Background and Best Effort traffic which are serviced by these two lower classes are neither delay or prone, nor require specific throughput.
In Fig.2 throughput results are provided for saturation conditions of channel and for both access mechanisms (Basic and RTS/CTS). Simulation results are similar to the analytical ones which prove the accuracy of our analysis. Moreover it is readily seen that the throughput performance of the network is higher when RTS/CTS type of traffic is used, regarding both ACs In Fig.3 the End-To-End to delay of the Backoff Exponential Algorithm is given, as the sum of the mean values of MAC delay and Queuing delay. It is easily proven that such as a summation is possible; although as metrics they are correlated, due to linearity nature of the mean value operator. In order to find the mean value the first derivative of the Z-transform of the MAC delay is taken, as shown in formula (14). Similarly we show in Fig.4 that the variance of the MAC delay, as second derivative of the Z-transform is provided, which depicts the jitter nature of the MAC delay. Such a metric is useful in order to prove that possible queues or admission control is possible to the IEEE 802.11e so as to overcome such an effect.
Figure 3: Mean End-To-End delay as the sum of the Mean MAC (first derivative of Z-transform) and Queuing Delay
In Fig. 5 the End-To-End delay is shown but for non-saturation condition of the channel and for basic access method for both upper classes. For this reason we have used variable traffic intensity with also variable number of nodes of each class. Thus the 3D graphical representation gives a view of the performance of the End-To-End delay. From the figures the End-To-End delay seems to be linear to both traffic intensity and Number of Nodes. Moreover the increase in higher loads, for variable number of stations, is much higher over that when there is small traffic load, especially for AC1. In Fig.6 the End-To-End is calculated for RTS/CTS access method. Except for the much smaller values of delay, the variation between saturation and non-saturation seems to be very small, thus producing lower jitter, when ON-OFF traffic is produced with high probability of transitions.
Figure 4: Variance of the MAC delay as a second derivative of Z-transform for both access mechanisms
Overall the performance of the standard under RTS/CTS, although increases the load of the network, but serves the packets much faster and with lower values of delay and jitter. It is very interesting to note the variability of the delay when moving from non-saturation to saturation conditions. Such transitions can easily be solved with RTS/CTS access method, makes easier the access to the channel from the MAC layer.
Figure 5: End-To-End Delay for variable traffic intensity ρ for AC0, AC1 and Basic Access Method
Figure 2: Throughput for both access mechanisms compared to simulation results.
Figure 6: End-To-End Delay for variable traffic intensity ρ for AC0, AC1 and RTS/CTS Access Method
Table 1. EDCA parameters AC3
AC2
AC1
AC0
Application
VoIP
Video
Best-Effort
Backround
CWmin
7
15
31
31
CWmax
15
31
1023
1023
AIFS
SIFS+2
SIFS+2
SIFS+3
SIFS+7
5. CONCLUSION The performance of the IEEE 802.11e MAC layer is extensively investigated regarding the analysis of the delay. We have used elementary conditional probabilities in order to calculate the Mean MAC delay, Jitter, End-to-End delay and PGF (and PMF) of the MAC delay of each AC. From the analysis the correlation among ACs seems to affect the total delay. There is a great part of information being depicted by the PGF of the delay regarding the general performance of the Backoff Exponential Algorithm with discrete applications. All these are combined with an ON-OFF queue (ON/OFF traffic model is widely used model for voice and telnet traffic) representing closely the variability of the multimedia applications. Our analysis is validated by simulation results through Opnet Modeler. In fact some key points are left for future work regarding finite queue length and separate types of queues in each AC.
6. ACKNOWLEDGMENTS The authors would like to thank Professor Dimitris Toumpakaris for his valuable help in the calculation of the Z-transform. Work supported by the research program PENED-2003, Greek
Ministry of Development (GSRT).
[3] Bianchi G., Performance Analysis of the IEEE 802.11 Distributed Coordination Function, IEEE Journal on Selected Areas in Communications, vol.18, No.3, (2000), 535-547. [4] Foh C. H. and Tantra J. W., Comments on IEEE 802.11 Saturation Throughput Analysis with Freezing of Backoff Counters, IEEE Communications Letters, Vol. 9, No. 2, (Feb. 2005), pp.130-132,. [5] Y. Xiao "Performance Analysis of the 802.11e EDCF under Saturation Condition", in Proc. Of IEEE ICC 2004, Paris, France, 2004. [6] J. Hui and M. Devetsikiotis, "A Unified Model for the Performance Analysis of IEEE 802.11e EDCA", IEEE Transactions on Communications, Vol. 53, No.9, September 2005. [7] Engelstad P.E. and Osterbo O.N., The Delay Distribution of IEEE 802.11e EDCA and 802.11 DCF, In Proc. of the 25th IEEE IPCCC 2006, Phoenix, Arizona, USA on April 10 – 12, 2006. [8] Bianchi G. and Tinnirello I., Remarks on IEEE 802.11 DCF Performance Analysis, IEEE Communications Letters, Vol. 9, No. 8,(Aug. 2005),765-768. [9] J.S. Vardakas, I. Papapanagiotou, M.D. Logothetis and S.A. Kotsopoulos, “End-to-End Delay Analysis of the IEEE 802.11 Distributed Coordination Function”, ICIMP 2007, Silicon Valley, USA on July 1-6, 2007. [10] A. G. Ramm, “Inverse Problems – mathematical and analytical techniques with applications to engineering”, Springer, Boston, USA, 2005. [11] Abbate J. and Whitt W., Numerical inversion of probability generating functions, Operations Research Letters 12, Oct. 1992, 245-251. [12] www.opnet.com
7. REFERENCES [1] IEEE 802.11 WG. International standard for information technology-local and metropolitan area networks, part 11: Wireless LAN MAC and PHY specifications, 1999 [2] IEEE 802.11e WG Medium Access Control (MAC) Enhancements for Quality of Service (QoS), 802.11e D.13 (Final), July 2005
[13] I. Elhanany, and D. Sadot, "Performance analysis of a robust scheduling algorithm for scalable input-queued switches", in Proc. Of IEEE ICC 2003, Anchorage, Alaska, USA on May 11-15, 2003.