PERCEPTUAL DECISIONS IN CHANGING CONDITIONS
576.3
David THURA, Julie BEAUREGARD-RACINE & Paul CISEK Département de physiologie, Université de Montréal, Montréal (PQ), CANADA
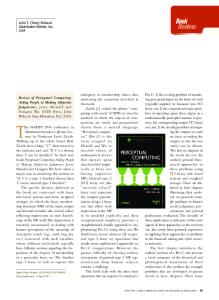
xi (t ) = g ⋅ Ei ⋅ t
Stimulus
xi (t ) = g ⋅ Ei (t ) ⋅ u (t ) < T
E
D
decision
‘’Urgency-gating’’ model
u
Urgency
Success probability
Behavioral task and data analysis N C ! min( N C , 7− N L ) 1 ∑ 2 NC k!( N C − k )! k =0
Bias-against
1
0.5
0
Success probability
Target reached
Decision time 0
500
1000 time
Success probability
Bias-for-Amb. Bias-for
Bias-against
Bias-against-Amb.
1
1
1
0.5
0.5
0.5
0
0
0 # Step
# Step
2
3
# Step
To test specific hypothesis about decision-making dynamics, we interspersed among fully random trials (random assignment to either rightward or leftward dots motion for each step) some specific classes of trials. In easy trials, dots tended to move consistently toward one of the targets, quickly driving the success probability pi(t) for each toward either 0 or 1. In ambiguous trials, the initial dots movements were more balanced, keeping the pi(t) function close to 0.5 until late in the trial. In bias-for trials, the dots moved to the correct target during the first three steps, the next three toward the opposite target, and the remaining ones resembled an easy trial. Bias-against trials were identical to bias-for ones except the first six steps were reversed. For bias-for-ambiguous and bias-against-ambiguous classes, trials were identical to « bias-for » and « bias-against » ones, respectively, except the last 9 steps resembled an ambiguous trial.
Activity (Hz)
% cumulative
% of trials
Time
A
0.6 0.5 0.5
4
0.6
0.7 0.8 0.9 Mean SP [Easy]
1
100
Easy
80
-248ms
B
Ambiguous
C 0.8
-162ms
60 40
Bias-against
20
ns
10 Subject JBR 0
0
40 20 0
1000 2000 3000 Decision time (ms)
0.2
0.4
0.6
0.8
1
1
3 2 1
population (n = 30) 1 2 3 Mean DTs (s) [Bias-For]
0
0.9
A
PMd activity in bias-for vs bias-against trials. A. Top panel: Success probability during two kinds of trials in which the same level of probability is reached after 5 token movements, but in one group (blue, N=9), evidence for the PT is high early on while in the other group (red, N=6) it initially favors the OT. Only cases in which the monkey waited at least 1200ms before deciding are analyzed. Bottom panel: Activity of a PMd neuron during these two trial types. The activity profiles are clearly different during the early part of the trials (from 800-1000 ms). However, during the epoch of critical interest (100200 ms after the 5th token movement, shaded region), neural activity is the same in the two trial groups.
1 0.8 0.6 0.4
0.8
0.2
0.7 0.6 0.5 0.5
4
Bias-for-amb.
Bias-against -amb.
1 0.5 0
Predictions. For identical reasons as above, integrator models suggest that neural activity accumulated in the early part of the trial will bias performance of subjects making decisions during the ambiguous part of the trials. Thus, these models predict better performance in bias-for-amb trials than in bias-against-amb trials (red ellipse). In contrast, the urgency-gating model does not predict a significant difference (green ellipse). This is because no bias due to the early part of the trial should affect the way the subjects make their decisions in the ambiguous period.
0.6 0.7 0.8 0.9 Mean SP [B-For]
1
150 100 50
Urgency
60 40
Integrator
20
n
T E (t d ) = g ⋅ td
0
20 40 60 80 100 % Correct choices [B-For Amb.]
Performance in bias-for-amb vs bias-against-amb trials. Only subjects who have performed the « no time limit » version of the task are included (n=16). Here, we compare the performance (percentage of correct choice, black diamonds) for each subject in the bias-for-amb trials (abscissa) versus the bias-against-amb (ordinate) trials. In contradiction with the integrator models, there was no tendency for subject’s performance to be higher in the bias-for-amb trials compared to the bias-against-amb ones.
20 0
S
400
800 1200 1600
Time wrt Start (ms)
B
120 100 80 60 40 20 0
200
600 1000 Time (ms)
B. The urgency-gating model also predicts that the gain between success probability and neural firing will grow over time. In this plot, each dot (N=146) represents the neural activity versus time taken from a 200ms epoch during which success probability was between 0.6 and 0.7. Data is restricted to epochs prior to the monkey’s correct decision to move to the cell’s PT. The thick line shows that the mean+SE of activity in each time-bin is rising on average. This shows that even while success probability is around the same value, neural activity tends to increase with time.
ER ( n) = ∑ log k =1
SUMMARY & CONCLUSIONS
p (ek | R) p (ek | L)
Confidence level should decrease as a function of decision time Time limit
Stimulus discrimination period
No time limit
Tradeoff between speed and accuracy > 200ms
threshold
2
τ
< ~200ms
The central concept of many recent models of decision-making proposes that simple decisions involve the temporal integration of sequential sensory samples until a threshold is reached. Our results however are more consistent with “urgency-gating” than with temporal integration of sensory samples and suggest a simple mechanism for implementing trade-offs between the speed and accuracy of decisions.
1.5 1 0.5 0 -0.5 -1
0
40
What is the subjective estimate of evidence?
Relation between time of decision and subject confidence
2.5
80
S 400 800 1200 Time wrt Start of tokens (ms)
What else does the urgency-gating model predict?
# Step 100
60
Integrator vs Urgency mechanisms in the dorsal premotor cortex 0
Success probability
4
0
ns
60
D -1000 -500 Time wrt Decision (ms)
PMd activity reflects decision process before the monkey commits to its decision and is specific to trial types. A. Activity of a PMd neuron during easy trials in which the monkey correctly chose the cell’s preferred target (PT, blue, N=37) or the opposite target (OT, red, N=38). B. Activity of the same neuron during ambiguous trials in the cell’s PT (blue, N=9) and OT (red, N=16). C. Top panel: Success probability profile (mean+SE) calculated for the PT during easy (blue, N=37) and misleading trials (red, N=9). Bottom panel: Neural activity, aligned on first token movement, during those same trials in which the monkey correctly chose the recorded cell’s PT. Note how the firing patterns observed in these different trial classes reflect features of the profile of success probability until the time of the decision.
80
0.4
80 D -1000 -500 Time wrt Decision (ms)
100
30
0.6
0.2
0
Special trial types Amb.
0
1500ms
The dots task. Each trial begins when a random dot kinematogram appears in the center of the workspace and two target circles to its left and its right. Initially, the 200 dots move purely randomly. Next, after 200ms, six of the dots all begin to move coherently to the left or the right and then, every 200ms (step) another 6 of the randomly moving dots get assigned to either left or right until 90 dots (15 steps) have become assigned to either rightward or leftward motion. The task for the subject is to choose the target which corresponds to the direction of motion in which he/she predicts the dots will be moving at the end of the trial. Subjects are allowed to make their choice at any time. Once a target is chosen, the interval between steps of coherence changes from 200ms to 20ms, and feedback about success or failure is provided once a total of 90 dots are moving coherently. Fourteen subjects performed the “time limit” version of the task, in which they had to make their decisions before the end of the 15th and last step (3000ms). Sixteen performed the “no time limit” version in which they had a 5s extra time (thus a total of 8s) to make their decisions. The design of the task allowed us to calculate, at each moment in time, the success probability pi(t) associated with choosing each target i. We detected the time of movement onset and subtracted each subject’s mean RT (from a choice reaction time task), to estimate the « decision time ». We then use the equation above to compute the success probability at the time of the decision. Most of our analyses focus on these two variables.
Easy
1
0.7
Bias-for
RT
% Correct choices [B-Against Amb.]
0
Predictions. Integrator and urgency-gating models make clear distinct predictions about the timing of decisions in bias-for versus bias-against trials. Because integrator models retain a “memory,” they suggest that, after 1200 ms of dots movement, neural activity related to the correct target will be higher in bias-for trials than in bias-against trials, and therefore closer to threshold. Therefore, these models predict faster decision times in bias-for trials than bias-against trials. In contrast, the urgencygating model does not predict a significant difference because after the 6th step of dots movement the current evidence E(t) is the same in both kinds of trials.
Decision times and success probabilities in bias-for vs bias-against trials. Here, we only focus on those trials in which decisions were made after the 6th step of dots movement. Top-left panel: Distribution of decisions time for one subject in bias-for (blue, n=82) and bias-against (red, n=47). The mean decision time in bias-for trials was not significantly different from bias-against trials (1715 vs 1810 ms, p > 0.05). Bottom-left panel: Average decision times for all subjects. There was no significant difference between decision times in the bias-for and bias-against trials for 24 of 30 subjects. Bottom-right panel: the success probability at decision time also was similar in the two kinds of trials for most of subjects (27/30), both in the « time limit » and in the « no time limit » version of the task. An example for one subject is illustrated on top-right panel.
Success probability
time
Probability of correct choice
# Step
Movement onset
Population (n = 30)
0.8
0
The urgency-gating model predicts subjects’ behavior better than integrator models Bias-for
0.5
1
0.9
PMd activity reaches a threshold at decision time. Activity of a PMd neuron, aligned on decision time, during all choices (correct and error trials) made toward the cell’s preferred target (PT) during easy (blue, N=37), ambiguous (red, N=10) and other trials (green, N=66). Markers indicate the first token movement (square), decision time (diamond), and movement onset (triangle). In all three kinds of trials activity hits a peak of about 65 spikes/sec around the estimated decision time, then begins to decrease prior to movement onset.
20
METHODS
1
The “tokens” task. The monkey begins each trial by placing the cursor within the central circle. Next, the tokens begin to move from the center to one of the two targets. The monkey makes a choice by moving the cursor. The remaining tokens move more quickly to the targets and feedback is given to the subject. See Cisek et al., 2009 for more details.
Mean DTs (s) [Easy]
Data from constant-information tasks can thus be explained by an alternative model, in which neural activity is the product of current stimulus information and a growing signal related to the urgency for making a choice (urgency-gating). Recently, we endeavored to distinguish the models by presenting human subjects with a task (the tokens task) in which the information favoring one choice over another changed during each trial. Results showed that subject’s behavior is better explained by an urgency mechanism (Cisek et al., 2009). Here, we investigate whether similar conclusions hold for tasks in which the stimuli are noisy and in which there is no explicit cue of elapsing time.
p( R | N R , N L , N C ) =
2
D -1000 -500 Time wrt Decision (ms)
1
1
3
0
0.2 0.4 0.6 0.8 Success probability
Stimulus Onset
Sensory evidence
0 0
4
Decision times and success probabilities in easy vs ambiguous trials. Top-left panel: Distribution of decision times for one representative subject in easy (blue, n = 82) and ambiguous (red, n=40) trials. The mean decision time was shorter in easy trials than in ambiguous ones (1216 vs 1886 ms, KS test, p < 0.001). Bottom-left panel: Average decision times for each subject during the « time limit » (black) and « no time limit » (red) version of the task. The solid pluses indicate the mean and SE for subjects for whom the difference was significant and the dotted pluses represent subjects for whom difference was not significant. 28 of 30 subjects made decisions significantly later in ambiguous than in easy trials. Top-right panel: Cumulative distribution of success probability at the time of the decision during easy (blue) and ambiguous (red) trials for the same subject. The mean in the easy trials (0.87) was higher than in the ambiguous ones (0.65). Bottom-right panel: Average success probabilities for all subjects (same format as on the bottom-left panel).
40
Activity (Hz)
0
xi (t ) = g ∫ Ei dτ = g ⋅ Ei ∫ dτ
Other
20
20
1000 2000 3000 Decision time (ms)
Amb.
60
0 0
Easy
Activity (Hz)
0
# Step
40
Activity (Hz)
t
0
p<0.001
Probability
t
0
10
60
Activity (Hz)
Ei (τ ) = Ei
p<0.001
Mean SP [Amb.]
However, in most of the studies supporting integrator models, the information presented to subjects varied across trials but was constant during the course of each trial. In such conditions one cannot distinguish whether the buildup observed in neural activity (and inferred from behavioral data) is caused by temporal integration of sensory information or by a growing signal related to elapsed time.
0.5
80
% cumulative
decision
100
80
Mean SP [B-Against]
D
100
Ambiguous
Subject PFP
Mean DTs (s) [Amb.]
∫
E
1
Predictions. Both integrator and urgency-gating models predict faster decisions at a higher lever of success probability in the easy trials than in the ambiguous ones. Integrator model suggests subjects make the decision when the integral of evidence reaches some threshold. Therefore, the decision is taken at a lower level of probability in ambiguous trials because x(t) has already accumulated earlier in the trial and is closer to the threshold. Alternatively, the temporal gating model predicts that when enough time has elapsed, the t term will push x(t) over the threshold even if the evidence is low (dropping accuracy threshold).
Evidence through SumLogLR
Sensory evidence
0
Ambiguous
% of trials
t
xi (t ) = g ∫ Ei (τ )dτ < T
Easy
Easy 20
Mean DTs (s) [B-Against]
‘’Integrator’’ models
Specific pattern of dot movements affects subjects’ behavior
Success probability
Stimulus
Temporal dynamics of decisions in monkey PMd Pilot data
RESULTS
Probability
INTRODUCTION Research into the temporal aspects of decision making has provided support for a class of theories called “bounded integrator” models (e.g. Smith and Ratcliff, 2004). According to such models, while a subject observes a stimulus, task-relevant variables are encoded in early sensory areas. These variables, which are continuously updated as the stimulus changes and new evidence becomes available, are fed to integrators. The integrators sum up the available evidence over time. When the summed evidence in favor of any one choice exceeds a threshold, the subject stops gathering information and settles on that choice.
E n
+ ∑ log k =1
p(ei | R) p(ei | L )
u 0
1000 2000 Decision time (ms)
3000
0
1000 2000 Decision time (ms)
3000
Decision time effect on confidence level. The two figures above illustrate, for each subject, the analysis of SumLogLR at decision time for decisions made at different times both in the « time limit » (left panel) and in the « no time limit » version of the task. To do so, we grouped all trials according to the number of steps that occurred before decision time and calculated the value of E(t) for the selected target at that time. In accord with the urgency-gating model prediction, we found a significant regression (black solid lines) for 10 of 14 subjects in the « time limit » version of the task. Note however that we found only 4 significant regressions among the 13 negative slopes observed for subjects who did the « no time limit » version of the task.
D xi (t ) = g ⋅ Ei (t ) ⋅ u(t ) < T
Stimulus-independent, motor urgency signal
REFERENCES
The present study prompts us to reconsider two aspects of these models. First, we propose that evidence for a given choice should not be computed by temporally integrating the information currently present in the stimulus. Instead, it should involve either summation of only new information (provided by a change in the state of the stimulus) or be a low pass-filtered signal related to the state of the sensory information. This is consistent with studies suggesting that the time window of integration for perceptual decision-making is on the order of 100 ms (Ludwig et al., 2005; Ghose, 2006). Second, we suggest that the long buildup of neural activity in constant-evidence tasks is not caused by an integration process but is primarily attributable to a growing urgency signal that is unrelated to any particular choice. Finally, it is likely that evidence quality (i.e. noise) and time pressure conditions affect the way subjects use “integrators” and/or “urgency” to form a decision
• Cisek P, Puskas GA, El-Murr S (2009) Decisions in changing conditions: the urgency-gating model. J Neurosci 29:11560-11571. • Ghose GM (2006) Strategies optimize the detection of motion transients. J Vis 6:429-440. • Ludwig CJ, Gilchrist ID, McSorley E, Baddeley RJ (2005) The temporal impulse response underlying saccades decisions. J Neurosci 25:9907-9912. • Smith PL, Ratcliff R (2004) Psychology and neurobiology of simple decisions. Trends Neurosci 27:161-168.