The Economic Contribution of Cultural Activities. The Icelandic Example Agust EINARSSON, Professor, Faculty of Economics and Business Administration University of Iceland, Oddi, Sudurgata, 101 Reykjavik, Iceland Tel: 354-5254500. Fax: 354-5526806. E-mail:
[email protected] Abstract The aim of the paper is to analyze the economic role of cultural activities in a small society, with Iceland as the prime example, demonstrate the importance of SMEs within the sector of cultural activities, describe the contribution of cultural activities to GDP, discuss the impact of globalization and compare public expenditures on cultural activities at the international level. UNESCO has defined culture for the purpose of international economic statistics. There are numerous enterprises within the cultural sector, most of them SMEs. The role of entrepreneurship is extremely important in cultural activities in most societies. Public expenditures on cultural activities have increased substantially in Iceland, both in nominal terms and as a proportion of GDP. Local government spends more than central government on cultural activities, and public expenditures on cultural affairs are very high compared to other functions. Cultural activities are an important factor in most economies, and in the case of Iceland their contribution to GDP amounts to about 3.7%, which is considerable in comparison with other industries. Culture can be regarded as public good, i.e. non-rival in consumption and accessible to all, as in the case of cultural heritage. Culture can be considered as a positive externality because increased cultural activities result in a more diverse and productive society. Culture represents a significant value for each individual, and it is therefore important to ensure the greatest possible access for everyone in all communities, even though this raises the problem of free-riders. Cultural activities have to reach a large majority of the population of a country and meet the needs of present generations without jeopardizing the needs of future generations. This is the principle of sustainability, which is here adapted to the concept of global public goods. Cultural activities fit very well within this concept, because people are, now more than ever, trying to preserve cultural diversity, and globalization is often seen as a threat to this ideal, particularly for smaller nations. Comparison of data from 16 OECD countries in the paper illustrates that Iceland spends more than other countries on cultural activities, even when only central government expenditures are taken into account.
Key words Cultural expenditures, globalization, Icelandic culture, public goods. JEL H41, H50, Z10, Z11 1
1. Introduction
This paper describes, in Section 2, the economic role of cultural activities in Iceland, and the contribution of cultural activities to gross domestic product (GDP). Following a brief clarification of globalization of cultural activities, in Section 3, we compare the central government expenditures for cultural activities in various countries, in Section 4. Culture, defined as any human behavior or activity passed from one generation to the next, which describes, creates, preserves or transmits emotions or surroundings of human society, consisting of languages, beliefs, ideas, customs, arts, sports, or other related aspects, is the subject of cultural economics (Frey 2000, Held et al. 1999, Bendixen 1998, and Peacock 1994). Culture can be regarded similarly as a positive externality, because increased cultural activities result in a more diverse society and offer more possibilities for a happier life (Sable & Kling 2000). Public initiatives in support of cultural activities for the purpose of increasing positive externalities are often very effective (Kaul et al. 1999). Externalities are especially important in connection with public goods, which in contrast with private goods are non-excludable and non-rivalrous. The traditional model of supply and demand for private goods in a free market, with the appropriate price mechanisms, is often irrelevant in describing public goods. It is recognized within the social sciences that goods and culture have a relationship of complex interdependence. Goods are a material aspect of culture and make the categories of culture visible (Howes 1996). Generally speaking, culture can be regarded as a public good, as in the case of cultural heritage. It is not possible to maintain, however, that every aspect of culture falls under the heading of pure public goods, because many aspects are in fact private goods, for instance concerts and art exhibitions in the case of fine arts. In such an event, this cultural activity or cultural element is excludable but not rival. In that case they are impure public goods (Serageldin 1999). One of the problems of attaching a price tag to culture is that its value is not always immediately apparent, and the value may change from one generation to the next. There is also the problem of classification: the difference between culture and education. In economic statistics, the 2
entire school system, including art schools and various institutions purely dedicated to the practice of culture, is classified under the heading of education rather than cultural activities. UNESCO has defined culture for the purpose of international economic statistics (Haydon 2000), dividing the concept into nine categories: cultural heritage, printed matter and literature, music, performing arts, audio media, audiovisual media, social activities, sports/games and environment/nature.
2. Contribution of Cultural Activities to GDP in Iceland
Iceland, which is the example of the small society in this paper, is 103,000 square km in area, with a population of 280,000. Iceland is an independent country in the North Atlantic and the distance from the capital, Reykjavik, to the mainland of Europe is about 2.000 km. The country achieved independence from Denmark in 1944 and enjoys a very high standard of living. In 2001, Iceland’s GDP in PPP in US $ per head was 30,400, which put the country in the 6th place in the world in this category (OECD in Figures 2002). Iceland is one of the Nordic countries and cooperates closely and extensively with the other Nordic countries, Denmark, Finland, Norway and Sweden. In 2000, fish products accounted for 63% of the export of goods and 40% of foreign currency income. Unemployment in Iceland is low, or 1.3% in 2000, and inflation in the same year was 5%. Iceland is a member of the UN, NATO and the EEA (European Economic Area) but is not a member of the EU, which sets Iceland apart from most of the other countries of Western Europe. Iceland is taking an active part in the work of the UN, including UNESCO. The contribution of cultural activities to GDP in Iceland’s economy in 1999 is shown in table 1 (Yearly Reports 2002). The classification is very close to that of UNESCO.
3
1999 Printing and publishing
1.53%
Radio and television
0.62%
Sports
0.24%
Religious affairs
0.24%
Motion pictures
0.16%
Artists, theatre and orchestras
0.89%
Total
3.68%
Table 1: Percentage of the contribution of cultural activities to GDP in Iceland 1999
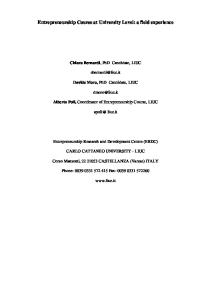
The percentage of cultural activities to GDP was 3.68% in 1999. Printing and publishing has the biggest share, followed by theatre, orchestras and other activities of artists. The creation of artistic works constitutes primary production, but their contribution increases many times through exhibitions, printing etc. over a period of many years, decades or even centuries after their original production. The number of books published in the Nordic countries per 1.000 inhabitants is by far the highest in Iceland, at more than double, and theatre visits and museums visits per capita are highest in Iceland. The Internet is an important medium for distribution of culture. The Internet connection in Iceland was the second highest in the world in 1998 after Finland (Media and Culture 1999). Fig. 1 shows the contribution to GDP of several important industries in Iceland in 1999 (Statistical Yearbook of Iceland 2002).
4
Fig. 1: The percentage distribution of GDP by some industries 1999 in Iceland Construction
8,4
Transport and communication
8,3
Fishing
6,9
Electricity and water supply
4,8
Fish processing
4,6
Cultural activities
3,7
Agriculture
1,9 0
1
2
3
4
5
6
7
8
9
10
The percentage of GDP (%)
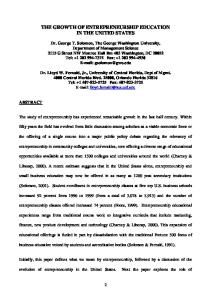
The contribution of cultural activities to GDP is higher than one might expect. Culture contributes more to GDP (3.7%) than agriculture (1.9%) and not much less than fish processing (4.6%). The seven industries shown in Fig.1 contribute 38.6% to GDP of Iceland. Most of the enterprises in cultural activities are small and medium sized enterprises (SMEs). Of cultural enterprises, 94% have 1-5 employees, 4% have 5-20 employees and 2% have more than 20 employees. In fact, most enterprises in Iceland are small or medium sized. Enterprises with fewer than 20 employees are defined as SMEs in Iceland. The operations of artists are very often conducted in very small units or organizations. Some big companies, but quite many small enterprises, characterize the printing and publishing sector as well as radio and television. The cultural sector attracts entrepreneurs, and new enterprises in culture are very common in Iceland Fig. 2 shows the expenditures of the general government, i.e. central government and local government, to culture in Iceland from 1980 to 2000 at 2000 market prices, and the share of these expenditures in total expenditures and in GDP (Public Finances 1997-1998, 1999 and Statistical Yearbook of Iceland 2002).
5
2000
1999
1998
1997
1996
1995
1994
1993
1992
1991
1990
1989
1988
1987
1986
1985
1984
1983
1982
1981
18 17 16 15 14 13 12 11 10 9 8 7 6 5 4 3 2 1 0
1980
% and billion krónur
Fig. 2: Contribution of general government to cultural activities 1980 to 2000 in Iceland
Cultural expenditures in billion krónur at 2000 market prices Cultural expenditures as percentage of general government total expenditures Cultural expenditures as percentage of GDP
Fig. 2 shows that general government expenditures on culture have increased greatly from 1980 to 2000. Expenditures increased from 5 billion krónur to 17 billion krónur at 2000 market prices. The percentage of total expenditures to cultural activities rose from 4.1% in 1980 to 6% in 2000. The share of GDP increased from 1.4% in 1980 to 2.7% in 2000. The expenditures of local government are higher than the expenditures of central government. About 60% of expenditures to cultural activities are through local government and about 40% derive from central government. Fig. 3 shows the expenditures of the general government in Iceland, 2000, classified by sector.
6
Fig. 3: General government expenditures classified by function 2000 in Iceland 51.016
Health Education
39.654 20.226
Communication Cultural affairs
17.526
Justice
9.668
Agriculture
9.237 6.207
Housing, planning and sanitary affairs Fisheries
2.526 0
10.000
20.000
30.000
40.000
50.000
60.000
Million of krónur
The sectors shown in Fig. 3 represent 57% of total general government expenditures in Iceland in 2000. Public cultural spending is one third of health expenditures, almost half of the expenditures on education and almost equal to spending on communication.
3. The Globalization of Cultural Activities
The globalization of culture is a flow, which is characterized at each time by its intensity or volume. Literature, music, art, law and philosophy all cross the world, and the systems that enable their distribution are institutional and frequently, although by no means invariably, in public ownership. The aim of public goods is to improve societies, surroundings and living standards. Public authorities, usually democratically elected authorities, normally supply public goods. This production of goods and services by public authorities results in positive externalities, which improves the lives of the general public. Culture fits very well into this classification. Market failure occurs when the free market is not succeeding in ensuring a good or optimal utilization of the production factors. When this happens, public authorities can help the market to achieve the desired results. Public goods can be good, as in the case of culture, or bad, as in the case of pollution, and the global 7
countenance of both is increasing. The diversity of enterprises in the field of culture is also described in the institutional economics (Richter & Furubotn 1999, Stanfield 1999, and Jackson 1996). Globalization is changing much, but there is also much that is changing in the environment irrespective of globalization. The world population is now about six billion and is projected at eight billion in twenty five years, as compared to 1.3 billion in the year 1900. The inequality in the division of income among the inhabitants of the world is staggering: of the six billion people in the world, 1.2 billion survive on less than one dollar a day and in 1999, ten million children died from preventable diseases (World Bank 2001). In 2000 the gross national income (GNI) in purchasing power parity (PPP) per capita in the world was $7,410. In low-income countries (40% of the world’s population) the GNI in PPP per capita was $1,980, but for high-income countries (15% of the world’s population) it was $27.770 (World Bank 2002). Of course, culture, as a collection of trends, and as a trend in itself, is being influenced by this situation. It is important to see not only the advantages of globalization, such as bigger markets, lower transaction costs, increased and faster dissemination of knowledge, greater opportunities and a greater sense of identity, which contributes to peace (Einarsson 2002). Not everyone agrees that these advantages in fact exist, and instead highlight various risks and limitations entailed by globalization. There are social and natural limits to resources, while economic development, especially the financial sector, has no limits (Altvater 1996). From this viewpoint, it is possible to discern various difficulties, for instance that countries with limited democratic traditions of government could prevail in the international competition for the location of companies, and globalization could entail risks for the environment. Culture represents a significant value for each individual, and it is important to ensure the greatest possible access for everyone in all communities, even though this raises the obvious problem of free-riders: otherwise, culture will take the form of private goods and, in fact, effectively, create a natural monopoly because only the select few, a sort of elite club, would have access to cultural activities. Considerations of equality are important regarding access to cultural activities. Global public goods, such as cultural activities, have to reach a large majority of the population of a country 8
and reach more than one group of nations (Kaul et al. 1999). It is also required that global public goods meet the needs of present generations without jeopardizing the needs of future generations. This is the principle of sustainability, which is here adapted to the concept of global public goods. Cultural activities fit very well within this concept, because people are, especially today, trying to preserve cultural diversity, and globalization is often seen as a threat to this ideal. This relationship can be seen in fig. 1 in part a, b, and c (Kapur 2002).
a) More people b) Private goods
Public goods
More countries
Private goods
Public goods
Few people c)
Few countries
More generations
Public goods
Private goods
Single generation
Fig. 4: Global public goods
Culture should be in the upper-right quadrant of in parts a), b) and c) in Fig. 4 following the definition of global public goods. For international organizations and domestic governments working in the field of culture, this presentation requires emphasis on securing the greatest possible access to 9
culture whether at the national level or the global level. Public goods in the global context, therefore, are subject to stringent and diverse demands regarding variety: national, ethnic and generational. Nevertheless, the question of who should take care of the supply and for whom and who should place this on the agenda is a political issue. This is the traditional task of economics: to describe who produces what for whom. Cultural activities fit very well into this framework.
4. International Comparison
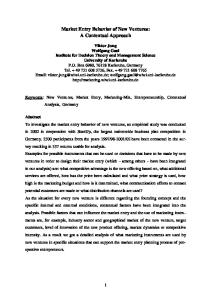
Fig. 5 shows the expenditures of the general government to cultural activities for 16 OECD countries including recreational and religious affairs (Government Finance Statistics Yearbook 2001) and Main Economic Indicators (2001). Figures were not available for the same year for all countries. The years that the figures represent are shown in brackets in fig. 5 following the name of the country.
10
Fig. 5: Percentage of expenditures of central government to cultural acticities in 16 OECD countries 4,1
Iceland (1998)
2,06
Denmark (2000)
1,5
Canada (2000)
1,25
Greece (1998)
1,2
Norw ay (1998)
1,04
Finland (1998) New Zealand (2000)
0,98
Australia (1998)
0,97 0,73
Sw eden (1999)
0,68
Ireland (1997) United States (2000)
0,54
Spain (1997)
0,53 0,43
Sw itzerland (1999)
0,34
Netherlands (1997)
0,29
United Kingdom (1999)
0,14
Japan (1993)
0
0,5
1
1,5
2
2,5
3
3,5
4
4,5
Percentage of central government expenditures
Fig. 5 shows Iceland at the top with 4.1% of central government expenditures allocated to cultural activities in 1998. There are huge differences between countries as regards central government expenditures. Many countries spend substantial amounts on national defense, but Iceland has no armed forces. Of the 16 countries in Fig. 5, apart from Iceland, expenditures on national defense range from 15% of central government expenditures in the USA down to 3% in Ireland. In many countries, including Iceland, central government expenditures do not accurately reflect general government spending because there are many kinds and levels of local government, e.g. states in the US, Länder in Germany, etc., with independent tax revenues and independent finances. The participation of local government in cultural activities is substantial, as shown earlier in the case of Iceland, where the share of the local government was larger than that of the central government. Other differences also make international comparison of this kind difficult; religious affairs, e.g., are in some countries financed by various private contributions, as a supplement to 11
regular government financing. Total public expenditures differ greatly between countries. Current general government expenditures as a percentage of GDP for the 16 countries in Fig. 5 range from 26.4% in Ireland in 2000 up to 52.2% in Sweden (OECD in Figures 2002). The percentage for Iceland is 35% and Iceland ranks 11th of these 16 countries, far below average. Cultural affairs are increasingly being examined in a global context, i.e. as a means of ensuring cultural diversity, national image and diversity in the face of increased globalization (World Culture Report 2000, 2002). An interesting approach within Global Cultural Economics is to examine the impact of entrepreneurs as self-employed individuals in communities which are not based on materialism alone, i.e. examining post-materialism versus level of entrepreneurship. The principal idea here is to connect cultural aspects, which are not characterized by economic views, with economic innovation. This relates to Global Cultural Economics as well, because the number of entrepreneurs and the scope of their activities have increased substantially through the increased trade brought about by globalization (Uhlander et al. 2002). There is no single thing that constitutes global culture, no more than we could venture to define what any national culture is. If the Icelandic culture is taken as an example, we could touch on certain features, such as the Icelandic sagas, the fisheries and camping festivals on bank holidays, but it is impossible to list all the details forming a culture. Global culture is simply a result of the fact that through increased globalization the culture of individual nations and ethnic groups is more influenced by other cultures than before. Multinational influence of this kind is nothing new either; it has frequently been seen in history before – what is new is that the influence now is global, i.e. it comes from the world as a whole. It can be disputed whether all cultures have the same opportunity to make their influence felt. Small areas often do not have the financial capacity to propagate their influence. This issue falls within the domain of Global Cultural Economics and the research question is whether small cultural areas are at risk owing to increased globalization, not only because their societies are recipients rather than producers, but also simply because they are small; the core of the issue is whether cultural diversity is in danger.
12
Increased public expenditures on cultural affairs in the last 20 years in Iceland show great emphasis on cultural activities. This is demonstrated by the fact that the percentage of general government total expenditures has increased by 50% in these 20 years. The priority of a sector can be described in terms of the amount of public expenditures allocated to that sector. For countries with a relatively low population it is important to stress cultural affairs. We propose the hypothesis that governments of countries with small populations spend more on cultural affairs than countries with large populations. The hypothesis of no connection was tested for the 16 countries in fig. 5, which are all part of the developed world with a high income per capita. Population and percentage of central governments expenditures are ranked for the 16 countries. The Spearman’s coefficient of the rank correlation R is 0,57. This is significant at the 5 percent level. We conclude that countries with small populations spend more on cultural affairs than countries with large populations. The emphasis of smaller nations on cultural activities is understandable because they are fighting for their cultural heritage in a world characterized by increasing globalization. Iceland is a good example of this.
5. Conclusion and discussion
Cultural activities are an important factor in the Icelandic economy. Their economic impact is often underestimated in economic statistics. The influence of culture in increasing the well-being of people is often not measured, perhaps not even measurable, in monetary terms, but is nevertheless of great effect. The value of a society is to a large extent underpinned by the depth of its cultural roots. Public authorities can successfully support cultural activities on the basis of their positive externalities and their economic impact. Activities designed to increase the share of cultural activities within an economy lead to economic growth and higher living standards. Increased cultural activities can be achieved by strengthening the school system in the field of culture, especially fine arts. This has a twofold effect. First, it increases the knowledge of culture among the people and, second, it expands the interest of young people, who will later participate actively as professionals in cultural activities. The school 13
system is often aimed at securing equality as regards the art and artistic work of young people with different economic backgrounds (Financing, Resources and the Economics of Culture in Sustainable Development 1999). In some countries, public authorities have supported programs either by direct subsidies or through the tax system, e.g. by allowing tax reductions to enterprises which support cultural activities (Einarsson 2001). The contribution of cultural activities to GDP is about 3.7% in Iceland, which is considerable in comparison with other industries. There are numerous enterprises within the cultural sector, most of them small and medium sized enterprises (SMEs). Public expenditures on cultural activities have increased substantially in Iceland, both in nominal terms and as a share of GDP. Local government spends more than central government on cultural activities, and public expenditures cultural affairs are very high compared to other functions. Globalization offers new opportunities for cultural activities. Icelanders spend more than other countries on cultural activities, even when only central government expenditures are taken into account. It is shown that governments of countries with small populations spend more on cultural affairs than countries with larger populations.
References
Altvater E. (1996). Grenzen der Globalisierung: Ökonomie, Ökologie und Politik in der Weltgesellschaft. Westfälishes Dampfboot, Münster.
Appadurai, A. (1996). Modernity at Large: Cultural Dimensions of Globalization. University of Minnesota Press, Minneapolis.
Bendixen P. (1998). Einführung in die Kultur- und Kunstökonomie. Westdeutscher Verlag, Opladen.
14
Brookshire D.S. & Coursey D.L. (1987). “Measuring the Value of a Public Good: An Empirical Comparison of Elicitation Procedures.” The American Economic Review 77(4): 554-566.
Cultural Policies in Europe .A Compendium of Basic Facts and Trends (2001). Council of Europe, Strasbourg. Located at http://www.culturalpolicies.net/.
Douglas M. & Isherwood B. (1979). The World of Goods: Towards Anthropology of Consumption. Norton, New York.
Eggertsson T. (1990). Economic Behavior and Institutions. Cambridge University Press, Cambridge.
Einarsson A (2002). Global Cultural Economics. Presented at a conference on globalization 18th-19th Oct. 2002 at University of Iceland. Reykjavik
Einarsson A. (2001). “The Economic Importance of Culture (Icelandic)”. Journal of Mal and Menning 62(3): 43-50.
Financing, Resources and the Economics of Culture in Sustainable Development (1999). Background paper for the Conference “Measuring Culture and Development: Prospects and Limits of Constructing Cultural Indicators” organized by the World Bank and the government of Italy in cooperation with UNESCO in Florence, 4-7 October. UNESCO, Paris
Frey B.S. (2000). Arts and Economics. Springer-Verlag, Berlin.
Getzner M. (2002). “Determinants of Public Cultural Expenditures: An Exploratory Time Series Analysis for Austria”. Journal of Cultural Economics 26(4): 287-306.
15
Government Finance Statistics Yearbook (2001), Vol. XXV 2001. International Monetary Fund, Washington.
Haydon B. (2000). “Cultural Statistics within a Developed Statistical System (Australia and Canada).” in World Culture Report. Highlights. Part Five. Methodology: Building Cultural Indicators. UNESCO, Paris.
Held D., McGrew A., Goldblatt D. & Perator J. (1999). Global Transformations. Politics, Economics and Culture. Polity Press, Cambridge.
Howes D. (1996). Introduction. Commodities and Cultural Borders. In Howes D. (Ed.). CrossCultural Consumption. Global Markets. Local realities. Routledge, London.
Jackson W.A. (1996). “Cultural Materialism and Institutional Economics”. Review of Social Economy 54: 221-244.
Johnes G. (1993). The Economics of Education. MacMillan Press, London.
Kapur D. (2002). “The Common Pool Dilemma of Global Public Goods: Lessons from the World Bank’s Net Income and Reserves.” World Development 30 (3): 337-354.
Kaul I., Grunberg I. & Stern M.A. (Eds.) (1999). Global Public Goods. International Cooperation in the 21st Century. Oxford University Press, London.
Main Economic Indicators (2001). OECD, March, Paris.
16
McPhie P. (2000). “Canada’s National Culture Statistics Program: a Quarter Century of Development” in World Culture Report 2000, UNESCO, Paris.
Media and Culture (1999). Statistics Iceland. Reykjavik.
OECD in Figures (2002). OECD, Paris.
Peacock A. & I. Rizzo (Eds.) (1994). Cultural Economics and Cultural Policies. Kluwer Academice Publishers, Dordrecht.
Public Finances 1997–1998 (1999). National Economic Institute, Reykjavik.
Rengers M. & Plug E. (2001). “Private or Public? How Dutch Visual Artists Choose between Working for the Market and the Government”. Journal of Cultural Economics 25(1): 1-20.
Richer R. & Furubotn E.G. (1999). Neue Institutionenökonomik (2nd edn.). Mohr Siebeck, Tübingen.
Rushton M. (2000). “Public Funding of Controversial Art”. Journal of Cultural Economics 24(4): 267-282.
Sable K.A. & Kling R.W. (2001) “The Double Public Good: A Conceptual Framework for “Shared Experience” Values Associated with Heritage Conservation”. Journal of Cultural Economics 25(2): 77-89.
Serageldin I. (1999). Cultural Heritage as Public Good: Economic Analysis Applied to Historic Cities. In Kaul I., Grunberg I. & Stern M.A. (Eds.). Global Public Goods. International Cooperation in the 21st Century. Oxford University Press, New York. 17
Stanfield J.R. (1999). “The Scope, Method and Significance of Original Institutional Economics”. Journal of Economic Issues 33(2): 231-255.
Statistical Yearbook of Iceland (2002). Statistics Iceland, Reykjavik.
Steenkamp J-B. (2001). “The role of national culture in international marketing research.” International Marketing Review 18 (1): 30-44.
Throsby D. (1994). “The Production and Consumption of the Arts: A View of Cultural Economics.” Journal of Economic Literature 32(1): 1-29.
Uhlaner L., Thurik R. & Hutjes J. (2002). Post-Materialism: a Cultural Factor Influencing Entrepreneurial Activity across Nations. Presented at the 47th World Conference of International Council for Small Business. San Juan, Puerto Rico.
World Bank (2001). World Development Indicators 2001. World Bank, Washington.
World Bank (2002). World Development Indicators 2002. World Bank, Washington. Located at http://www.worldbank.org/data/wdi2002/tables/table1-1.pdf
World Culture Report 2000 (2002). UNESCO, Paris.
Yearly Reports (2002) Statistics Iceland, Reykjavik.
18