The Dynamics of Party Reputation: Sources and Consequences
Jeremy C. Pope Dept. of Political Science Brigham Young University
Jonathan Woon Dept. of Social and Decision Sciences Carnegie Mellon University
December 27, 2006
1
1
Prepared for presentation at the 2007 conference of the Southern Political Science Association. A previous version was presented at the 2006 annual meeting of the American Political Science Association. We thank the CMU-Pitt Political Economy Reading Group for helpful comments and suggestions on an earlier draft.
1
Scholars of both political behavior and institutions have recognized the importance of parties as an intermediary between citizens and elites when citizens are incompletely informed about political affairs. Behavioral research has taught us that citizens often rely on what they know about parties to make inferences about candidates, a view first articulated by the authors of the American Voter (Campbell et al. 1960) and supported by later research (Conover and Feldman 1989, Rahn 1993). Institutional theories of parties emphasize the value of a collective reputation or “brand name” as a reason for the existence of parties (Downs 1957, Aldrich 1995, Snyder and Ting 2001) and for institutional structures that favor the majority party in government (Cox and McCubbins 1993, 2005). We place parties at the center of the democratic process and investigate questions about both the sources and consequences of changes in party reputations. Regarding sources, if party members are heterogeneous and occupy different institutions of government, on which institution does the public base its evaluation of the party, Congress or the presidency? Regarding consequences, if party identification is a function of beliefs about the parties, then are changes in party reputations completely mediated by voter partisanship or do they have independent effects? Our work makes several important contributions. We are the first to construct a measure of relative party reputations over time and can therefore analyze aggregate public opinion about parties as a concept that is distinct from either the balance of partisans (i.e. macropartisanship) or presidential approval. In our analysis of the institutional sources of party reputations, we show that the president is an important source and therefore scholars of congressional parties ignore the president at their peril. Finally, we show that changes in relative party reputations may directly affect electoral outcomes but that there is a complicated and reciprocal relationship with macropartisanship. The paper proceeds as follows. In Section 1, we define party reputation and develop hypotheses about institutional sources and electoral consequences. Section 2 describes our aggregate time series measure of relative party reputations. In Sections 3 and 4 we present our empirical analyses, and Section 5 concludes.
2
1. Party Reputations
Citizens do not always pay attention to the details of politics. In the electoral arena, many relevant details are necessary to make a fully informed vote choice. Such details may include the characteristics, positions, and accomplishments of elected politicians as well as the other candidates for public office. A significant degree of ignorance is rational for ordinary citizens because the sheer quantity of unknown information can be overwhelming. Any efforts to acquire such information are typically outweighed by the attractiveness of many alternative uses of one’s time. Although there are many politicians, there are only two major American parties, and while candidates may come and go, parties endure. These facts about the political environment suggest that evaluating parties is a cost effective alternative to evaluating candidates. An important function—if not a goal—of parties is therefore the production of a collective reputation or “brand name” (Downs 1957). As with individual candidates and politicians, there are a number of details about the parties that may be relevant for a citizen to make a perfectly informed choice: the ideological orientation of party elites, the policies advocated by elected members, the level of agreement within the party, and the competence of partisans to implement policy effectively. These details multiply with each relevant political issue and, we believe, are simply too much for any citizen to remember. In the end, however, once a citizen chooses to vote, the basic decision comes down to choosing one party’s candidate or platform over the other party’s offered alternative. Just as the use of party reputations may be more cost effective than learning and storing facts about candidates, it would be more cost effective—cognitively speaking—for citizens to update and store their summary of relative evaluations of the parties rather than learning, recalling, and comparing many specific differences between the parties. We therefore define a party’s reputation as the beliefs that citizens hold about the net benefits provided by the party when it controls the government. This definition requires some unpacking along several fronts. First, we emphasize that we use the term “net benefits” in a very general sense: it may include direct and indirect economic benefits as well as the citizens’ subjective assessments of the desirability of policy.
3
Second, the definition includes the condition that the party controls the government. We realize that in the context of separation of powers, no party will have absolute control given the possibility of divided government and Senate supermajority requirements, but it nevertheless serves as a basis for evaluation. More importantly, our conception of reputation involves subjective beliefs about net benefits. Voters—at least in the two-party context—face a choice between two alternatives, so ultimately it is the difference between the parties that they must be concerned about. The difference in party reputations is essentially the “expected party differential,” a fundamental component in models of party choice (e.g. Downs 1957, Key 1966, Fiorina 1981). Since the information environment is not static but rather dynamic, changes in beliefs should be driven by new information citizens receive about the parties’ abilities to provide political and economic benefits (Achen 1992, Gerber and Green 1998). For parties to serve as a meaningful link between government and elections through their reputations, changes in party reputation must respond to changes in beliefs and information about parties in government, and changes in reputation, in turn, must affect electoral outcomes. We now turn to developing questions and hypotheses about the sources and consequences of changes in party reputation.
Information, Heterogeneity, and Institutional Sources of Reputation
Our hypotheses about reputation change can be tied together by a key assumption that parties, government, and the public are all characterized by heterogeneity. Parties are not necessarily unified, homogenous, centrally-controlled organizations because they consist of individual politicians pursuing their own interests and ambitions (Mayhew 1974; Aldrich 1995). To the extent that members of the party do not speak as one voice, citizens undoubtedly receive conflicting messages from different party members in ways that make updating evaluations of the party difficult. Heterogeneity within parties is exacerbated by heterogeneity in government—that is, by constitutional design, the separation of powers means that elected members are distributed across different institutions and levels of government.
4
Despite this heterogeneity, the president clearly stands out as the most visible party member, as he is widely viewed as the leader of the national party. The heterogeneity of parties combined with the prominent role of the president implies that citizens are likely to use news and information about the president to update beliefs about the president’s party. We therefore hypothesize that as the public’s evaluations of the president become more favorable, the reputation of the president’s party also becomes more favorable. The fact that citizens are incompletely informed about politics is necessary for the relevance of party reputations, but we do not think they are completely ignorant either. Moreover, citizens are clearly heterogeneous in their political awareness and sophistication (Gomez and Wilson 2001). The most informed and sophisticated citizens are likely to weigh different partisan sources in updating their evaluations of the parties. For the informed voters we believe that information about Congress and the congressional parties as well as the president will influence changes in party reputations. In contrast, we expect less informed citizens to rely only on information about the president. This implies that some citizens take congressional parties into account but that more citizens take into account the president than the congressional parties. We therefore hypothesize that as the public’s evaluations of a congressional party becomes more favorable, the reputation of that party will become more favorable. Furthermore, if the party is also the party of the president, then we expect the party’s reputation to be less responsive to evaluations of the congressional party than to evaluations of the president.
Reputations, Partisanship, and Electoral Outcomes
If party identification is a strong predictor of a citizen’s vote because it is a “standing decision” (Key 1966), then we expect that changes in reputation will ultimately lead to changes in electoral outcomes and that its effect should be mediated through partisanship. The logic is as follows. Government produces either positive results (e.g. a booming economy or peaceful foreign relations) or negative results. Parties acquire a reputation for good performance based on the public’s evaluations of policy outcomes.
5
Voters—especially centrists who are initially indifferent or have weak preferences—then adjust their partisan identification based on the relative reputations of the parties. Partisan identification then affects election outcomes directly through party voting. The effect of party reputation is therefore indirect. This view of the role of party reputation is consistent with the micro-level concept of partisanship as a “running tally” articulated by Fiorina (1981) and also modeled by Achen (1992). According to this view, we expect that if more citizens evaluate party A more favorably than party B, then party A will increase its share of citizens identifying with it. How do we expect changes in reputation to affect the vote? On the one hand, if we make the extreme assumption that votes are purely functions of partisanship rather than the information underlying that partisanship, then we would expect changes in the proportion of partisans (i.e. macropartisanship) to directly affect election outcomes (Erikson, Mackuen, Stimson 2002) but that changes in relative reputations would not. On the other hand, given a more reasonable assumption consistent with the analysis of Fiorina (1981, chapter 8) we expect that votes are determined not only by party identification but also by prospective evaluations of the parties—that is, reputations. We therefore expect, as shown in Figure 1, that changes in party reputations have both direct and indirect effects on electoral outcomes. An alternative justification for both direct and indirect effects could be based on the social-psychological conception of party identification in which party ID serves as a perceptual screen (Berelson et al 1954; Converse et al 1960; Zaller 1992). In this case, if partisans vote their party, then changes in macropartisanship should produce changes in electoral outcomes. For independents and non-partisans, changes in party reputations would produce changes in electoral outcomes. However, the traditional and revisionist theories of party identification lead to different predictions about the direction of causality between party identification and party reputations. In the traditional view, we would expect the arrow to run in one direction: from party identification to party reputations and not the converse. In the revisionist view, we would expect the direction to run from party reputations to party identification, but it is unclear whether there might also be an arrow running the other way.
6
Figure 2: Revised role party reputation in the electoral process
2. Measuring Relative Party Reputation
Since we are interested in measuring changes in the public’s aggregate beliefs over time, we follow practices established by Stimson (1999) and construct time series measures based on repeated aggregate survey data. Our concept of reputation might be tapped by either generic or issue-specific questions about party approval analogous to the ubiquitous presidential approval question, but such questions are too infrequent and irregularly spaced to be of much use. We searched through various archives of survey questions (Roper’s iPoll, Gallup, and National Journal’s Polltrack) and found instead that polling organizations have very frequently asked questions about citizens’ relative evaluations of the parties, such as “Which political party do you think would do a better job handling [issue]?” The questions pertain to a wide variety of issues: war and peace, foreign affairs, economic prosperity, taxes, crime, social security, education, the environment, and so on. Although some questions, like the Gallup peace and prosperity question, go as far back as half a century, we found that most are asked only with sufficient regularity beginning in 1980. Our search of survey marginals from 1980 to 2005 yielded a total of 518 distinct question series and a total of 3,095 question administrations, which we categorized into approximately 50 major issues. We define a question series as unique to a survey organization and containing identical or substantially similar question wording. Because we are interested in estimating the importance of different institutional officeholders, we retain only questions that refer generically to the parties and drop all questions that mention an individual politician (e.g. a president) or an institution (e.g. “Democrats in Congress”). This leaves 362 series and a total of 2,473 data points (question administrations).
7
Response categories sometimes differ across questions, so in order to compare aggregate responses across series we calculate a common quantity the percentage of all respondents choosing the Democrats out of all respondents choosing Republicans or Democrats (we will refer to this variable as DEMPCT). Table 1 provides a summary of question frequency and statistics for DEMPCT for the twenty issues most frequently covered. Among the top issues, the most frequently asked about issues are the economy, social security, and the “most important problem.” Questions about the parties’ handling of the economy are not only the most frequent (11.5% of all observations) but also the most regular, as they are asked in 84 of the 104 quarters. Most of the major issues span the entire period, beginning in 1980 or 1981 and continuing through 2005. Only a few issues are time bound, such as terrorism (beginning after 9/11) and welfare (1992-1997). When the number of quarters is compared to the period of coverage, it is clear that there are many gaps in the individual series, though the measurement strategy we adopt accounts for this potential difficulty. Turning to the summary statistics for DEMPCT in Table 1, the average perceptions of the two parties’ relative abilities to handle issues conform to conventional wisdom and previous findings about party images. Domestic social policy issues such as social security, health care, education, unemployment, and the environment favor the Democrats (on average, over 55 percent of respondents choosing one of the parties chose the Democrats). Although these issues tend to favor the Democrats, the minimum values indicate that Republicans at times have slight advantages on these issues (when DEMPCT is less than 50 percent). Only in handling the environment and abortion are Democrats always favored. On average, the Republican Party is favored on issues of foreign policy, terrorism, defense, trade, and inflation. Only on terrorism and inflation are the Republicans nearly always advantaged, with Democrats at best pulling nearly even. The remaining issues are more competitive, with mean values between 45 and 55 percent and with minimum and maximum values that correspond to each party sometime having a two-to-one advantage. These issues include what are often considered “performance” issues such as the economy, war and peace, and generic “most important
8
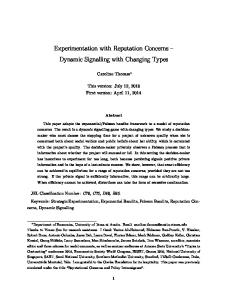
problem” questions. Our data also show that taxes and crime and drugs are both competitive rather than Republican-owned issues. 2 In order to create a time series measure by aggregating our data with different question wordings that overlap but occur at irregular intervals, we employ Stimson’s (1999) dyad ratios algorithm, which he uses to construct a measure of aggregate liberalism (policy mood) and others have used to measure congressional approval (Durr, Gilmour, and Wolbrecht 1999) and trust in government (Chanley, Rudolph, and Rahn 2000). The algorithm is essentially an averaging process that creates a measure capturing the shared variance in different series. By combining questions about relative evaluations of the parties across many different issues, we obtain a general measure of relative reputation that reflects the common variance of change over time. 3 Figure 2 plots the combined aggregated measure for the years 1980 – 2005. Section 4 presents a more systematic discussion of the political effects of party reputation (as we have measured it here). But a preliminary look at the measure’s relationship to recent political history strongly suggests a relationship between party reputation and electoral outcomes. Reagan’s victory comes in a period of declining Democratic fortunes, while Clinton’s victory comes in a period where Democrats were gaining ground. Other political events such as the 1982 midterm elections, the 1994 midterm elections and Bush’s 2000 election appear to come in plausible periods. Before turning to a more systematic discussion of the effects of party reputation on electoral outcomes, we test our hypotheses about the sources of party reputation.
2
With respect to the tax issue, while some questions ask about “tax cuts” which tend to favor Republicans, other questions ask about generic “taxes” or “holding the line on taxes” which do not evoke the same responses; for crime, this might have to do with Clinton’s success at changing the nature of the issue in the 1990s (see Holian 2004). 3 In Appendix A, we demonstrate that it is reasonable to aggregate across issues by showing that there is common movement between the evaluations of parties on different issues at successive levels of aggregation.
9
Table 1. Summary statistics for most frequent issues Observations Economy and Prosperity
# Series
# Quarters
Years Covered
DEMPCT Mean
St Dev
Min
Max
5.4 5.0 5.7 6.3 6.3 5.7 7.5 6.9 5.7 8.9 5.7 8.4 5.6 6.6 8.4 6.4 6.3 3.4 8.0 5.0
33.8 44.8 33.9 44.8 32.4 44.7 25.9 45.7 31.0 22.8 53.3 19.0 43.5 20.0 20.0 29.6 27.3 51.5 26.5 54.0
67.1 84.1 83.8 86.4 70.0 76.1 70.9 75.0 58.5 66.2 83.1 57.1 68.9 50.0 58.1 59.6 49.3 64.2 64.9 72.4
10.6 10.9
19 14.7
86.4 86.4
(11.5%) (9.7%) (8.5%) (8.2%) (6.6%) (6.6%) (5.3%) (4.5%) (4.3%) (3.9%) (3.8%) (3.5%) (2.4%) (2.3%) (2.1%) (1.5%) (1.4%) (1.3%) (1.2%) (1.2%)
26
84
1980-2005
26 9 32
Trade Prices and Inflation Abortion Moral Values Helping the Middle Class
284 240 210 203 164 162 132 112 106 97 95 86 59 56 53 36 34 32 30 29
7 8 8 4 5
51 80 55 63 60 65 56 47 57 53 46 39 16 26 28 25 24 18 23
1981-2005 1980-2005 1983-2005 1981-2005 1981-2005 1982-2005 1980-2005 1981-2002 1980-2005 1981-2005 1981-2005 1982-2005 2001-2005 1981-2005 1983-2005 1980-1992 1989-2005 1998-2005 1981-2005
50.2 58.9 51.4 63.6 47.2 58.1 49.2 58.3 45.8 49.1 69.1 38.2 57.1 31.4 34.8 41.6 38.3 57.5 39.3 63.4
Total, Most Frequent Total, Overall
2220 2473
(89.8%) (100.0%)
289 362
95 101
1980-2005 1980-2005
52.4 52.7
Social Security Most Important Problem Health Care Taxes Education Budget and Deficit Jobs and Unemployment Crime and Drugs War and Peace Environment Foreign Policy Helping People Like Yourself Terrorism Defense
19 15 21 16 15 16 15 14 9 13 11
10
70
65
1998 midterm
Clinton elected 1982 midterm
60
Clinton re-elected
1986 midterm
55
50
45 GW Bush elected GHW Bush elected
40
Republicans win Congress 2002 midterm
Reagan re-elected 35
GW Bush re-elected
Reagan elected
19 80 19 q1 80 19 q4 81 19 q3 82 19 q2 83 19 q1 83 19 q4 84 19 q3 85 19 q2 86 19 q1 86 19 q4 87 19 q3 88 19 q2 89 19 q1 89 19 q4 90 19 q3 91 19 q2 92 19 q1 92 19 q4 93 19 q3 94 19 q2 95 19 q1 95 19 q4 96 19 q3 97 19 q2 98 19 q1 98 19 q4 99 20 q3 00 20 q2 01 20 q1 01 20 q4 02 20 q3 03 20 q2 04 20 q1 04 20 q4 05 q3
30
Figure 2. Elections and relative party reputation over time (Higher values represent greater favorability of Democratic Party.)
11
3. Empirical Analysis of Institutional Sources
To test our claims about institutional sources, we model relative party reputation as a function of lagged reputation, presidential approval and congressional approval, with appropriate interactions for party. In order to account for the effects of presidential popularity, we include presidential approval separately for each president (these variables take on a value of 0 if the respective president is not in office) and set of dummy variables for each president except for Carter. 4 Since higher values of the reputation measure indicate higher relative Democratic reputations, we expect that the coefficients for presidential approval are positive for Democratic presidents and negative for Republican presidents. While it would be ideal to have measures of approval for each congressional party, none are available on a consistent basis for the period of our analysis. Instead, we assume that the congressional majority party is credited (or blamed) for the performance of the institution as a whole. This assumption is consistent with work by Jones and McDermott 2004 on the role of congressional approval at the individual level. It also seems consistent with current theories of party government that focus on the majority party, e.g., Rohde 1991 and Cox and McCubbins 1993 and 2005 Matters are complicated when party control of Congress is split, so we account for partisan control in two ways. In the first model, we assume that congressional approval affects reputation only if a party controls both the House and the Senate. To capture this idea, we create indicator variables for each party (DemCong and RepCong) that indicate unified control of Congress. We then interact each indicator with a measure of congressional approval and include it in the model along with the indicators themselves. 5 According to our hypotheses, the coefficient for the interaction between DemCong and congressional approval should be positive while the interaction between RepCong and congressional approval should be negative. Both should be smaller in magnitude than the coefficients for presidential approval.
4
Data on presidential approval is from the Gallup Poll. The congressional approval measure is an updated version of the Durr et al. measure provided by Mark Ramirez.
5
12
In the second model, we assume that credit and blame is split between the House and the Senate. To capture this, we create a party control variable for each chamber (PtyHouse and PtySen) that takes on a value of 1 if the Democrats control the chamber and -1 if the Republicans control the chamber. This model therefore captures institutional variation in the sources of reputation both between the president and Congress as well as within Congress itself. We expect that the coefficients for both chambers’ interaction with congressional approval are positive. The results of our regression analysis (estimated using ordinary least squares) are reported in Table 2. The data clearly establish a relationship between presidential approval and party reputation in the way that we hypothesize. Regardless of the model used for congressional approval, the presidential approval coefficients are positive for Democratic presidents, negative for Republican presidents, and are all statistically significant except for Carter’s approval (likely due to the fact that there are only four observations for 1980 in the data). Party fortunes clearly rise and fall with the popularity of its presidential standard bearer—the most visible and identifiable representative of the party. Our findings for the role of congressional approval are mixed and somewhat unexpected. Although none of the coefficients in either model are statistically significant at conventional levels, we find that when we model the role of congressional approval in terms of unified party control of both chambers (Model 1), that higher congressional approval translates into lower relative Democratic reputation regardless of the party in control. Thus, the data are consistent with our expectations for Republicans but contradict our expectations for Democrats. In addition, the magnitudes of the coefficients are roughly similar to those for presidential approval. In terms of the second model, where we attribute the effects of congressional approval to each chamber separately, we find that reputation is positively related to approval for the party that controls the Senate (as expected) but negatively related to approval for the party that controls the House (contradicting our expectations). The size of the effect of party control of the House is small relative to that for the Senate, the latter being closer in magnitude to the effects of presidential approval. Our evidence regarding
13
the relationship between congressional approval and party reputations is therefore mixed with respect to both parties and chambers. We also estimated several models to determine the effect of various objective economic indicators on party reputation instead of subjective evaluations. The results were mixed but overall, GDP growth under a president appeared to have a positive effect on party reputation (except during the Clinton administration). Unemployment had no effect on party reputation except under Reagan and Clinton where higher rates of unemployment led to a decrease in the respective assessments of their political parties. In general, economic conditions under a period of Democratic or Republican control of Congress were not significant, except that the findings for Democrats mirrored the results with respect to approval: higher rates of GDP growth led to a decrease in party reputation when Democrats controlled Congress. Overall, the data are consistent with our hypothesis about the importance of the president in shaping the public’s relative evaluations of the parties. 6 The weak findings for congressional approval are consistent with our previous research (Pope and Woon 2005), where we found that passage of major legislation on specific issues did not lead to any change favoring the majority party in terms of issue-specific relative reputations. In future research, we aim to examine specific actions that the public evaluates—such as presidential pronouncements or vetoes, legislative activity, and passage of the party agenda—especially as they pertain to partisanship and presidential-congressional interactions. For now we turn to a discussion of the role of party reputation in American electoral politics.
6
We also conduct a similar analysis of individual-level data from the American National Election Studies and find that presidential approval is significantly related to which party respondents think can better handle the economy in the way we hypothesize but that the effect of congressional approval is not statistically significant. This analysis is available upon request.
14
Table 2. Party reputation as a function of subjective evaluations of the president and Congress Model 1 Reputation{t-1}
Model 2
0.38
(4.35)
0.37
(4.28)
Carter Approval
0.64
(0.99)
1.00
(1.55)
Reagan Approval
-0.28
-(4.89)
-0.22
-(3.08)
Bush1 Approval
-0.14
-(2.99)
-0.21
-(4.71)
Clinton Approval
0.29
(3.74)
0.26
(3.26)
Bush2 Approval
-0.11
-(2.24)
-0.17
-(3.31)
Reagan dummy
38.53
(1.71)
45.51
(2.01)
Bush1 dummy
29.87
(1.31)
46.42
(2.05)
Clinton dummy
7.96
(0.35)
23.48
(1.07)
Bush2 dummy
30.46
(1.33)
46.92
(2.09)
DemCong x CongApp
-0.25
-(1.57)
DemCong
10.51
(1.69)
RepCong x CongApp
-0.26
-(1.68)
RepCong
9.88
(1.64)
PtyHouse x CongApp
-0.08
-(0.70)
DemHouse
9.63
(1.20)
PtySen x CongApp
0.20
(1.92)
-15.45
-(1.87)
-1.00
-(0.05)
Presidential Approval
Congressional Approval
DemSen Constant
7.66
(0.35)
Adjustd R^2
0.74
0.74
N
103
103
Note: OLS regressions, t statistics in parentheses.
15
4. Empirical Analysis of Macropartisan and Electoral Consequences
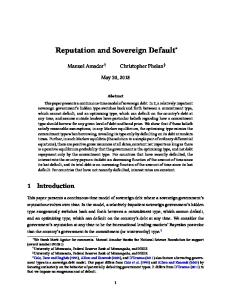
To the extent that government institutions succeed in producing desirable policy outcomes, our data thus far suggest that the president’s party is the primary beneficiary of credit that the public gives for such success. In this section, we investigate the implications of these aggregate changes for one of the most basic goals of parties (to win elections) and its most famous mediator (party identification). In the previous sections, even though our data spanned a relatively short period of time (25 years), they were measured frequently enough (quarterly) to permit sufficient leverage in our statistical analysis. When we turn to studying elections, however, we are left with one election for every eight quarters. In addition to using the relative reputation measure described in Section 2, we create an alternative reputation measure using the same dyad ratios algorithm from the three longest series in our data: Gallup questions about which party will keep the country prosperous, keep the country out of war, and better handle the most important problem. Although we lose the benefits in terms of accuracy of aggregating over hundreds of series and a variety of issues, we gain a longer series that spans 1952-2005, doubling the number of elections we can use as observations. The two reputation series correlate at 0.64, and Figure 4 shows the similarity in movement between them. The three long Gallup series correlate with our original measure at 0.86, 0.75, and 0.93, respectively, so we are reassured that the
40
50
60
70
80
measures tap into the same component of the public’s evaluation of the parties.
1950
1960
1970
1980
Peace, Prosperity and MIP
1990
2000
All Series
Figure 4: Two measures of party reputation 16
Macropartisanship
We assess the impact of party reputation on macropartisanship by estimating two simple regression models for different time intervals and present the results in Table 3. The first model is a regression of macropartisanship on party reputation and institutional control only for lagged values of macropartisanship. When the analysis is restricted only to the 26 election years between 1954 and 2004 using the alternate reputation measure, we find that there is a clear, statistically significant effect. The effects of reputation and lagged macropartisanship are roughly equal in magnitude, suggesting that party reputation does a very good job of predicting changes in the partisan makeup of the electorate. (Reputation is actually larger than the magnitude of the coefficient for lagged macropartisanship, 0.38 compared to 0.31, but the 95 percent confidence intervals overlap.) When we expand the analysis to also include non-election years and also examine the quarterly data (using the original measure), the impact of party reputation remains statistically significant but the size drops to roughly one third of the coefficient of macropartisanship’s lagged values (with the two 95 percent confidence intervals not overlapping). Erikson, Mackuen and Stimson (1998, 2002) argue in their work that the main determinants of macropartisanship are presidential approval and consumer sentiment, so we also estimate a regression model that controls for them. When we include controls for presidential approval interacted with party, consumer sentiment interacted with party, and an indicator variable for the party of the president, we find that party reputation still influences macropartisanship. The coefficient is unchanged for the election year analysis and it decreases slightly when the sample includes all years, but in both cases remains statistically significant. For the quarterly data, the coefficient decreases and is no longer statistically significant, but neither are presidential approval and consumer sentiment. We caution that our analysis is rather simple and far less statistically sophisticated than the exchange between Green et al (1998) and Erikson et al (1998), but nevertheless our data suggest to us that party reputation has an important role in mediating the effect of government activities on macropartisanship.
17
Table 3. Macropartisanship as a function of party reputation, presidential approval, and consumer sentiment Election Years, 1954-2004
Yearly, 1954-2005
Quarterly, 1980:1-2005:4
Macropartisanship {t-1}
0.31
(2.83)
0.28
(2.06)
0.61
(8.99)
0.61
(8.63)
0.74
(13.85)
0.74
(13.82)
Party Reputation
0.38
(6.77)
0.38
(5.30)
0.22
(6.53)
0.16
(3.86)
0.21
(3.56)
0.12
(1.50)
Presidential Approval * Party
-0.01
-(0.19)
0.06
(2.03)
0.04
(1.46)
Consumer Sentiment * Party
0.01
-(0.06)
-0.06
-(2.25)
0.01
(0.34)
Democratic President
-0.53
(0.26)
-5.72
-(1.82)
-5.7
-(1.59)
22.6
(3.30)
22.5
(4.51)
11.2
(2.08)
Intercept
20.8
Adjustd R^2
0.79
0.77
0.87
0.88
0.73
0.74
26
26
52
52
103
103
N
(3.65)
11.7
(3.65)
1.09
(1.22)
Note: OLS regressions, t statistics in parentheses.
18
Macropartisanship and Reputations: Direction of Causality
The preceding results establish a clear correlation between macropartisanship and party reputation. But the nature of the relationship is not entirely clear. Are partisans offering rationalizations of their preferred party (the traditional view) or are people updating their partisanship based upon their assessments of the two parties’ records (the revisionist view)? In other words, can we establish anything about the direction of causality? To better analyze the direction of the relationship between party reputations and macropartisanship we estimate a vector autoregression model (VAR). Reduced form VAR models treat all variables as endogenous and are especially useful when the direction of causality is unknown to the analyst, as it is here. Our two variables are macropartisanship and relative party reputation. The VAR model specifies each variable as a linear function of p lags of itself and p lags of the other variables. The definition of causality here is the one defined by Granger (1969). One time series (X) can be said to Granger-cause another (Y) when F-tests on lagged values of X demonstrate that those values provide statistically significant information for predicting Y. In our case, we are testing whether or not party reputation Granger-causes macropartisanship and vice versa. Table 4 displays both the results of a VAR model with 3 lags and the Granger causality F-tests for the set of macropartisanship lags on party reputation and the set of party reputation lags on macropartisanship. 7 The results indicate that the two concepts Granger-cause one another: information on lagged party reputation can be used to predict macropartisanship and vice versa. We can reject a version of party identification in which it is an “unmoved mover” where the causal arrow flows only from party identification to beliefs about parties. Instead, the causal arrow appears to run both ways. That a party’s reputation would have an impact on that party’s number of adherents seems straightforward and consistent with the revisionist school of party identification: parties that govern with unpopular policies will bleed adherents. But partisans also clearly have informational biases that may result
7
One significant hurdle in VAR analysis is establishing the number of lags to include in the model. We address this issue in Appendix B.
19
from a psychological attachment or social identification (Bartels 2002). Increasing the number of Democrats will have an echo effect on party reputation. Though, in the aggregate and the long-run, citizens will eventually respond to public policies offered by the parties (Page and Shapiro 1992) there will be shorter-term effects of macropartisanship on a party’s reputation. For instance, in recent months Republicans have been more likely to evaluate the Bush administration’s handling of Iraq favorably while Democrats and Independents are virtually unanimous in their condemnation of the administration. 8 Similar patterns are likely to emerge on other—less-charged—issues. In sum, we find a somewhat complicated relationship between the two concepts and are therefore unable to tell a simple story about causality. They are related, and the relationship surely merits further research. We can say, however, that party reputation has an important role to play in the political arena, which we show next.
8
It should be noted though that most Republicans have an unfavorable evaluation of the Bush administration’s foreign policy.
20
Table 4. Vector autoregression model estimates of relationship between relative party reputation and macropartisanship
Dependent Variable Party Reputation
Independent Variables Party Reputation (t - 1) Party Reputation (t - 2) Party Reputation (t - 3) Macropartisanship (t - 1) Macropartisanship (t - 2) Macropartisanship (t - 3) Intercept n = 101, R-squared = 0.71
Coefficient 0.698 0.244 -0.257 0.302 -0.071 -0.237 16.405
Standard Error 0.101 0.121 0.097 0.107 0.111 0.105 3.554
P-value 0.000 0.043 0.008 0.005 0.524 0.023 0.000
Party Reputation (t - 1) Party Reputation (t - 2) Party Reputation (t - 3) Macropartisanship (t - 1) Macropartisanship (t - 2) Macropartisanship (t - 3) Intercept n = 101, R-squared = 0.72
0.207 0.080 -0.244 0.484 0.279 0.052 8.059
0.010 0.119 0.095 0.105 0.109 0.103 3.498
0.038 0.498 0.011 0.000 0.010 0.611 0.021
Macropartisanship
Granger F-Test Statisic
P-value
10.149
0.017
11.153
0.011
21
Electoral Consequences
In Table 5, we estimate the impact of party reputation on the national percentage of Democratic votes in House elections. First, we estimate a model with only party reputation and lagged votes as regressors and find that party reputation is a statistically significant predictor. An average magnitude inter-election change in the reputation variable (around 5 units of the measure) translates into a 0.8 percentage point change in the national vote share. Following the macro-level electoral model of Erikson et al (2002), when we include macropartisanship, policy mood (capturing aggregate liberalism), and a midterm effect (coded 0 for presidential election years, 1 if the president is a Democrat and -1 if a Republican), only the midterm effect is significant. Including additional controls for presidential approval, consumer sentiment, and party of the president along the lines of traditional aggregate electoral models (e.g. Tufte 197x, Jacobson 199x), we find that there is a midterm effect and that the effect of the presidential approval-presidential party interaction is significant and positive. This result is consistent with existing analyses of election outcomes at the aggregate level. As our earlier analysis showed, macropartisanship and party reputation are closely related. Indeed, the simple bivariate correlation is 0.86, which suggests that we may be unable to cleanly disentangle their effects on election outcomes because of multicollinearity. When we omit macropartisanship from the full model, the effect of party reputation is statistically significant while the other coefficients are relatively unchanged. Alternatively, when we omit party reputation but instead include macropartisanship, the effect of macropartisanship is not significant. This suggests that the impact of party reputation on elections may be more direct than we initially suspected rather than an indirectly operating through partisanship. Clear substantive effects are difficult to calculate given the data. However, based on the coefficient magnitudes we would expect that a 10 point change (slightly larger than one standard deviation) in party reputation would yield a corresponding 1 to 2 percent change in the overall share of votes in House races. That may not sound like much, but since the standard deviation of Democratic votes is just over 3 percentage points that amount could clearly swing a number of seats toward the Democrats.
22
We replicate the analysis using the number of Democratic seats as the dependent variable and present our results in Table 6. The results are similar to those for vote share, although the effect of presidential approval is no longer statistically significant. The estimates do show the same patterns for the impact of party reputation and macropartisanship. Without controls, a one unit gain in party reputation leads to a gain of one and a half seats (the corresponding one standard deviation change of 8.8 reputation units leads to a change of approximately 13 seats). When macopartisanship is controlled for, neither variable has a statistical effect. However, with the full set of controls, macropartisanship and party reputation are significant when included without the other. A one unit change in party reputation controlling for other factors leads to a one seat change, while a one percentage point increase in aggregate partisanship leads to slightly more than a two seat increase. In terms of standard deviation changes, these effects are roughly equivalent, as the standard deviation of party reputation is almost twice the magnitude of macropartisanship. Our data therefore tell us that party reputation affects electoral outcomes in terms of both votes and seats, but our evidence remains ambiguous about whether it is a direct effect or if it works indirectly through macropartisanship. Regardless, we can conclude party reputation does play an important mediating role between assessments of the parties’ performance in governing and the partisan direction of electoral outcomes.
23
Table 5. Democratic vote share as a function of party reputation, macropartisanship, policy mood, approval, consumer sentiment, and midterm elections, 1952-2004
Democratic Votes {t-1}
0.41
(2.46)
0.55
(4.33)
0.71
(4.28)
0.67
(4.77)
Party Reputation
0.16
(2.51)
0.11
(1.22)
0.14
(1.43)
0.10
(1.97)
Macropartisanship
0.11
(0.57)
-0.10
-(0.45)
Policy Mood
0.02
(0.18)
-0.10
-(0.93)
-0.07
Midterm Election
-2.80
-(5.22)
-4.10
-(3.95)
Presidential Approval * Party
0.12
Consumer Sentiment * Party Democratic President 8.70
(0.74)
(3.99)
0.16
(1.33)
-(0.84)
-0.03
-(0.29)
-3.9
-(4.22)
-3.7
-(3.61)
(2.29)
0.11
(2.35)
0.11
(2.06)
-0.05
-(1.04)
-0.05
-(0.98)
-0.03
-(0.68)
-1.97
-(0.28)
-2.3
-(0.33)
-4.7
-(0.68)
20.74
(1.66)
17.1
(1.83)
11.4
(1.04)
Intercept
21.70
Adjustd R^2
0.42
0.72
0.75
0.76
0.73
27
27
27
27
27
N
(2.72)
0.67
Note: OLS regressions, t statistics in parentheses.
24
Table 6. Democratic seats as a function of party reputation, macropartisanship, policy mood, approval, consumer sentiment, and midterm elections, 1952-2004
Democratic Seats {t-1}
0.45
(2.97)
0.59
(4.75)
0.66
(4.47)
0.69
(5.26)
Party Reputation
1.52
(3.25)
0.91
(1.22)
0.77
(0.99)
1.05
(2.56)
Macropartisanship
1.43
(0.92)
0.77
(0.44)
Policy Mood
0.97
(1.25)
0.23
(0.27)
0.004
-20.70
-(4.77)
-22.10
-(2.81)
Presidential Approval * Party
0.67
Consumer Sentiment * Party Democratic President
Midterm Election
-94.80
-(1.05)
(4.39)
2.21
(2.35)
(0.01)
0.63
(0.82)
-23.3
-(3.23)
-30.52
-(2.67)
(1.57)
0.74
(1.91)
0.62
(1.46)
-0.09
-(0.21)
-0.13
-(0.33)
0.02
(0.05)
-56.20
-(0.95)
-53.9
-(0.93)
-72.3
-(1.27)
8.96
(0.09)
45.18
(0.71)
-48.11
-(0.55)
Intercept
52.63
Adjustd R^2
0.54
0.75
0.76
0.77
0.76
27
27
27
27
27
N
(1.46)
0.65
Note: OLS regressions, t statistics in parentheses.
25
5. Discussion
Political parties—whether as a label, a “brand name” or some other conception— lie at the heart of the connection between citizens and government. The conception of party reputation we discuss in this paper seems to hold up to initial scrutiny. The public’s beliefs about the net benefits provided by the party when it holds political power appear to be shaped by citizen evaluations of the president. These evaluations in turn have an impact on both the distribution of partisans in the country (albeit in a complicated and reciprocal way) and election outcomes in recent American politics. This raises our confidence that parties do serve the intermediary function that so many scholars attribute to them. It also suggests that institutional accounts of political parties that rely on an electoral motivation to protect a party’s brand name (e.g. Cox and McCubbins 1993, 2005) are correct in the sense that there is a party reputation that influences elections. Politicians need to worry about the party’s image with voters. To ignore that factor could lead to significant electoral defeats. However, our data show that the connection between government activities and voters seems to center in perceptions of the president and not in perceptions of the Congress. When congressional party leaders abdicate the responsibility for shaping and maintaining the brand name to the president, as Dennis Hastert and Bill Frist seemed to do during George W. Bush’s presidency, then the party’s reputation and its electoral fortunes rise and fall with the president as we clearly saw with the 2006 midterm elections.
26
Appendix A: Combining Relative Reputations Across Issues
Our aggregation of distinct policy issues is analogous to the aggregation of disparate issues in Stimson’s construction of policy mood, and so we must address whether such aggregation is appropriate. It is important to keep in mind that we while we employ methods and follow analytic procedures developed by Stimson, we are measuring what is in principle a distinct concept: reputation involves which party people think better handles policy, while policy mood entails what people think government ought to do. We demonstrate that it is reasonable to aggregate across issues by showing that there is common movement between the evaluations of parties on different issues at successive levels of aggregation. First, we use the measurement algorithm to construct issue-specific measures of relative reputations. This necessarily involves only a subset of the data where there are a sufficient number of overlapping series for an issue. We did this for eleven different issues but spare the reader by describing the results for one set of related issues. (See Table A1 for the issues we estimated separately.) Figure A1 shows the separate series regarding the parties’ relative handling of four economic issues: the general economy (including “prosperity”), jobs/unemployment, budget/deficit, and taxes. The estimated measures account for 74%, 83%, 84%, and 73%, respectively, of the variance in the component series and since the component series all address a single issue, these figures provide a benchmark against which we can evaluate the effects of aggregating across less-related issues. The similarity in both the levels and common movement for the general economy, budget, and taxes is quite striking, especially after 1990. The parties’ handling of jobs seems to move in parallel with the parties’ handling of the economy, the only difference being that the Democrats have a constant advantage that accounts for differences in the levels of the two series. When we aggregate related issues into general issue areas—economic, domestic policy, domestic social, and foreign—we find that overall, the resulting series continue to
27
account for a substantial amount of variance. 9 The issues that comprise each more general issue area are listed in Table A1. The foreign policy measure accounts for 80% of the variance in its component series, while for economic issues it is 68%, for social issues it is 78%, and for policy issues it is 56%. Note that there is a drop in shared variance relative to the issue-specific benchmarks, as should be expected from the increasing heterogeneity of issues. The largest drop occurs for the policy issue group, which contains the greatest variety of issues (e.g. education as well as crime), but the measure still accounts for more than half of the overall variance. Figure A2 plots these four series and shows that while there is a clear ordering of the parties across issues, there are also clear parallel movements between three of the four general issue areas (the exception is social policy). The ordering is consistent with common stereotypes and issue ownership theory: Democrats are advantaged on policy at home, Republicans are advantaged on dealing with the world abroad, and handling of the economy is a competitive performance issue. In terms of shared movement, these three series all clearly rise together between 1995 and 1997 and then again between 2002 and 2005. Sometimes only the economic and foreign series move together (e.g. before 1990 and after 2002), while sometimes the economic and domestic policy series move together more closely (as in the rise and fall around 1992). The general pattern, however, is clear: there is a substantial amount of shared movement between the different types of issues. When we combine all available issue series together to create our measure of relative reputation, we are clearly combining many distinct and seemingly unrelated issues (for example, foreign affairs, crime, and the environment). Nevertheless, the general measure accounts for 53% of the variance in the 362 series. While this is clearly less than for a single issue such as unemployment, it is only slightly less than the measure constructed from combining domestic policy issues. Since the dyad ratios algorithm is intentionally analogous to factor analysis, we can assess whether the one-dimensional structure of reputation is appropriate by comparing it with the variance accounted for by estimating a second dimension. It turns out that the second dimension accounts for only
9
Note that when we increase the level of aggregation, we also increase the number of underlying series that we can include. The additional series are the ones that we cannot combine with any series at the lower level.
28
14% of the overall variance, which while not negligible is clearly less important than the first dimension. Turning to the interpretation of our measure of relative reputation and its relation to the component issues, Table A2 presents correlations between general reputation and the major issue components. The first column displays the correlations between general reputation and the estimated issue-specific and issue-area measures of reputation, and the second column presents the weighted average of correlations of the raw component series (for series with more than two time points). The table shows that regardless of the method of computation, the general reputation measure is most correlated with economic and performance issues. The highest correlations are for the most important problem, budget, terrorism, trade, prices, jobs, and the general economy. The correlations with many of the policy and foreign affairs issues are moderate, such as for education, health care, taxes, and the environment. Social issues as a group and individually, such as moral values, are uncorrelated with general reputation. Together, these observations strongly suggest that our measure mainly captures the public’s perceptions of the difference between the parties’ ability to deliver desirable policy outcomes where the public is in agreement on what constitutes good performance (such as strong economic growth or low unemployment). On policy issues such as social security or health care there is more likely to be greater disagreement among the public as to what constitutes desirable outcomes, and this is consistent with the smaller correlations between the general measure and these issues. If our interpretation is correct, the moderate correlations nevertheless indicate that the performance component of many policy issues is not insignificant. In contrast, on issues where value conflict is greatest— social issues, such as abortion and moral values—the issues are clearly uncorrelated with the general measure.
29
Table A1. Major issue categories Economic
Domestic Policy
Domestic Social
Foreign Policy/Defense
Unclassified**
budget*
crime and drugs*
abortion
defense
america strong
jobs*
education*
civil rights
foreign policy*
american dream
prices and inflation
Energy
corporate fraud
terrorism
better America
prosperity and economy*
environment*
ethics
trade
campaign finance
taxes*
health*
families
war and peace*
change
Medicare
gays
govt waste
Poverty
gun control
honesty
social security*
immigration
ideas
Welfare
moral values
ideas for future
race
inspiring confidence
tolerance
keep promises
values
leadership less partisanship lewinsky manage govt most important problem* middle class misc people like you trust to lead wealthy
* Issue series estimated ** Category series not estimated
30
Table A2. Components of relative party reputation Weighted Average Correlations with Individual Question Series
Correlation with Estimated Issue/Area Series
Economy and Prosperity
0.62
0.80
Social Security
0.29
-0.44
Most Important Problem
0.85
0.94
Health Care
0.32
-0.02
Taxes
0.39
0.50
Education
0.59
0.26
Budget and Deficit
0.73
0.56
Jobs and Unemployment
0.69
0.72
Crime and Drugs
0.44
0.47
War and Peace
0.50
0.31
Environment
0.48
0.37
Foreign Policy
0.53
-0.04
Helping People Like Yourself
0.56
Terrorism
0.79
Defense
0.55
Trade
0.75
Prices and Inflation
0.81
Abortion
0.02
Moral Values
0.04
Helping Middle Class
0.39
Issues
Issue Groups Economic
0.61
0.78
Foreign
0.59
0.43
Policy
0.40
0.34
Social Other
-0.08 0.71
0.18
31
70
Prosperity/Economy
Democratic Advantage 40 50 60
Jobs
Taxes
30
Budget
1980q1
1985q1
1990q1
1995q1
2000q1
2005q1
Social
Policy
30
Democratic Advantage 40 50 60
70
Figure A1. Relative party reputations for handling economic issues
1980q1
Foreign
Economic
1985q1
1990q1
1995q1
2000q1
2005q1
Figure A2. Relative party reputations for handling general policy types
32
Appendix B: Selecting the Lag Length for the VAR Model
There are a number of options available for such a test. One common model us a likelihood-ratio (LR) test that compares a VAR model with p lags against one that has p – 1 lags. The null hypothesis for this test is that all of the coefficients on the p lags of the variables are zero. An alternative approach is to use various information criteria statistics such as Akaike’s information criterion (AIC), final prediction error (FPE), Hannan-Quinn information criterion (HQIC), and Schwarz’s Bayesian information criterion (SBIC). When using these criteria, the selected lag is the one with the smallest value selected by that criterion. Table B1 displays the results of a test of up to four lagged variables. The results seem to strongly suggest that 3 lags are the most appropriate number. The 4th lag’s ratio statistic is insignificant and each of the information criteria is minimized with three lags. 10
Table B1. Lag selection statistics
Lag Number 0 1 2 3 4
Log L
LR
p
FPE
AIC
HQIC
SBIC
-517.33 -422.43 -411.45 -401.39 -399.76
189.81 21.95 20.13 3.27
0.00 0.00 0.00 0.51
111.15 18.04 15.70 13.91 14.59
4.67 2.85 2.71 2.59 2.64
4.67 2.90 2.80 2.72 2.81
4.67 2.96 2.92 2.91 3.06
n = 100 (quarter 1 in 1981 through quarter 4 in 2005)
10
This result is somewhat sensitive to the maximum number of lags chosen, but in general three lags seems most appropriate.
33
References Achen, Christopher. 1992. “Social psychology, demographic variables, and linear regression: breaking the iron triangle in voting research.” Political Behavior 14:195-211. Aldrich, John. 1995. Why Parties? Chicago: University of Chicago Press. Bartels, Larry. 2002. “Beyond the Running Tally: Partisan Bias in Political Perceptions.” Political Behavior 24:117-150. Campbell, Angus, Philip Converse, Warren Miller and Donald Stokes. 1960. The American Voter. Chicago: University of Chicago Press. Chanley, Virignia, Thomas Rudolph, and Wendy Rahn. 2000. “The Origins and Consequences of Public Trust in Government.” Public Opinion Quarterly 64:239-256. Conover, Pamela Johnston and Stanley Feldman. 1989. “Candidate Perception in an Ambiguous World: Campaigns, Cues, and Inference Processes.” American Journal of Political Science 33:912-940. Cox, Gary and Mathew McCubbins 1993. Legislative Leviathan. Berkeley: University of California Press. Cox, Gary and Mathew McCubbins. 2005. Setting the Agenda. Downs, Anthony. 1957. An Economic Theory of Democracy. New York: HarperCollins. Durr, Robert H., John B. Gilmour, and Christina Wolbrecht. 1997. “Explaining Congressional Approval.” American Journal of Political Science. 41:175-207. Erikson, Robert, Michael Mackuen, and James Stimson. 1998. “What Moves Macropartisanship? A Response to Green, Palmquist, and Schickler.” American Political Science Review 92:901-912. Fiorina, Morris. 1981. Retrospective Voting in American National Elections. New Haven: Yale University Press. Gerber, Alan and Donald Green. 1998. “Rational Learning and Partisan Attitudes.” American Journal of Political Science 42:794-818. Gomez, Brad T. and J. Matthew Wilson. 2001. “Political Sophistication and Economic Voting in the American Electorate: A Theory of Heterogeneous Attribution.” American Journal of Political Science 45: 899-914.
34
Green, Donald, Bradley Palmquist, and Eric Schickler. 1998. “Macropartisanship: A Republican and Critique” American Political Science Review 92: 883-899. Holian, David B. 2004. “He’s stealing my issues! Clinton’s crime rhetoric and the dynamics of issue ownership.” Political Behavior 26:95-124. Jones, David R. and Monika McDermott. 2004. “The Responsible Party Government Model in House and Senate Elections.” American Journal of Political Science 48:1-12. Key, V.O., Jr. 1966. The Responsible Electorate. New York: Vintage. Pope, Jeremy C. and Jonathan Woon. 2005. “The Dynamics of Party Reputation.” Paper presented at the annual meeting of the American Political Science Association, Washington, D.C. Rahn, Wendy. 1993. “The Role of Partisan Stereotypes in Information Processing about Political Candidates.” American Journal of Political Science 37: 472-496. Snyder, James M., Jr. and Michael M. Ting. 2001. “An Informational Rationale for Political Parties.” American Journal of Political Science. 46:90-110. Stimson, James. 1999. Public Opinion in America: Mood, Cycles, and Swings, 2nd ed
35