PACKET-BASED PSNR TIME SERIES PREDICTION FOR VIDEO TELECONFERENCING Liangping Ma� , Gregory Sternberg† �
†
InterDigital Communications, Inc., San Diego, CA 92121, USA InterDigital Communications, Inc., King of Prussia, PA 19406, USA ABSTRACT
It has been shown that various statistics of the peak signalto-noise ratio (PSNR) time series of a video sequence can be used to construct fairly accurate Quality of Experience (QoE) models. To predict QoE, it is sufficient to predict the PSNR time series. The possibility of predicting QoE further enables QoE-based network resource allocation. We propose two approaches to packet-based prediction of PSNR time series to overcome the limitations of frame-based approaches. The proposed first approach adopts a parametric model for the impact on the video quality due to losing a packet, while the second proposed approach is parameter-free. Simulation results show that both approaches significantly outperform the simple mean or median algorithms and are close to their respective performance bounds. Index Terms— QoE, video teleconferencing, prediction, PSNR, time series 1. INTRODUCTION Network resource allocation can significantly affect the video quality at the receiver. This is particularly true for video teleconferencing where packets are carried by the RTP/UDP protocols due to stringent latency requirements and can be dropped by the network in case of congestion. Ideally, the video quality should be assessed directly in terms of Quality of Experience (QoE). However, direct QoE assessment [1] can be done only after the video is decoded from successfully delivered video packets. Thus, to optimize the QoE, the network needs to know the resulting QoE before a resource allocation is made. That is, the network needs to predict QoE. It has been shown that statistics extracted from the perframe peak signal-to-noise ratio (PSNR) time series can be used to construct fairly accurate QoE models [2, 3]. The statistics include the minimum, maximum, median, 90’th percentile, 10’th percentile of the PSNR time series and the differential PSNR time series. Therefore, to predict QoE, it is sufficient to predict the PSNR time series. As pointed out in [4, 5], by predicting the PSNR time series and leveraging the work in [2, 3], QoE-based network resource allocation can be achieved in principle. Specifically, the network evaluates each hypothetical resource allocation decision that is feasible un-
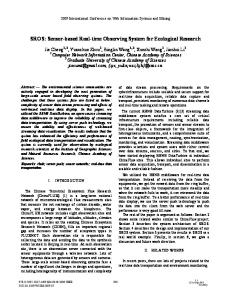
der network resource constraints, and selects the one resulting in the PSNR time series that corresponds to the best QoE. However, the PSNR prediction algorithm in [4, 5] is frame-based, and it considers only the effect of dropping whole video frames in the network. In practice, however, a frame may be mapped to multiple packets, especially for high bit-rate videos. For example, for the RaceHorse video [6] encoded in H.264/AVC using JVT JM16.2 [7] with resolution 832 × 480, quantization parameter (QP) 28 and frame rate 30 frames per second, on average a frame is mapped to 8.7 packets of size about 1400 bytes. To correctly use the frame-based algorithm, we need to impose the constraint that when a network drops a packet of a frame, it must drop all other packets of the same frame, which may make the resulting video quality unnecessarily poor. In addition, we observe that different video packets may have very different impact on the video quality, just as different P frames may have very different impact on the video quality as noted in [4, 5]. This disparity among packets presents an opportunity for the network to intelligently drop certain packets in the event of congestion in an effort to optimize the video quality. Thus, it is important to design packetbased PSNR time series prediction algorithms. The disparity among packets is shown in Fig. 1. The video is the aforementioned RaceHorse video. The error concealment scheme is frame copy. The target slice size is set to 1400 bytes to be consistent with the typical IP packet size. In the sequel, we use packet and slice interchangeably. Except for the last packet of each frame, the sizes of other packets are close to 1400 bytes (varying from 1349 bytes to 1405 bytes). Packets other than the last packet of each frame are dropped one at a time. In spite of almost identical packet sizes, the impact of losing a packet varies dramatically. The impact is measured by (a) the increase in the mean MSE and (b) the decrease in the mean PSNR of the subsequent 30 frames. We take two approaches to packet-based PSNR prediction and propose various algorithms. In the first approach, we assume a parametric model on the impact of losing a packet on the video quality, while in the second approach, we do not assume any parametric model. The algorithms generalize the frame-based algorithm in [4, 5], and are close to their respective performance bounds. The remainder of the paper is organized as follows. Sec-
300 200 100 0
100
200
300
400
500 600 Packet Number
700
800
900
1000
10
5
0
100
200
300
400
500 600 Packet Number
700
800
900
dˆc (l, P ) =
1000
Fig. 1. The impact of losing a packet on the subsequent 30 frames: (a) the increase in the mean MSE, and (b) the decrease in the mean PSNR (dB). tion 2 describes the system model, Section 3 presents the proposed packet-based PSNR prediction methods, Section 4 evaluates the performance, and Section 5 concludes the paper. 2. SYSTEM MODEL We denote the nth original video frame by a length-N vector F (n), and pixel i of F (n) by F (n, i). Let Fˆ (n) be the reconstructed frame corresponding to F (n) without frame losses, and let Fˆ (n, i) be pixel i of Fˆ (n). The source distortion (due to lossy video compression) of F (n), denoted as ds (n), is then N � ds (n) = (F (n, i) − Fˆ (n, i))2 /N, (1) i=1
which is readily available at the video encoder. Similarly, the channel distortion can be defined. Let the number of packets of frame F (n) be Mn , and the packets be G(1, n), . . . , G(Mn , n). We make the following assumptions based on previous works[8][9][10]: • Additivity: The total distortion is equal to the sum of the source distortion and the channel distortion. • Linearity: The distortion resulting from the loss of multiple packets is equal to the sum of the distortions resulting from individual packet losses. The additivity assumption is shown to be fairly accurate in [8]. The linearity assumption generalizes the linearity assumption from the frame-based case [9][10] to the packetbased case, which lends to a tractable analysis with reasonable accuracy especially for a small number of packet losses.
Mk l � �
(2)
I(j, k)h(j, k, l)
k=0 j=1
80 Channel Distortion Impulse Response
Decrease in Mean PSNR
Increase in Mean MSE
400
Let h(j, k, l) denote the channel distortion suffered by frame l ≥ k solely due to the loss of the jth packet of frame k and the error concealment scheme adopted by the video decoder. Much like the notion in [10], h(j, k, l) here can be considered as a channel distortion “impulse response”. Let the packet loss pattern be P := (I(1, l), I(2, l), ..., I(Ml , l), ..., I(1, 0), I(2, 0), ..., I(M0 , 0)), where I(j, k) with j = 1, 2, . . . , Mk and k = 0, 1, . . . , l is the indicator function, equal to 1 if the jth packet of frame k is dropped, and equal to 0 otherwise. Then, the linearity assumption states that the channel distortion of frame l due to packet loss pattern P is
Packet 1 Packet 2 Packet 3 Packet 4 Packet 5
70 60 50 40 30 20 10 0 0
5
10
15
20 25 30 Delay (in frames)
35
40
45
50
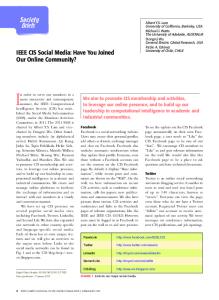
Fig. 2. The channel distortion impulse response for the first 5 packets of frame 4 with packet sizes 1392, 1403, 1395, 1382, 1404 bytes, respectively.
3. PROPOSED PREDICTION ALGORITHMS To understand the characteristics of the channel distortion impulse responses, we plot them for the first 5 packets of frame 4 of the Racehorse video in Fig. 2. We observe that for each impulse response, although the value fluctuates and may not even be monotonically decreasing with delay, it is likely to diminish toward a noise floor. In other words, those impulse responses roughly share a tendency or shape. We exploit this characteristic and propose two approaches, which give rise to various algorithms that significantly outperform the simple mean and median algorithms, as to be shown in Section 4. In the first approach, based on our knowledge of the video encoding structure and the error concealment scheme, we presume a particular shape for the impulse response with parameters to be determined, and then optimize the parameters according to the training data. This approach may be efficient in conveying the impulse responses to the network. We call this approach the shape-presumed approach. In the second approach, we do not assume a parametric model. Rather,
the feasible shapes under consideration are arbitrary, and this leads to much broader applicability. We call the second approach the shape-free approach. We generalize the architecture of the video sender proposed in [4, 5] to capture the one-to-many mapping from video frames to packets and to accommodate our proposed methods. The generalized architecture is shown in Fig. 3. The video packets of frame n are represented by G(1, n), . . . , G(Mn , n). The packets of frame n − m are dropped one at a time to simulate a hypothetical packet loss in the network, and to obtain the respective impulse responses, which are then fed to the optimization engine to estimate the common shape of the impulse responses. The source distortion ds (n) is for frame n, and can be annotated in one or more packets (for example for the purpose of robustness against high packet loss rates) of frame n. Note that, by this annotation, the impact of losing a packet on the frame to which the packet belongs is known rather than estimated, and it corresponds to the impulse response at delay 0 (see Fig. 2). Thus, to fully determine an impulse response, we only need to determine the shape, which we discuss next. Additionally, the training (shown in the dashed rectangle) can be run in real time because it uses only the current frame and the previous frames.
F(n)
Packets G(1, n), …, G(Mn, n) delayed by t1 sec Delay by t3
Video Encoder (delay by t1)
Delay by t1+t2
Video Decoder (delay t2) F(n) delayed by (t1 + t2) sec
+
Network
m delay units D
...
d0(1, n), …, d0(Mn, n) and shape parameters
D
Impulse response of packet 1 Optimization Engine
...
ds(n) delayed by (t1 + t2) sec
Annotation
Impulse response of packet Mn Channel Distortion Model
(delay by t3) Delay by t3-t2
Fig. 3. System architecture of the video sender.
3.1. Shape-presumed Prediction To determine the shape of the channel distortion impulse responses, we consider the IPPP video encoding structure with random macroblock intrarefresh, which is widely used in video teleconferencing, with frame copy as the error concealment scheme. We generalize the per-frame based impulse re-
sponse model in [4, 5] to a per-packet based one as follows ˆ k, l) = d0 (j, k) h(j,
e−α(k)(l−k) 1 + γ(k)(l − k)
(3)
where d0 (j, k) is the channel distortion on frame k that results from the loss of the jth packet of frame k, and α(k) and γ(k) are parameters dependent on frame k. With frame copy, when a slice is lost, the video decoder copies the region in the previous decoded video frame corresponding to the region represented by the lost slice. Hence the distortion due to the loss of the jth packet of frame k is d0 (j, k) =
N �
(Fˆ (k, i) − Fˆ (k − 1, i))2 /N,
(4)
i=1
In (3), d0 (j, k) can be fully determined at the video encoder and conveyed to the network. The other factor in (3) captures the roughly common trend in the decay of the impulse responses, and it is called the shape of the impulse reˆ l), i.e., sponses and is denoted as δ(k, ˆ l) = δ(k,
e−α(k)(l−k) , 1 + γ(k)(l − k)
(5)
where α(k) and γ(k) are called the shape parameters. We now determine the shape parameters. Due to the latency requirement of video teleconferencing, the video sender does not hold a video packet and wait for the subsequent video frames to arrive to experiment with a hypothetical loss and assess the impact on subsequent frames in order to determine the shape parameters. To reduce delay, the video sender instead stores packets of the previous frames and experiments with hypothetical losses, as shown in Fig. 3. Specifically, the video sender first hypothetically drops packet j of frame n − m, and measures d0 (j, n − m) and h(j, n − m, l), where j = 1, . . . , Mn−m and l = n − m, . . . , n. The video sender then calculates the shapes δ(j, n − m, l) = h(j, n − m, l)/d0 (j, n− m). These shapes may be combined to form a smoother shape δ(n−m, l), for example, by using the mean or �Mn−m δ(j, n−m, l)/Mn−m the median, i.e., δ(n−m, l) = j=1 or δ(n − m, l) = Median{δ(j, n − m, l)|j = 1, . . . , Mn−m }. Next, the optimization engine (see Fig. 3) in the video sender determines the shape parameters α∗ (n − m) and γ ∗ (n − m) by fitting the shape δ(n − m, l) with (5) using criteria such as least mean square error or least absolute error: (α∗ (n − m), γ ∗ (n − m)) =
arg min α(n−m),γ(n−m)
�ρ � n � � � e−α(n−m)(l−n+m) � , �δ(n − m, l) − � 1 + γ(n − m)(l − n + m) �
(6)
l=n−m
where ρ = 2 and ρ = 1 correspond to least mean square error and least absolute error, respectively.
Lastly, d0 (j, n), the shape parameters, and the source distortion ds (n) in (1) are annotated to the outgoing packet G(j, n), where j = 1, . . . , Mn . The network predicts the channel distortion impulse response for the jth packet of frame n according to ˆ ∗ (j, n, l) = d0 (j, n) h
∗
e−α (n−m)(l−n) , 1 + γ ∗ (n − m)(l − n)
(7)
where j = 1, . . . , Mn , l ≥ n. ˆ ∗ (j, n, l) in (7) for h(j, k, l) in (2), the netSubstituting h work obtains the channel distortion prediction for frame l ≥ n for a given packet loss pattern P , and then adds the source distortion to get the total distortion and hence the PSNR for frame l. 3.2. Shape-free Prediction In the shape-presumed prediction method, we rely on our knowledge of the particular video encoding structure and the error concealment scheme in building a model for the shape. When the video encoding structure and the error concealment scheme change, we need to change the model as well, which is not only inconvenient but also non-trivial. To overcome this limitation, we propose a shape-free method. The only assumption that we make is that the loss of a packet affects only the frame to which the lost packet belongs to and the subsequent frames until the next I frame, which is generally true for video teleconferencing as B frames are rarely used. We first generalize the model in (3) to the following ˆ k, l) = d0 (j, k)s(l − k), h(j,
(8)
where s(l−k) is the shape parameter of the impulse response. Note that we do not presume a certain structure for the shape. We then optimize s(l − k) as follows s∗ (l − k) = =
arg min
Mk �
s(l−k) j=1
|d0 (j, k)s(l − k) − h(j, k, l)|
ζ
�ζ � � h(j, k, l) �� � arg min d0 (j, k) �s(l − k) − d0 (j, k) � s(l−k) j=1 Mk �
(9) where typical values for ζ are 2 and 1. The optimization in (9) is rooted in maximum-likelihood location estimation: ζ = 2 is for independent but not identically distributed Gaussian samples and ζ = 1 for independent but not identically distributed Laplacian samples [11], where the samples are h(j, k, l)/d0 (j, k). The solution s∗ (l − k) is a weighted sum for ζ = 2 and a weighted median for ζ = 1 [11]. Realizing this can lead to efficient computation. Specifically, for ζ = 2, s∗ (l − k) =
Mk � j=1
d0 (j, k)h(j, k, l)/
Mk � j=1
d20 (j, k)
(10)
and for ζ = 1, � h(1, k, l) ,..., s∗ (l − k) = Median d0 (1, k) � d0 (1, k) � h(Mk , k, l) d0 (Mk , k) � , d0 (Mk , k)
(11)
where d0 (j, k), j = 1, . . . , Mk , are the weights and � is the duplication operator. For positive integer-valued weights, the duplication operator simply duplicates each sample multiple times equal to the corresponding weight, and the weighted median is the median of the expanded sample set. For example, Median{2 � 5, 3 � 7} = Median{5, 5, 7, 7, 7} = 7. For the more general positive real-valued weights, the weighted median can be calculated by following the procedure in [11]: 1) sort h(1, k, l)/d0 (1, k), . . . , h(Mk , k, l)/d0 (Mk , k) in as�Mk d0 (j, k)/2; cending order; 2) calculate a threshold T = j=1 3) sum the weights of the samples starting with the maximum and continuing in descending order; 4) the weighted median is the sample whose weight causes the sum to cross the threshold T . The predicted channel distortion impulse response for the jth packet of frame k is then ˆ ∗ (j, k, l) = d0 (j, k)s∗ (l − k), h
(12)
The remaining steps for predicting the per-frame PSNR time series are the same as in the shape-presumed method and are omitted here for brevity.
3.3. Performance Bounds A good way to assess the performance of a PSNR time series prediction algorithm is to see how well it performs compared to a performance bound. One of the performance bounds is the prediction error that we would have achieved if we had applied the training process on the video frames to be predicted. Note that this is in contrast with the normal operation of a prediction algorithm where the training process is applied to the previous video frames. This way, we can calculate a performance bound – a lower bound on the prediction error – for each prediction algorithm.
4. PERFORMANCE EVALUATION For the baseline of performance evaluation, we consider the simple mean (or median) impulse response and plug them into a presumed shape model. This is a non-trivial generalization of the algorithm in [4, 5]. Specifically, we calcu�Mn−m d0 (j, n − late per-frame statistics d0 (n − m) = j=1 �Mn−m m)/Mn−m and h(n−m, l) = j=1 h(j, n−m, l)/Mn−m
(or Median{h(j, n− m, l)|j = 1, . . . , Mn−m }), and then find arg min
n �
0.8
α(n−m),γ(n−m) l=n−m
0.6
� �ρ � � e−α(n−m)(l−n+m) �h(n − m, l) − d0 (n − m) � , (13) � 1 + γ(n − m)(l − n + m) �
CDF
(α† (n − m), γ † (n − m)) =
1
0.4
0.2
where ρ = 1 or 2, and predict the impulse responses by
0 0
1
2 3 4 5 Per−frame PSNR Prediction Error (dB)
6
7
†
e−α (n−m)(l−n) , 1 + γ † (n − m)(l − n)
(14)
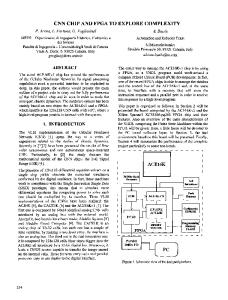
where j = 1, . . . , Mn and l ≥ n. We assume that the network has packets from frames F (n), . . . , F (n − L) at its disposal. That is, packets from L + 1 frames are in the queue. As in [4, 5], we define the prediction length λ as the number of frames to be predicted. That is, if a packet of frame u ≤ n is to be dropped, then the predictor predicts the impact on frames u through u + λ. During the prediction, the source distortion for frames v ≥ n + 1 is not available to the network and is estimated as dˆs (v) = ds (n). The performance metric used is the prediction error, defined as the absolute value of the difference between the actual per-frame PSNR and the predicted value, both in dB. We look at its cumulative distribution function (CDF) and mean. In the simulation, we let ρ = 1 in (6) and (13). For the baseline with h(n − m, l) in (13) calculated by the mean, we label it as mean impulse response. For the shape-presumed prediction algorithm with δ(n − m, l) calculated by the mean, we label it as mean shape. For the shape-free prediction algorithm with ζ = 2 in (9), we label it as weighted sum. Similarly, we label the median-related configurations of the algorithms as median impulse response, median shape, and weighted median, respectively. Figure 4 shows the performance for the baseline (mean impulse response), shape-presumed (mean shape), and shapefree (weighted sum) algorithms for the case m = 5, λ = 5, L = 5. Compared to the baseline algorithm, our proposed shape-presumed and shape-free algorithms result in reductions of 48.4% and 45.7% in the mean prediction error, respectively. Figure 5 shows the performance for the baseline (median impulse response), shape-presumed (median shape), and shape-free (weighted median). Again, our proposed shapepresumed and shape-free algorithms have significant performance gains. Also, we note that using the median leads to more accurate prediction results, suggesting that the actual distributions of the impulse responses are closer to Laplacian than Gaussian. To better understand the performance of the proposed algorithms, we compare it with performance bounds. Figure 6 does the comparison for the shape-presumed (median shape) algorithm. The prediction error is only 13.2% greater than the lower bound, indicating high prediction accuracy.
Fig. 4. Prediction errors for the baseline (mean impulse response), shape-presumed (mean shape) and shape-free (weighted sum) algorithms for λ = 5, m = 5, L = 5. 1
0.8
0.6 CDF
ˆ † (j, n, l) = d0 (n − m) h
Mean impulse response, mean prediction error=0.9876 dB Mean shape, mean prediction error = 0.5096 dB Weighted sum, mean prediction error =0.5360 dB
0.4
0.2
0 0
Median impulse response, mean prediction error = 0.9306dB Median shape, mean prediction error = 0.4933dB Weighted median, mean prediction error = 0.4978dB 0.5
1
1.5
2
2.5
3
3.5
4
4.5
5
Per−frame PSNR Prediction Error (dB)
Fig. 5. Prediction errors for the baseline (median impulse response), shape-presumed (median shape) and shape-free (weighted median) algorithms for λ = 5, m = 5, L = 5. Similarly, Figure 7 does the comparison for the shape-free (weighted median) algorithm, the prediction error of which is only 10.3% greater than the corresponding lower bound, indicating even higher prediction accuracy. As another example, we show the performance results for a more challenging case with m = 20, λ = 15, L = 5 in Fig. 8. This case represents prediction of 0.5 second into the future, as the frame rate is 30 frames per second. The performance gains of the proposed shape-presumed algorithm and the shape-free algorithm are 29.0% and 26.3% respectively, relative to the baseline algorithm. 5. CONCLUSION We propose two approaches to packet-based PSNR time series prediction to enable QoE-based network resource allocation for high bit-rate video teleconferencing. The first approach relies on parametric model on the impact of dropping a packet on the video quality, while the second one is parameter-free. Simulation results show that algorithms out of these two approaches achieve very good performance, when compared to the baseline algorithms (simple mean or
1
0.8
0.8
0.6
0.6 CDF
CDF
1
0.4
0.4
0.2
0 0
0.5
1
1.5 2 2.5 3 3.5 Per−frame PSNR Prediction Error (dB)
4
4.5
Median impulse response, mean prediction error = 1.1594dB Median shape, mean prediction error = 0.8234dB Weighted median, mean prediction error = 0.8542dB Lower bound on weighted median, mean prediction error = 0.70896dB
0.2
Median shape, mean prediction error = 0.4933dB Lower bound on median shape, mean prediction error = 0.4474dB 5
Fig. 6. Prediction errors for the shape-presumed (median shape) algorithm and the corresponding lower bound for λ = 5, m = 5, L = 5.
0 0
2
4 6 8 Per−frame PSNR Prediction Error (dB)
10
12
Fig. 8. Prediction errors for the baseline (median impulse response), presumed-shape (median shape), shape-free (weighted median) algorithms and a lower bound for λ = 20, m = 15, L = 5.
1
0.8
A. Zeira, “Model-based QoE prediction to enable better user experience for video teleconferencing,” in IEEE International Conference on Acoustics, Speech, and Signal Processing (ICASSP), May 2013.
CDF
0.6
0.4
0.2 Weighted median, mean prediction error = 0.4978dB Lower bound on weighted median, mean prediction error = 0.4399dB 0 0
0.5
1
1.5 2 2.5 3 3.5 Per−frame PSNR Prediction Error (dB)
4
4.5
5
[5] L. Ma, Y. A. Reznik, R. Vanam, and G. Sternberg, “Enabling QoE-based scheduling for video teleconferencing via PSNR time series prediction,” in Proceedings of SPIE, San Diego, Sep. 2013, vol. 8856.
Fig. 7. Prediction errors for the shape-free (weighted median) algorithm and the corresponding lower bound for λ = 5, m = 5, L = 5.
[6] Y. Wang, “Analysis application for h.264 video encoding,” Tech. Rep. IT 10 061, Uppsala University, Sweden, 2010.
simple median) and the performance bounds.
[7] ITU, “H.264/AVC reference software,” Online, Oct 2012, iphome.hhi.de/suehring/tml/download/.
Acknowledgement The authors would like to thank Dr. Ariela Zeira and Dr. Robert A. DiFazio of InterDigital Labs for their insightful suggestions. 6. REFERENCES
[8] Z. He, J. Cai, and C. W. Chen, “Joint source channel rate-distortion analysis for adaptive mode selection and rate control in wireless video coding,” IEEE Trans. Circuits and Systems for Video Technology, vol. 12, no. 6, pp. 511–523, June 2002.
[1] Subjective Video Quality Assessment Methods for Multimedia Applications, ITU-T Recommendation-P.910, Sep. 1999.
[9] K. Stuhlmuller, N. Farber, M. Link, and B. Girod, “Analysis of video transmission over lossy channels,” IEEE Journal on Selected Areas in Communications, vol. 18, no. 6, pp. 1012–1032, June 2000.
[2] C. Keimel, T. Oelbaum, and K. Diepold, “Improving the prediction accuracy of video quality metrics,” in IEEE International Conference on Acoustics, Speech, and Signal Processing (ICASSP), Dallas, Texas, March 2010, pp. 2442–2445.
[10] U. Dani, Z. He, and H. Xiong, “Transmission distortion modeling for wireless video communication,” in IEEE Global Telecommunications Conference (GLOBECOM), Dec 2005.
[3] C. Keimel, M. Rothbucher, H. Shen, and K. Diepold, “Video is a cube: Multidimensional analysis and video quality metrics,” IEEE Signal Processing Magzine, pp. 41–49, Nov. 2011. [4] L. Ma, T. Xu, G. Sternberg, A. Balasubramanian, and
[11] L. Yin, R. Yang, M. Gabbouj, and Y. Neuvo, “Weighted median filters: A tutorial,” IEEE Trans. Circuits and Systems-II: Analog and Digital Signal Processing, vol. 43, no. 3, pp. 157–192, Mar. 1996.