RESULTS UPDATE
Singapore
OUE Hospitality Trust
Monday, 24 October 2011
(OUEHT SP; OUER.SI )
BUY - Upgrade Pri ce a s of 13 Nov 2015
0.800
12M ta rget pri ce (S$)
0.830
Previ ous ta rget pri ce (S$)
0.795
Ups i de, i ncl di v (%)
11.6
Trading data Ma rket Ca p (S$m)
1,068.3
Is s ued Sha res (m)
1,335.4
Ave Da i l y Tra ded (3-Month) Vol / Va l
0.8m / $0.6m
52 week l o / hi
$0.74 / $0.99
Free Fl oa t
55.8%
Major Shareholders OUE Rea l ty Pte Ltd
41.3%
Gol den Concord As i a Ltd
1.5%
Previous Recommendations Date
Rating
9-Jun-15
(S$)
HOLD
0.930
0.930
7-May-15
HOLD
0.970
0.990
9-Feb-15
BUY
0.935
1.040
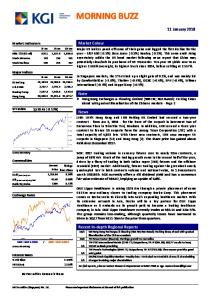
12-Mth OUEHT SP (Blue) vs. FSSTI
0.65
Source: Bloomberg
Hong Wei WONG
[email protected] +65 6236 2850
Oct-15
0.75
2,650
Jul-15
0.85
2,850 Apr-15
0.95
3,050
Jan-15
1.05
3,250
Oct-14
1.15
3,450
Jul-14
3,650
Apr-14
Stronger than expected performance. OUE Hospitality Trust (OUEHT) declared 1.72 S cts DPU for 3Q15, ahead of 3Q14 (1.64 S cts) and 2Q15 (1.52 S cts). This was driven by higher revenues of S$32.7m (10.4% higher QoQ) and higher NPI of S$28.8m (11.6% higher QoQ), mainly due to stronger performance at Mandarin Orchard Singapore (MOS). At FY16F 7.8% yield, OUEHT begins to look interesting if the performance can be sustained. Reversing the RevPAR freefall. After 2 quarters of disappointment, OUEHT came out ahead of our expectations as MOS reported a higher YoY RevPAR of $243 (3Q14: $241). The results are bolstered by OUEHT’s efforts in targeting the leisure travel and group business. MOS holds the advantage with its size (1077 rooms), which allows the flexibility to attract large businesses. In addition, MOS differentiates itself with its good location (Orchard) and competitive rates. Better CPCA performance. Crowne Plaza Changi Airport (CPCA) performed better QoQ, with NPI increasing to S$3.4m (2Q15: S$3.1m). Contribution may continue to increase as the acquisition of the extension to CPCA is expected to be completed next year.
Share Price Target Price (S$)
Jan-14
A decent showing
Stable performance at Mandarin Gallery. Mandarin Gallery (MG) rents increased to S$25 psf pm (3Q14: $23.9). Yet, occupancy dipped to 98% due to the large number of lease expiries, with 21% leases by gross rent expiring by end-2015. However, we are not overly concerned as performance at MG has been good. Some near-term volatility is expected as tenants take time to renew and new tenants require fit out periods. Upgrade to BUY with stabilization of performance. We upgrade OUEHT to BUY, given the high FY16F dividend yield of 7.8%. We increased our TP to S$0.83 after decreasing our cost of equity by 33bp to 8%. This partially reverses the 50bp increase we made in 2Q as the stabilization in RevPAR alleviates our concerns on the freefall in 1Q15-2Q15 performance. While we maintain the view that a potential equity raising is in the cards to acquire the extension of CPCA, the correction in share price offers an entry point into the stock. We see upside risks as we already accounted for a weak hospitality outlook, if MOS can maintain its 3Q15 RevPAR performance. Financials & Key Operating Statistics YE Dec (S$ m) Revenue Net Property Income Distributable Income DPU (cents) Dividend growth (%) Div Yield (%) Net asset Borrowings BVPS (Scts) NPI Margin (%) Gearing (%) Price / Book (x)
2013* 50.6 44.8 38.2 2.9 N/A n.m. 1.2 0.6 0.9 88.6 31.7 0.9
So urce: Co mpany Data, KGI Fraser *Fro m IP O (25 Jul 2013)
Please see important disclosures at the end of this publication
2014 115.9 103.2 89.0 6.7 n.m. 8.4 1.2 0.6 0.9 89.0 32.5 0.9
2015F 123.6 108.2 86.7 6.5 -3.1 8.1 1.2 0.6 0.9 87.6 28.2 0.9
2016F 138.2 120.1 92.5 6.3 -4.3 7.8 1.3 1.0 0.9 86.9 42.8 0.9
2017F 141.3 122.8 93.7 6.3 0.4 7.8 1.3 1.0 0.9 86.9 42.7 0.9
Singapore
OUE Hospitality Trust
Figure 1: Results comparison FYE Sep (SGD m)
3Q15
3Q14
YoY % chg
2Q15
QoQ % chg
Comments
Revenue Property operating expenses
32.7 3.9
28.5 3.2
14.6 23.7
29.6 3.8
10.4 2.1
Stronger than expected due to MOS In-line
Net Property Income
28.8
25.4
13.5
25.8
11.6
Stronger than expected due to MOS
NPI Margin (%)
88.1
88.9
-0.9
87.1
1.0
Lower than expected due to MO
Management and trustee fees
2.8
2.5
15.4
2.7
5.1
In-line
Net interest expense
5.7
3.4
67.5
5.7
0.1
In-line
Net profit
19.9
19.1
4.2
17.1
16.7
Lower than expected due to MO
Distributable Income
23.0
21.7
5.8
20.2
13.9
Lower than expected due to MO
DPU (cents)
1.72
1.64
4.9
1.52
13.2
Lower than expected due to MO
Source: Company data, KGI Fraser
Figure 2: Dividend discount model DDM (SGD cents)
2016F
DPU Terminal value/unit PV/unit
2017F
2018F
2019F
6.25
6.27
6.17
6.08
5.79
5.38
4.90
4.47
2020F 6.18 85.92 62.70
Model Parameter Risk free rate Beta Market risk premium
3.10% 0.890 5.50%
Cost of equity
8.00%
Terminal distribution growth rate
0.75%
Target price, S$
0.830
Source: KGI Fraser
November 13, 2015
2 $ 222
Singapore
OUE Hospitality Trust
Summary of Financials YE 31 Dec INCOME STATEMENT (S$ 000) Gross Rental Income Other operating income Gross Revenue Property operating expenses Net Property Income Finance costs Manager's management fees Trustee's fees Interest income Other trust expenses Net Income before tax and fair value changes Fair value changes Net Income before tax Income tax expense Net Income after tax Net adjustments Income available for distribution BALANCE SHEET (S$ 000) Cash and cash equivalents Trade and other receivables Other current assets Current Assets Investment properties Other non-current assets Non-current Assets Total assets Financial derivative liabilities (Current) Rental deposits (Current) Trade and other payables Current Liabilities Financial derivative liabilities (Non-Current) Rental deposits (Non-Current) Borrowings (Non-current) Non-current liabilities Total liabilities Net Asset CASH FLOW STATEMENT (S$ 000) Net income before tax Finance costs Interest income Management fees paid in Units Fair value changes Change in working capital Change in other current assets Cash flows from operating activities Cash flows from investing activities Net proceeds from issuance of Units Net proceeds from borrowings Net interest paid Payment of distribution to Unitholders Change in other financing activities Cash generated from financing activities Net increase in cash & cash equivalents Beginning Cash Ending Cash
November 13, 2015
2013
2014
2015F
2016F
2017F
50,612 0 50,612 (5,791) 44,821 (10,554) (4,198) (121) 458 (867) 29,539 50,923 80,462 0 80,462 (42,276) 38,188
115,889 0 115,889 (12,723) 103,166 (14,721) (9,536) (304) 1,345 (1,235) 78,715 (147) 78,568 0 78,568 10,417 88,985
123,575 0 123,575 (15,351) 108,225 (23,001) (10,601) (214) 1,374 (1,168) 74,613 0 74,613 0 74,613 12,111 86,724
138,190 0 138,190 (18,062) 120,128 (29,225) (11,534) 336 936 (1,040) 79,601 0 79,601 0 79,601 12,878 92,479
141,281 0 141,281 (18,462) 122,819 (30,698) (11,800) 344 967 (1,051) 80,582 3 80,585 0 80,585 13,135 93,720
2013
2014
2015F
2016F
2017F
60,829 17,382 0 78,211 1,756,000 0 1,756,000 1,834,211 0 1,082 8,106 9,188 5,728 26,238 581,431 613,397 622,585 1,211,626
31,299 9,271 0 40,570 1,756,000 0 1,756,000 1,796,570 155 2,323 7,186 9,664 2,027 3,331 583,111 588,469 598,133 1,198,437
28,508 9,841 0 38,349 2,049,880 0 2,049,880 2,088,229 292,146 3,010 7,833 302,989 3,128 3,128 589,854 596,110 899,099 1,189,130
30,444 10,757 0 41,201 2,254,880 0 2,254,880 2,296,081 0 3,429 8,120 11,550 3,128 3,128 982,000 988,256 999,806 1,296,276
31,646 10,905 0 42,550 2,254,880 0 2,254,880 2,297,430 0 3,497 8,296 11,794 3,128 3,128 982,000 988,256 1,000,050 1,297,380
2013 2013
2014 2014
2015F 2015F
2016F 2016F
2017F 2017F
80,462 10,107 (11) 4,198 (50,923) (13,178) 22,568 53,223 (1,148,526) 600,000 587,000 (2,982) 0 (27,886) 1,156,132 60,829 0 60,829
78,568 14,721 (1,345) 9,536 147 7,911 (21,666) 87,872 (122) 0 0 (13,041) (103,502) (717) (117,260) (29,510) 60,829 31,299
74,613 23,001 (1,374) 10,601 0 (2,919) 483 104,406 (291,668) 0 295,000 (19,186) (88,219) 0 187,595 333 31,299 28,508
79,601 29,225 (936) 11,534 0 (628) 419 119,215 (205,000) 105,000 100,000 (26,414) (90,864) 0 87,722 1,936 28,508 30,444
80,585 30,698 (967) 11,800 (3) 29 68 122,209 0 0 0 (27,887) (93,123) 0 (121,010) 1,199 30,444 31,646
3 $ 333
Singapore
OUE Hospitality Trust
Appendix: SREIT Peer Comparison Last Price
Market Cap
(S$)
(S$ m)
Office
Distribution Frequency
Cons/AMF DPU (cents)
Yield (%)
Current Current Next FY Next FY FY FY
S$13,100
Leverage ratio (%)
Price-tobook (x)
6.9
6.9
30.7
0.74
CapitaLand Commercial Trust Ltd
1.300
3,839
Semi-Anl
8.7
9.0
6.7
6.9
19.0
0.75
Frasers Commercial Trust
1.310
1,029
Quarter
9.9
9.9
7.6
7.6
36.8
0.84
Keppel REIT
0.930
2,989
Quarter
7.0
6.7
7.5
7.2
36.4
0.67
Suntec Real Estate Investment Trust OUE Commercial Real Estate Investment Trust
1.570
3,958
Quarter
9.9
10.1
6.3
6.4
34.7
0.75
0.685
879
Semi-Anl
4.8
5.0
7.0
7.3
37.7
NM
IREIT Global
0.665
406
Semi-Anl
NM
NM
NM
NM
NM
NM
Retail
6.5
6.8
32.1
0.95
CapitaLand Retail China Trust
1.455
S$19,817 1,225
Semi-Anl
10.9
10.9
7.5
7.5
28.5
0.85
CapitaLand Mall Trust
1.880
6,657
Quarter
11.0
11.7
5.9
6.2
32.1
1.02
Frasers Centrepoint Trust
1.890
1,734
Quarter
11.5
11.5
6.1
6.1
28.2
0.99
Lippo Malls Indonesia Retail Trust
0.315
880
Quarter
3.0
3.1
9.5
9.8
31.0
0.80
Mapletree Commercial Trust
1.290
2,734
Quarter
8.1
8.3
6.3
6.4
36.3
1.04
Mapletree Greater China Commercial Trust 0.940 SPH REIT 0.925
2,575 2,344
Semi-Anl Quarter
7.2 5.6
7.4 5.7
7.7 6.1
7.9 6.2
36.2 25.5
0.79 0.98
Starhill Global REIT
1,669
Quarter
5.3
5.6
6.9
7.3
35.4
0.85
0.765
Healthcare
6.2
6.0
34.1
1.27
First Real Estate Investment Trust
1.165
S$2,263 871
Quarter
8.3
8.3
7.2
7.1
32.7
1.14
Parkway Life Real Estate Investment Trust
2.300
1,392
Quarter
12.8
12.2
5.6
5.3
35.0
1.36
Hospitality
7.8
7.9
34.2
0.82
Ascott Residence Trust
1.200
S$6,017 1,858
Semi-Anl
8.5
8.9
7.1
7.4
37.6
0.87
Ascendas Hospitality Trust OUE Hospitality Trust
0.615 0.800
687 1,068
Semi-Anl Quarter
5.6 6.5
5.7 6.3
9.1 8.2
9.3 7.8
37.5 32.5
0.87 0.89
Far East Hospitality Trust
0.620
1,109
Quarter
4.8
4.6
7.7
7.4
31.3
0.64
CDL Hospitality Trusts
1.310
1,293
Semi-Anl
10.4
10.9
7.9
8.3
31.6
0.82
Industrial
7.5
7.8
33.4
1.01
AIMS AMP Capital Industrial REIT
1.325
S$15,611 841
Quarter
12.0
12.0
9.1
9.1
31.1
0.87
Ascendas Real Estate Investment Trust
2.200
5,297
Semi-Anl
15.5
16.2
7.0
7.4
33.4
1.05
Cache Logistics Trust
0.935
834
Quarter
8.4
9.0
9.0
9.6
30.7
0.96
Cambridge Industrial Trust Mapletree Industrial Trust Mapletree Logistics Trust
0.610 1.515 0.995
788 2,683 2,466
Quarter Quarter Quarter
4.9 10.9 7.6
5.0 11.0 7.8
8.0 7.2 7.6
8.2 7.3 7.8
34.4 30.6 34.1
0.90 1.14 0.98
Sabana Shari'ah Compliant Industrial Real Estate Investment Trust Soilbuild Business Space REIT Keppel DC REIT
0.715 0.775 1.050
524 724 927
Quarter Quarter Irreg
7.3 6.3 6.1
7.1 6.5 6.8
10.2 8.1 5.8
9.9 8.4 6.5
37.4 35.0 NM
0.68 0.97 NM
Viva Industrial Trust
0.745
527
Quarter
N.A
N.A
N.A
N.A
43.7
1.0
5.2
5.2
35.3
0.95
Semi-Anl
5.6
5.7
5.2
5.2
35.3
0.95
6.9
7.0
31.7
0.88
Residential Saizen REIT 32 S-REITs MASB10Y Index
November 13, 2015
S$311 1.085
311 S$57,119
Monetary Authority of Singapore
2.6 Source: Bloomberg LLP, KGI Fraser
4 $ 444
OUE Hospitality Trust
KGI’s Ratings
Disclaimer
Singapore
Rating
Definition KGI Fraser Research’s recommendations are based on an Absolute Return rating system.
BUY
>10% total return over the next 12 months
HOLD
-10% to +10% total return over the next 12 months
SELL
<-10% total return over the next 12 months
This report is provided for information only and is not an offer or a solicitation to deal in securities or to enter into any legal relations, nor an advice or a recommendation with respect to such securities. This report is prepared for general circulation. It does not have regard to the specific investment objectives, financial situation and the particular needs of any recipient hereof. You should independently evaluate particular investments and consult an independent financial adviser before dealing in any securities mentioned in this report. This report is confidential. This report may not be published, circulated, reproduced or distributed and/or redistributed in whole or in part by any recipient of this report to any other person without the prior written consent of KGI Fraser. This report is not intended for distribution and/or redistribution, publication to or use by any person in any jurisdiction outside Singapore or any other jurisdiction as KGI Fraser may determine in its absolute discretion, where the distribution, publication or use of this report would be contrary to applicable law or would subject KGI Fraser and its connected persons (as defined in the Financial Advisers Act, Chapter 110 of Singapore) to any registration, licensing or other requirements within such jurisdiction. The information or views in the report (“Information”) has been obtained or derived from sources believed by KGI Fraser to be reliable. However, KGI Fraser makes no representation as to the accuracy or completeness of such sources or the Information and KGI Fraser accepts no liability whatsoever for any loss or damage arising from the use of or reliance on the Information. KGI Fraser and its connected persons may have issued other reports expressing views different from the Information and all views expressed in all reports of KGI Fraser and its connected persons are subject to change without notice. KGI Fraser reserves the right to act upon or use the Information at any time, including before its publication herein. Except as otherwise indicated below, (1) KGI Fraser, its connected persons and its officers, employees and representatives may, to the extent permitted by law, transact with, perform or provide broking, underwriting, corporate finance-related or other services for or solicit business from, the subject corporation(s) referred to in this report; (2) KGI Fraser, its connected persons and its officers, employees and representatives may also, to the extent permitted by law, transact with, perform or provide broking or other services for or solicit business from, other persons in respect of dealings in the securities referred to in this report or other investments related thereto; and (3) the officers, employees and representatives of KGI Fraser may also serve on the board of directors or in trustee positions with the subject corporation(s) referred to in this report. (All of the foregoing is hereafter referred to as the “Subject Business”.) However, as of the date of this report, neither KGI Fraser nor its representative(s) who produced this report (each a “research analyst”), has any proprietary position or material interest in, and KGI Fraser does not make any market in, the securities which are recommended in this report. Each research analyst of KGI Fraser who produced this report hereby certifies that (1) the views expressed in this report accurately reflect his/her personal views about all of the subject corporation(s) and securities in this report; (2) the report was produced independently by him/her; (3) he/she does not carry out, whether for himself/herself or on behalf of KGI Fraser or any other person, any of the Subject Business involving any of the subject corporation(s) or securities referred to in this report; and (4) he/she has not received and will not receive any compensation that is directly or indirectly related or linked to the recommendations or views expressed in this report or to any sales, trading, dealing or corporate finance advisory services or transaction in respect of the securities in this report. However, the compensation received by each such research analyst is based upon various factors, including KGI Fraser’s total revenues, a portion of which are generated from KGI Fraser’s business of dealing in securities. Copyright 2015. KGI Fraser Securities Pte. Ltd. All rights reserved.
November 13, 2015
$