J. CETACEAN RES. MANAGE. 8(3):273–281, 2006
273
Evaluating the use of whalewatch data in determining killer whale (Orcinus orca) distribution patterns DONNA D.W. HAUSER+, GLENN R. VANBLARICOM+, ELIZABETH E. HOLMES* AND RICHARD W. OSBORNE# Contact e-mail:
[email protected] ABSTRACT Commercial whalewatching has been used as an opportunistic data source for studies of cetacean distribution, but there are few comprehensive analyses of the biases and assumptions implicit in such methodology. The goal of this study was to evaluate the use of data generated by commercial whalewatch operators using a case study of whalewatchers targeting killer whales (Orcinus orca) within Washington and British Columbia inshore waters. In this region, many whalewatch vessels work cooperatively in a small, semi-enclosed area to locate and identify well-known killer whales. To address search biases and cross-examine the accuracy in killer whale locations and pod identifications by whalewatchers, an independent field study was conducted. The whalewatch data were 91.7% accurate in locating killer whales, but only 74.1% of those sightings were correctly identified to the pod level. However, identification accuracy increased to 92.6% when errors due to sub-pod mis-identification were excluded and 96.3% when early morning (before 10:30), unknown pod sightings were also excluded. It is suggested that these data can be used to describe spatial use patterns by killer whales, with recognition of the dataset’s limitations. Results of this study indicate that examination of biases is necessary before initiating research using data generated by commercial whalewatchers, but such data sources can be effective for specific study questions if the limitations are known. Although the whalewatch situation described here is relatively unique because it targets a small, well-known population, this study presents a practical methodology for evaluating the efficiency of whalewatch vessels in detecting and identifying cetaceans. Globally, whalewatching industries are increasing in numbers and geographic scope, and capitalising on these platforms of opportunity represents potentially valuable and accurate data for studies of cetacean distribution. KEYWORDS: WHALEWATCHING; KILLER WHALES; NORTH AMERICA; MONITORING; DISTRIBUTION; SAMPLING STRATEGY; PACIFIC OCEAN; NORTHERN HEMISPHERE; SURVEY-SHORE BASED
INTRODUCTION Assessing distributions of highly mobile, wide ranging marine mammals presents a challenge to marine ecologists. Depending on the species or population of interest and available resources, there are a number of possible assessment methods. Standardised line-transect aerial or vessel surveys are commonly used to determine distributions of cetaceans (e.g. Baumgartner et al., 2003; Drouot et al., 2004; Elwen and Best, 2004; Griffin, 1999; Zerbini et al., 2004), but such methods may not be feasible for all populations due to budgetary constraints or other restrictions. Opportunistic information, such as historical stranding or whaling catch and sighting information, have been used to illustrate seasonal patterns in distribution (e.g. Clapham et al., 2004; Dalebout et al., 2003; Gregr and Trites, 2001; Jaquet et al., 1996; Maldini et al., 2005). Similarly, sightings data from platforms of opportunity, such as whalewatch vessels, have provided broad-scale information on distribution, without expensive survey effort (e.g. Darling et al., 1998; Weinrich et al., 2000). However, caution must be applied when using data collected from platforms of opportunity. Specifically, Evans and Hammond (2004) have argued that to generate useful data, observers must provide correct species identification and sighting biases must be limited in space and time. Potential biases in data collected from platforms of opportunity will be minimised with more observers and broad spatial coverage. Rapidly developing industries for commercial whalewatching, often with highly localised spatial and temporal effort, present a chance to test the applicability of data opportunistically collected by whalewatchers for studies of cetacean distribution. +
Within the semi-enclosed marine waters of Washington and British Columbia (BC), an extensive whalewatching industry has developed for killer whales (Orcinus orca). Whalewatchers have established a centralised method for locating whales on a daily basis that is available to any subscriber, between mid-May and October each year. In 2004, fifty American and Canadian whalewatch companies were estimated to operate 91 vessels on a frequent basis in the region (K. Koski, pers. comm.). Centralised observers from these companies have accumulated location data for killer whales across several years, creating prospects for distribution analyses. The killer whales in this region have been researched intensively over the last four decades, and there is substantial information on their behaviour, population structure and demographics. Studies have identified three distinctive, sympatric ecotypes of killer whales, known broadly as ‘residents’ (or fish-eating), ‘transients’ (or mammal-eating) and ‘offshores’ (Bigg et al., 1987; Ford, 1991; Ford et al., 2000; Ford et al., 1998; Hoelzel et al., 1998; Hoelzel and Dover, 1991). Every individual resident and transient killer whale can be identified using photo-identification methods, based on unique pigmentation patterns and dorsal fin morphology (Baird and Stacey, 1988; Bigg et al., 1987). Although whalewatch companies report sightings of any killer whale ecotype, the most frequently encountered is the so-called southern resident killer whale. Southern resident killer whales are particularly well-studied and every individual is separated into one of three pods of matrilinealy related families (termed J, K and L pods) (Ford et al., 2000; van Ginneken et al., 2004), although some argue that L pod can be further subdivided into multiple pods (Baird et al., 2005; Hoelzel, 1993). Published identification guides, regular
Washington Cooperative Fish and Wildlife Research Unit, School of Aquatic and Fishery Sciences, University of Washington, Box 355020, Seattle, WA 98195, USA. * Northwest Fisheries Science Center, National Marine Fisheries Service, 2725 Montlake Blvd. East, Seattle, WA 98112, USA. # The Whale Museum, PO Box 945, 62 First Street North, Friday Harbor, WA 98250, USA.
274
HAUSER et al.: USE OF WHALEWATCH DATA TO DETERMINE DISTRIBUTION
occurrence in the relatively benign waters of this region and proximity to urban centres facilitate viewing opportunities and identification of southern resident and transient killer whales from centralised observers and whalewatch vessels. Because the southern resident killer whales of the North Pacific Ocean are such a well-studied population, in which all individuals are uniquely photo-identified and reside during the summer in a region that can be surveyed easily from land, they provide a unique opportunity to study the accuracy and applicability of data garnered from whalewatching platforms. In addition, the whalewatching data could provide detailed information on habitat use in this region. However, there has not yet been any attempt to quantify effort biases, proper identification or limitations for distribution analyses in the data, all of which are necessary before the data can be used (Evans and Hammond, 2004). This study was conducted in order to evaluate biases in whalewatch data on killer whales from inshore waters of Washington and British Columbia and to determine the quality and utility of this platform of opportunity for multiscale analyses of distribution patterns. A validation study of these data was designed using independent field work with land-based spotters using a systematic search and identification of killer whale pods. This systematic search overlapped temporally and spatially with the opportunistic data from the whalewatch industry. Data from this landbased network were used to determine biases in whalewatcher effort and evaluate the applicability of whalewatch data to spatial analyses. The specific objectives were to: (1) quantify efficiency of killer whale group detection by whalewatch data; (2) quantify whalewatch data accuracy in southern resident killer whale identification; (3) identify inconsistencies in resident pod identifications; (4) describe general daily patterns in the whalewatch data; and (5) provide general and region specific recommendations for the use of whalewatch data for describing cetacean distribution patterns. METHODS Whalewatch data Data on killer whale locations were compiled daily from May to October 2004 by monitoring reports of a commercial whalewatch sighting network, referred to hereafter as the Pager Network. Commercial whalewatch operators created this centralised spotting service to cooperatively locate whales for their customers. Searches were made daily from approximately 08:00-17:00 by at least one land-based observer near Victoria, BC and several Canadian and American whalewatch vessels from throughout the region (Fig. 1). Whale identifications (i.e. southern resident J, K or L pod, transient or unidentified), time of day, location and direction of travel were provided to subscribers of the Pager Network for all sightings. Sightings of unknown pod or ecotype were reported as unidentified killer whales. Location was described via pre-established grids throughout the study region and generalised to standard 5km2 cells for analyses (Fig. 2). The Pager Network represents a potentially useful platform of opportunity for collecting data on cetacean distributions, but search effort was not randomised. Effort was often concentrated in areas where whales were thought likely to be, and areas far from ports were less frequently searched. However, vessels were traversing throughout the region from home ports multiple times a day (morning, noon and evening) and had the opportunity to intercept any previously un-reported whales. Sightings by the Pager
Network are also typically a series of related events on a given day. It is in the best interest of whalewatching companies to locate whales early in a day and follow them throughout it. The ability to locate killer whales ‘early’ may involve expectations of the location and direction of movement of groups at the end of the previous day or a higher likelihood of detecting larger groups. To maintain whale follows, sightings are reported approximately every 30 minutes to the Pager Network throughout a day. Although several participants cooperatively searched for whales, an observation of a whale pod was only reported by the Pager Network once per time unit as a matter of standard protocol, such that sightings of a pod were not artificially inflated by multiple reports of the same whales. The Pager Network data thus contain a variety of potential biases. Field evaluation An independent field study was conducted to address possible violations of key assumptions and consider biases in effort, in the context of assessing the use of the Pager Network data for distribution analyses. Misidentification and sampling bias are two common forms of error introduced by whalewatching platforms. Misidentification can be either fully incorrect identification or partial misidentification. The Pager Network assumed that every individual of a pod was present during each sighting, based on the definition of pods as long-term, stable associations (Bigg et al., 1990). Sampling bias is affected by the lack of documentation on search effort. The Pager Network assumed that there was sufficient effort throughout the region during the summer such that a pod would be detected by the Pager Network during a given 24hr period if whales were anywhere within the study area (Fig. 1). Information was reported when whales were located, but it was rarely known when, for how long and where whalewatchers looked before locating whales. Therefore, it was difficult to determine if apparent pod distribution patterns reflect bias in searching patterns by commercial operators or true animal distribution. To study the Pager Network data, a land-based survey was designed in order to provide a systematic spatial and temporal search for killer whales in the study region over the same time period as the Pager Network data. The survey used trained observers in a uniform search protocol. The field study examined: (1) whether pods were being misidentified, partially or wholly and if misidentification was affected by time of day or location; and (2) whether pods were present in areas less commonly seen by the Pager Network but not reported due to lack of effort and if missed sightings were related to a particular time period. The landbased study sites (Fig. 2) were primarily chosen to cover the maximum extent possible of the primary whalewatch operations within the inshore waters of Washington and BC. To identify whether lack of sightings by whalewatchers represented low search effort or a true deficiency of sightings in a particular area, some sites were chosen where there have been few killer whale sightings in past years (D. Hauser, unpublished data) but which are nonetheless visible, at least in part, by Pager Network participants. From July to September 2004, the network of land-based observers scanned for killer whales on a daily basis for 10 days per month (separated into two distinct five-day blocks) for comparison with the Pager Network. At each of five spatially distinct sites (Fig. 2), observers simultaneously conducted an approximately 5min long scan of the surrounding area every 15min using 10350 magnification binoculars. Visual surveying via binoculars is a standard
J. CETACEAN RES. MANAGE. 8(3):273–281, 2006
275
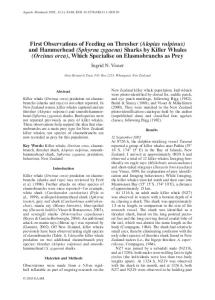
Fig. 1. Map of Washington and British Columbia 2004 whalewatch ports. Solid circle diameter indicates the total number of vessels originating from each port (data courtesy Kari Koski, The Whale Museum Soundwatch Program) and the open circle signifies the location of the land-based Pager Network observer. Vessels transit throughout the region and to/from their ports on a daily basis, contributing sightings to the Pager Network.
technique for spotting and censusing killer whales (Zerbini et al., In press) and in addition the killer whales in this region are primarily resident killer whales, whose active surface behaviour and large pod size makes them especially visible (Ford et al., 2000). Killer whale scans occurred throughout a 5hr period of each observation day. The start time of each daily 5hr scan period was staggered such that each hour from 08:00-17:00 was sampled at least once during a five-day survey period. Sighting conditions (i.e. Beaufort sea state, glare, visibility and cloud cover) were recorded for each scan, and scans were aborted if sighting conditions were poor (i.e. Beaufort sea state of three or more, less than 100m visibility). Killer whales were identified to the pod-level. The total number of individuals, number of adult and adolescent males, number of calves and any visually identified animals were recorded to determine pod identity and ecotype (i.e. resident, transient or offshore). Additionally, photo-ID pictures were taken when possible. Subset groups of L pod whales often occur separate from one another, so subset groups were identified to the sub-podlevel if necessary. Additionally, observations of other cetaceans (such as porpoises) and pinnipeds were also
recorded. Regular spotting of other species helped confirm that the scans were successful at sighting animals in the water even if no killer whales were sighted. Pod location was estimated based on the same grid system used by the Pager Network to facilitate comparisons. Continuous daily killer whale monitoring occurred at a sixth site, Lime Kiln State Park on San Juan Island, where a large staff of researchers equipped with a hydrophone provided continuous visual and acoustic detection of whales. Hereafter, all scan and Lime Kiln data will be referred to as the land-based survey. Lime Kiln observations will be mentioned as ‘during survey’ for sightings co-occurring with the scheduled surveys at other sites and ‘non-survey’ periods for sightings occurring during times when there was not simultaneous sampling at other survey sites. Concurrently throughout the summer, sightings by the Pager Network were recorded independently from the field surveys. Although recorded independently from one another, it should be noted that the presence of whalewatch vessels could alert land-based observers to the presence of killer whales. However, scans were conducted systematically and for a fixed amount of time for killer
276
HAUSER et al.: USE OF WHALEWATCH DATA TO DETERMINE DISTRIBUTION
Fig. 2. Detailed map of study area and standardised grids indicating survey sites referenced in the text. Solid circles represent sites that were surveyed according to the study schedule and the square represents Lime Kiln State Park (LK) that was continuously surveyed (i.e. constant surveillance for killer whales). Study sites included Clover Point near Victoria, BC (CP), Deception Pass State Park, WA (DP), Fort Ebey State Park on Whidbey Island, WA (FE), Lime Kiln State Park on San Juan Island, WA (LK), Dungeness National Wildlife Refuge on the Olympic Penninsula, WA (OP) and Higg’s Point on South Pender Island, BC (SPI).
whales regardless of the presence of whalewatch vessels and the land-based scans used standard survey methods that are regularly used to spot killer whales in the absence of vessels. Data analysis Land-based surveys at each of five land-based sites consisted of a total of 150hr, on 30 days (10 days per month July to September 2004), and comprised 2,941 scans. In cases where multiple sightings of a pod occurred during a day, the first Pager Network pod sighting on a sampling day at each site was selected to avoid pseudo-replication in analyses. There were a total of 34 independent killer whale group sightings during scans, 73% of which occurred at Lime Kiln Lighthouse. Killer whales were also observed at South Pender Island and Deception Pass survey sites. All killer whale sightings occurred in excellent-good sighting conditions (100% visibility, Beaufort sea state of two or
less), and mean scan length was 5.1min (0.02 standard error). Only survey scans occurring in at least fair sighting conditions (three kilometre or more visibility, Beaufort sea state of three or less, little or no fog or glare) were used in comparisons to the Pager Network. Sightings of killer whale groups were identified to pod(s) using current, established North Pacific Ocean killer whale photo-ID guides (Ford and Ellis, 1999; Ford et al., 2000; van Ginneken et al., 2004). Percentages of pod sightings by land-based observers corresponding to the Pager Network were calculated to evaluate the land-based survey’s ability to detect killer whale groups. Additionally, pod sightings were compared to the corresponding day of the Pager Network data to establish the percentage of correct locations and pod identifications by the Pager Network. It should be noted that the accuracy rates for the land-based survey and Pager Network were calculated in different ways; land-based
J. CETACEAN RES. MANAGE. 8(3):273–281, 2006
accuracy looks for Pager Network sightings that occurred during the survey period and compares those to the actual land-based detections, whereas Pager Network accuracy first looks for the land-based sightings during the surveys and compares those to the actual Pager Network sightings. Therefore, the number of detections may be different for each comparative method. Pager Network pod misidentification rates were examined by comparing Pager Network and land-based pod identifications for all sightings that corresponded in time and location. Observers from the land-based survey were assumed to have ‘correct’ killer whale identifications to test Pager Network identification accuracy against the landbased survey. This assumption is supported by: (1) the use of trained observers or experienced local killer whale researchers for sightings; (2) an explicit emphasis on pod identification by the land-based observers as opposed to the Pager Network observers who are primarily focused on killer whale presence rather than pod identification; (3) capture of photo-ID pictures when possible; and (4) observations of proportions of calves, juveniles, adult males, and easily identified individuals for comparisons with known pod compositions. Criterion (4) was particularly useful for establishing identification when land-based sightings occurred at a distance. The percentage of correctly identified pods by the Pager Network was calculated, and likely causes of any misidentification errors were considered. Identifications between the Pager Network and land-based surveys were compared directly by creating a matrix of concurrent sightings. The Pager Network did not distinguish among possible sub-pods, while the land-based study did. Therefore, the matrix recognised identification inconsistencies between the Pager Network and the landbased study related to sub-pod misidentification. Descriptive statistics of all 2004 Pager Network sightings were explored to produce Pager Network data use recommendations. Timing of daily sightings was described, and variations in mean sighting time were compared among pods and ecotypes. RESULTS The Pager Network searched for whales on 166 days from 19 May to 31 October 2004, resulting in a total of 2,554 killer whale sightings. Of all the 2004 Pager Network data,
277
74% of sightings were identified as southern resident killer whales, while transient and unidentified killer whales each contributed 13% of the sightings. Killer whale detections by land-based survey Before examining the accuracy of the Pager Network data, it was necessary to evaluate how well the land-based survey detected killer whale groups known to be present. In this case, whales reported by the Pager Network represented killer whales known to be present. Land-based sightings were compared to the number of Pager Network sightings co-occurring during the times and locations that were surveyed from shore. A total of 27 Pager Network observations occurred within areas visible from land-based sites during survey periods. During fair or better sighting conditions, the land-based survey detected 25 of the 27 Pager Network observations (92.6%). No Pager Network observations were made at survey locations in poor sighting conditions during the land-based study. These results indicate that the land-based surveys had a high detection probability for killer whale groups that are reported by the Pager Network. However, it is possible that a subset of killer whale groups, particularly transient killer whales, may exhibit highly cryptic behaviour that neither systematic land surveys nor opportunistic boat surveys would detect. It is unlikely, in our opinion, that killer whale groups would have been missed by the land surveys during good conditions, since smaller, more cryptic cetaceans like harbour and Dall’s porpoise (Phoceoena phocoena and Phocoenoides dalli, respectively) and pinnipeds were routinely observed (Table 1, columns five and six). Scans were short but frequent, making it extremely unlikely that killer whale pods would pass the scan area undetected. Killer whale presence/absence accuracy of the Pager Network To address whether the Pager Network failed to observe detectable killer whales, killer whale sightings detected by the land-based observers were compared to killer whales detected by the Pager Network. The Pager Network detected 31 of 34 killer whale groups observed at land-based locations, (91.7%; Table 1, columns three and four). All sightings occurred in fair or better sighting conditions. Therefore, the Pager Network had a high probability (>90%) of detecting groups that were also detected as present by the
278
HAUSER et al.: USE OF WHALEWATCH DATA TO DETERMINE DISTRIBUTION
land-surveys. Additionally, when no killer whales were reported by the Pager Network in an area being surveyed from land, no whales were seen during nearly 3,000 scans of the systematic land surveys either (Table 1, column two). Overall, this suggests that deficient or low numbers of Pager Network reports within a particular area indicate a lack of killer whales rather than a lack of Pager Network search effort in that area. This is particularly important because prior to this study, it could be assumed that the presence of killer whales in the Pager Network data represented their actual presence, but absence of killer whales in the data could not be assumed to mean that no whales were present.
of Variance; ANOVA) with Tukey’s ‘Honestly Significantly Different’ (HSD) post hoc test, F=80.3, p=0.000). Mean unidentified killer whale sighting time occurred at nearly 10:00 (mean=9.97, SD=1.77) and exhibited a positive skew (Fig. 4). Excluding unidentified killer whales, mean sighting time occurred at nearly 13:00 (mean=12.99, SD=2.00). This suggests that killer whale pod identification tends to be known by midday, and that unknown pod identifications are skewed to 10:00 and earlier.
Pod identification accuracy of the Pager Network Of the killer whale sightings that corresponded between the Pager Network and the land-based survey, the Pager Network correctly identified 74.1% (n=20 of 27) of the pods at land-based sites and Lime Kiln lighthouse (Table 2). Of the incorrectly identified sightings, problems associated with L sub-pods appeared to be the most common reason for incorrect identification by the Pager Network. Seventy-one percent (n=5 of 7) of incorrect pod identifications occurred when either: (1) all of L pod was reported when only a subpod was present; or (2) a sub-pod was not present during a sighting of the rest of L pod. An inability to identify pods early in the morning (before 10:30) was also associated with incorrect pod identifications (14% of incorrect identifications). Pod identification inconsistencies were further compared using a matrix with counts of identified pods from all land surveyed sites and times corresponding to Pager Network sightings (Table 3). When sightings that misidentified an L sub-pod were excluded, pod identification accuracy increased to a total of 92.6% (n=25 of 27) (Table 2, centre panel). Pods were further correctly identified a total of 96.3% (n=26 of 27) of the time when misidentifications of both L sub-pods and early morning unidentified killer whales were excluded (Table 2, right panel). Although the number of sightings (n=27) is small, the high correspondence suggests that the Pager Network has a high probability of correctly identifying southern resident pods, given exclusions of systematic misidentifications.
Implications for the use of Pager Network data for study of southern resident killer whale distribution These results suggest that the Pager Network can provide accurate locations of killer whale pods, but the Pager Network’s ability to correctly identify southern resident pods is less certain. The primary cause of pod misidentification by the Pager Network occurred because the sub-structure of the L pod was not recognised by it. Instead, L sub-pods were reported only as ‘L pod’ even when the entire pod was not necessarily present. Pods are considered long-term and consistent social associations among southern resident killer whales; individuals spend 50% or more of their time together (Bigg et al., 1990). Smaller groups, often referred to as sub-pods, also occur within the L pod. Although only three southern resident pods (J, K and L) are usually recognised, some suggest that the L sub-pods are actually two recently split pods (Baird et al., 2005; Hoelzel, 1993). If the sub-pod concept is dissolved and instead it is assumed that at least ‘some’ of the L pod is present in a Pager Network L pod sighting, then accuracy in Pager Network sightings improves from 74 to 93% correct. While it is recommended that future Pager Network operators distinguish among L sub-pods, this allowance in sub-pod ambiguity facilitates confidence in past Pager Network identifications. Both J and K pod follow the Bigg et al. (1990) definition of pods, and it can be assumed that the entire pod is present during Pager Network sightings of J or K pod. Unknown pod identity of early morning sightings was another reason for pod misidentification by the Pager Network. Identification is not necessarily a priority for operators, since killer whales, irrespective of their pod, are their target. Some animals are very distinctive and easily identified by experienced observers. Although published identification guides are available and used by whalewatchers, vessels cannot be assumed to have equal identification ability. Unknown identity killer whale sightings occurred significantly earlier in the day than all southern resident pod and transient sightings. These patterns
Temporal trends in Pager Network sightings Trends in the timing of all (n=2,554) Pager Network sightings were also examined. Among all of the 2004 Pager Network data, sightings of killer whales occurred between 06:00-20:00. The majority of sightings (87.3%) occurred at and maintained a relatively constant frequency level from 10:00 to 16:30 (Fig. 3). There was no variation in mean time of sightings among southern resident pods and transients, except for unidentified killer whale sightings which occurred significantly earlier than all other pods (Analysis
DISCUSSION
J. CETACEAN RES. MANAGE. 8(3):273–281, 2006
Fig. 3. Frequency histogram of all Pager Network killer whale sightings during 2004 (mean=12.6, SD=2.22, n=2,554).
Fig. 4. Frequency histogram of all 2004 Pager Network sightings listed as un-identified killer whales (mean=9.97, SD=1.77, n=319).
279
likely represent the search strategy of whalewatch operators. Operators searched for killer whales until they were located in the morning and an increasing number of operators, and thus number of experienced observers, searched for whales throughout the day. There appears to be a short transition period before pod identity is determined and unknown killer whale sightings declined after 10:00. Whalewatchers often located whales in the morning and followed them throughout the day, thereby maintaining recognition of pod identity and location. This behaviour increases the whalewatcher’s ability to locate and maintain relatively high confidence in pod identity after 10:00. The majority of sightings occurred from 10:30-16:00 and during this time period sighting frequency remained relatively constant before abruptly discontinuing after 16:00. This suggests that sighting effort throughout a day was consistent and stable among pods from mid-morning to afternoon and supports the conclusion that pod identity is typically determined by mid-morning. If the previous allowances for L sub-pods are accepted and unknown identity sightings before 10:30 are also excluded, the Pager Network identification accuracy increases to 96%. In order to evaluate whether the observed killer whale distribution reflects bias in whalewatch operator search patterns, areas where sightings are rare must be sampled. In 166 days of surveys, no killer whales were sighted during the land-based surveys from Clover Point, Fort Ebey or Olympic Peninsula sites, and there were few sighted at Deception Pass. During the same periods, no killer whales were reported by the Pager Network for the grids which were searched from these sites. The possibility that whalewatch operators miss killer whales in these areas cannot be eliminated since we have few to no land sightings to compare the Pager Network data with. However, hundreds of scans were conducted at each site and no killer whales were ever observed, nor reported by the Pager Network. With nearly 100 vessels originating from over 22 ports throughout the study region, the area is transited by whalewatchers throughout the day. Therefore, it is suggested that there is sufficient effort throughout the region during the summer that a pod would be detected by the Pager Network during a 10:30-16:00 period if whales were anywhere within the study area. Southern resident sightings occurred in the 2004 Pager Network data significantly more frequently than transient or
280
HAUSER et al.: USE OF WHALEWATCH DATA TO DETERMINE DISTRIBUTION
unidentified killer whales. This pattern can be attributed primarily to the higher likelihood of sighting residents than transients (Ford et al., 2000). The total transient population size within this region is unknown and is assumed to be in the low hundreds and there is a protracted resighting interval (up to ten years) for many individuals (Baird, 2001; Baird and Dill, 1995). Additionally, the divergent foraging strategies of transients and residents contribute to the overall likelihood of sighting animals. Average transient group size in this region is two individuals, ranging from between one and four individuals (Baird and Dill, 1996), while southern resident group sizes range from 11 individuals in an L subpod to all 91 individuals when the pods assemble as a single group (van Ginneken et al., 2004). Larger group size presumably contributes to greater sighting probability of residents, but transients are also less vocal, have more erratic surface behaviour and are more difficult to detect at the surface than their resident counterparts (Ford and Ellis, 1999). Therefore, it is expected that the Pager Network is more likely to miss sightings of transients than residents and care should be taken in future research employing Pager Network transient sightings. Furthermore, variation in ecotype behaviour, with residents often exhibiting more noticeable surface behaviours and occurring in large groups (typically greater than 20 individuals), promotes sightability of southern residents. Poor weather could reduce sightability for both land and whalewatch observers, but was not a factor considered in this study since all land-based observations occurred in fair or better conditions. The Pager Network can be used for future research of northwest Pacific killer whale distribution and habitat analyses, particularly for identified southern resident sightings. The Pager Network was able to detect whales within the region, and a lack of detection in an area was assumed due to a true lack of whales rather than poor effort. However, it is recommended that researchers recognise the limitations, biases and assumptions associated with these data. Specifically, it is proposed that researchers may rely on Pager Network pod identifications given three conditions: (1) awareness that a small (<5%) degree of error due to unambiguously incorrect pod identifications exists; (2) assumption that a Pager Network L-pod sighting does not necessarily represent all of the L-pod, but rather may represent only one of its sub-pods; and (3) restriction of analyses of Pager Network data to sightings occurring between 10:30 and 16:00, when there is consistent search effort and pod identity is more likely already known. Future studies should not extrapolate these results beyond the region bounded by the extent of the land-based survey sites. Broader implications Globally, whalewatching is a growing enterprise and research opportunities using whalewatching as a platform are likely to increase. In 1998, over nine million participants were involved in whalewatching in 87 countries and territories and the number of participants was growing by an average of 12% per annum (Hoyt, 2001). Although ecological tourism has been regarded by some as a possible disturbance source to cetacean populations, it is beyond the scope of this study to examine the potential impacts of whalewatching. If managed responsibly, ecological tourism may also have local economic and educational benefits. A more dispassionate analysis of such activities seems appropriate, and researchers should consider whether ecological tourism can be utilised to gather technical data of value in understanding, conserving and managing target
species. Using whalewatching as an avenue of research represents a more affordable approach to distribution studies, which traditionally require labour and cost intensive line transect, aerial or vessel surveys. In this case, whalewatching companies have a high level of self-interest in maintaining a sighting network. The Pager Network is a somewhat unique situation in which whalewatchers target a small, well-known population of a single species in a very localised, semi-enclosed area. However, as shown with the Pager Network, such data can be accurate enough to be useful for describing whale distribution. Particularly in developing nations with expanding ecotourism endeavours, whalewatch platforms may present a cost-effective method to accumulate basic information as a segue into more intensive research. There is clearly a need for testing data quality from platforms of opportunity, as well as acknowledgment of data limitations and biases before such research is pursued. These should be tested on a regular basis, if long-term use of platforms of opportunity is planned. Although there may be situationspecific considerations for each whalewatching platform, this research in the northeast Pacific provides an example of possible approaches to validation. It is proposed that data provided by commercial whale watch operations can be applied to spatial analyses, with proper evaluation and understanding of limitations. ACKNOWLEDGEMENTS Several volunteers helped during the field study and with data processing, particularly Teresa Mongillo, Sarah Ashworth and Toby Black. The Whale Museum supported the collection of Pager Network data, and Robert Otis provided data from Lime Kiln State Park. Kari Koski contributed information on vessel numbers and whalewatch operations during the 2004 season. Jennifer Marsh provided a supplemental dataset for secondary evaluation of Pager Network accuracy. Analyses of pod identification would not be possible without the long-term commitment to the annual killer whale census and survey by Ken Balcomb and the Center for Whale Research. This manuscript was greatly improved by comments from Peter Best, Robin Baird, Peter Westley, Heather Smith and an anonymous reviewer. The Washington Cooperative Fish and Wildlife Fisheries Research Unit provided logistical support for field operations, and this work was funded by the Northwest Fisheries Science Center, National Marine Fisheries Service and the Claire L. and Evelyn S. Egtvedt Fellowship to DDWH from the University of Washington’s School of Aquatic and Fishery Sciences. REFERENCES Baird, R.W. 2001. Status of killer whales, Orcinus orca, in Canada. Can. Field-Nat. 115:676-701. Baird, R.W. and Dill, L.M. 1995. Occurrence and behaviour of transient killer whales: seasonal and pod-specific variability, foraging behaviour and prey handling. Can. J. Zool. 73:1,300-11. Baird, R.W. and Dill, L.M. 1996. Ecological and social determinants of group size in transient killer whales. Behav. Ecol. 7(4):408-16. Baird, R.W., Hanson, M.B. and Dill, L.M. 2005. Factors influencing the diving behaviour of fish-eating killer whales: sex differences and diel and inter-annual variation in diving rates. Can. J. Zool. 83:257-67. Baird, R.W. and Stacey, P.J. 1988. Variation in saddle patch pigmentation in populations of killer whales (Orcinus orca) from British Columbia, Alaska and Washington State. Can. J. Zool. 66(11):2,582-85. Baumgartner, M.F., Cole, T.V.N., Clapham, P.J. and Mate, B.R. 2003. North Atlantic right whale habitat in the lower Bay of Fundy and on the SW Scotian Shelf 1999-2001. Mar. Ecol. Prog. Ser. 264:137-54.
J. CETACEAN RES. MANAGE. 8(3):273–281, 2006 Bigg, M.A., Ellis, G.M., Ford, J.K.B. and Balcomb, K.C. 1987. Killer Whales: A Study of Their Identification, Geneaology and Natural History in British Columbia and Washington State. Phantom Press, Nanaimo, British Columbia. 79pp. Bigg, M.A., Olesiuk, P.F., Ellis, G.M., Ford, J.K.B. and Balcomb, K.C. 1990. Social organization and genealogy of resident killer whales (Orcinus orca) in the coastal waters of British Columbia and Washington State. Rep. int. Whal. Comm. (special issue) 12:383-405. Clapham, P.J., Good, C., Quinn, S.E., Reeves, R.R., Scarff, J.E. and Brownell, R.L., Jr. 2004. Distribution of North Pacific right whales (Eubalaena japonica) as shown by 19th and 20th century whaling catch and sighting records. J. Cetacean Res. Manage. 6(1):1-6. Dalebout, M.L., Ross, G.J.B., Baker, C.S., Anderson, R.C., Best, P.B., Cockroft, V.G., Hinsz, H.L., Peddemors, V. and Pitman, R.L. 2003. Appearance, distribution and genetic distinctiveness of Longman’s beaked whale, Indopacetus pacificus. Mar. Mammal Sci. 19(3):42161. Darling, J.D., Keogh, K.E. and Steeves, T.E. 1998. Gray whale (Eschrichtius robustus) habitat utilization and prey species off Vancouver Island, B.C. Mar. Mammal Sci. 14(4):692-720. Drouot, V., Gannier, A. and Goold, J.C. 2004. Summer social distribution of sperm whales (Physeter macrocephalus) in the Mediterranean Sea. J. Mar. Biol. Assoc. UK 84(3):675-80. Elwen, S.H. and Best, P.B. 2004. Environmental factors influencing the distribution of southern right whales (Eubalaena australis) on the south coast of South Africa. I: Broad scale patterns. Mar. Mammal Sci. 20(3):567-82. Evans, P.G.H. and Hammond, P.S. 2004. Monitoring cetaceans in European waters. Mammal Rev. 34(1):131-56. Ford, J.K.B. 1991. Vocal traditions among resident killer whales (Orcinus orca) in coastal waters of British Columbia. Can. J. Zool. 69(6):1,454-83. Ford, J.K.B. and Ellis, G.M. 1999. Transients: Mammal-Hunting Killer Whales. UBC Press, Vancouver. 96pp. Ford, J.K.B., Ellis, G.M. and Balcomb, K.C. 2000. Killer Whales: The Natural History and Genealogy of Orcinus orca in British Columbia and Washington. 2nd ed. UBC Press, Vancouver. 102pp. Ford, J.K.B., Ellis, G.M., Barrett-Lennard, L.G. and Morton, A.B. 1998. Dietary specialization in two sympatric populations of killer whales (Orcinus orca) in coastal British Columbia and adjacent waters. Can. J. Zool. 76:1,456-71.
281
Gregr, E.J. and Trites, A.W. 2001. Predictions of critical habitat for five whale species in the waters of coastal British Columbia. Can. J. Fish. Aquat. Sci. 58:1,269-85. Griffin, R.B. 1999. Sperm whale distributions and community ecology associated with a warm-core ring off Georges Bank. Mar. Mamm. Sci. 15:33-51. Hoelzel, A.R. 1993. Foraging behavior and social group dynamics in Puget Sound killer whales. Anim. Behav. 45(3):581-91. Hoelzel, A.R., Dahlheim, M.E. and Stern, S.J. 1998. Low genetic variability among killer whales (Orcinus orca) in the eastern North Pacific and genetic differentiation between foraging specialists. J. Hered. 89:121-28. Hoelzel, A.R. and Dover, G.A. 1991. Genetic differentiation between sympatric killer whale populations. Heredity 66:191-95. Hoyt, E. 2001. Whale watching 2001 – worldwide tourism, numbers, expenditures and expanding socioeconomic benefits. Report to IFAW, Crowborough, Sussex, UK. 157pp. [Available from IFAW]. Jaquet, N., Whitehead, H. and Lewis, M. 1996. Coherance between 19th century sperm whale distributions and satellite-derived pigments in the tropical Pacific. Mar. Ecol. Prog. Ser. 145:1-10. Maldini, D., Mazzucca, L. and Atkinson, S. 2005. Odontocete stranding patterns in the main Hawaiian islands (1937-2002): how do they compare with live animal surveys? Pac. Sci. 59(1):55-67. van Ginneken, A.M., Ellifrit, D.K. and Balcomb, K.C. 2004. Official Orca Survey Field Guide – Photo-identification Guide to Orca Whales of the Southern Resident Community. Center for Whale Research, Friday Harbor. Weinrich, M.T., Kenney, R.D. and Hamilton, P.K. 2000. Right whales (Eubalaena glacialis) on Jeffreys Ledge: A habitat of unrecognized importance? Mar. Mammal Sci. 16:326-37. Zerbini, A.N., Andriolo, A., Da Rocha, J.M., Simoes-Lopes, P.C., Siciliano, S., Pizzorno, J.L., Waite, J.M., DeMaster, D.P. and VanBlaricom, G.R. 2004. Winter distribution and abundance of humpback whales (Megaptera novaengliae) off northeastern Brazil. J. Cetacean Res. Manage. 6(1):101-07. Zerbini, A.N., Waite, J.M., Durban, J.W., LeDuc, R.G., Dahlheim, M. and Wade, P.R. In press. Estimating abundance of killer whales in the nearshore waters of Alaska and Aleutian Islands using line transect sampling. Mar. Biol. Date received: November 2005 Date accepted: July 2006