Optimizing Binary Translation of Dynamically Generated Code Byron Hawkins and Brian Demsky
Derek Bruening and Qin Zhao
University of California, Irvine {byronh,bdemsky}@uci.edu
Google, Inc. {bruening,zhaoqin}@google.com
Abstract Dynamic binary translation serves as a core technology that enables a wide range of important tools such as profiling, bug detection, program analysis, and security. Many of the target applications often include large amounts of dynamically generated code, which poses a special performance challenge in maintaining consistency between the source application and the translated application. This paper introduces two approaches for optimizing binary translation of JITs and other dynamic code generators. First we present a system of efficient source code annotations that allow developers to demarcate dynamic code regions and identify code changes within those regions. The second technique avoids the annotation and source code requirements by automatically inferring the presence of a JIT and instrumenting its write instructions with translation consistency operations. We implemented these techniques in DynamoRIO and demonstrate performance improvements over the stateof-the-art DBT systems on JIT applications as high as 7.3× over base DynamoRIO and Pin.
1.
Introduction
One of the primary goals of dynamic binary translation (DBT) is to minimize runtime overhead while providing accurate and flexible introspection and instrumentation of the target application. Many optimizations have been developed, including translating the target application into an internal code cache such that each fragment of the translated application is only generated once—the first time it is executed. DBT tools also commonly implement advanced optimizations such as tracing and in-cache resolution of indirect branches. These enhancements focus on DBT performance for applications comprised exclusively of statically generated code—i.e., compiled binary executables and libraries—which historically includes the vast majority of popular applications. In recent years, however, the software industry has begun a significant transition toward dynamically generated code, especially JIT engines for script interpreters. Dynamically generated code (DGC) presents a special challenge to the efficiency of a DBT tool. To maintain consistency between the original application and its translation in the code cache, a DBT tool must (1) detect modifications to the original generated code and (2) reconstruct the corresponding portion of the translated application. This creates tremendous additional overhead, reducing today’s DBT platform
performance by an order of magnitude for applications that dynamically generate substantial amounts of code. For example, the overhead of DynamoRIO [2] for the SPEC CPU 2006 benchmark suite [28] on 64-bit Linux averages merely 12% (Section 6) but the Octane JavaScript benchmark suite runs 4.4× slower in the Mozilla Ion JIT and 15× slower in the Chrome V8 JIT on the same platform. Similarly, the average overhead of Pin [17] is 21% [5] for SPEC CPU 2006, but Octane runs 8× slower in Ion and 18× slower in V8. The main reason for the extreme slowdown caused by DGC is that the DBT tool cannot easily detect when and where generated code is modified. While most RISC architectures require an explicit instruction cache flush request by the application to correctly execute modified code [13], this paper focuses on the IA-32 and AMD64 platforms where the hardware keeps the instruction and data caches consistent and no explicit action from the application is required. Special measures must be taken by the DBT tool to detect code changes, as any memory write could potentially modify code. Since performance constraints do not allow instrumentation of every write in the entire application, the common approach is to artificially set all executable pages to readonly, and invalidate all code translated from a page when a fault occurs. These factors greatly increase the overhead of the DBT tool when an application frequently writes to pages containing code. This paper presents DBT optimization techniques applied to DynamoRIO for the special case of dynamically generated code. Our augmented DynamoRIO significantly outperforms the state-of-the-art DBT systems on JIT programs. For the Octane JavaScript benchmark running in the Mozilla JavaScript engine, we achieve 2× speedup over DynamoRIO and 3.7× speedup over Pin, and for Octane in the Chrome V8 JavaScript engine we achieve 6.3× speedup over DynamoRIO and 7.3× speedup over Pin. 1.1 Motivation for Improving DBT of DGC Security [7, 15, 27] and bug detection [4] applications of DBT are especially important for dynamically generated code, first because it is becoming more prevalent in popular applications. For example, all of the Microsoft Office applications use the JScript9 JavaScript engine to render built-in web browser components. Another common example is the Adobe PDF Reader, which renders the application frame in a Flash component and built-in cloud account browsers with Flash and JScript9. Both Microsoft and Google host popular office suites online, where the majority of application
2015 IEEE/ACM International Symposium on Code Generation and Optimization c 978-1-4799-8161-8/15/$31.00 2015 IEEE
functionality executes in the web browser’s JavaScript engine. Since these JIT-intensive applications and components are most commonly used to access Internet resources, every security vulnerability becomes a publicly accessible attack surface, and every bug becomes a security vulnerability. Furthermore, the dynamic nature of generated code makes it vulnerable to a wider range ofLattacks, since some effective security measures such as W X [19] are not available. Program analysis applications of DBT are also especially relevant to dynamically generated code because:
yet (2) supports the full calling convention with efficient annotation detection by DBT tools. • Annotation-Based Support for Efficient Caching of
Dynamically Generated Code: We present a system of annotations that can be used by JIT engines to enable DBT to efficiently support dynamically generated code.
• Inference-Based Support for Efficient Caching of Dy-
namically Generated Code: We present an inferencebased approach that can support fine granularity detection of modifications to dynamically generated code and optimizations that avoid the overheads of page faults in common cases.
1. a wide range of popular and important software systems now include large DGC components; 2. the complexity of debugging DGC engines is much higher than for statically compiled code; 3. the majority of conventional analysis tools operate on source code, which for DGC only exists in the abstract form of internal data structures; and 4. performance is the primary goal of most dynamic code generators, making them ideal targets for the deep profiling and memory analysis that DBT excels at. Effective program analysis must be efficient enough for regular use, which is not possible given the current approach to translation consistency in popular DBT platforms. 1.2 Optimization Techniques This paper introduces two optimization approaches and demonstrates in the context of DynamoRIO that both can significantly improve performance of DBT for the JavaScript JIT engines V8 and Ion, achieving under 3× the native execution time on average. The simpler of these two approaches is to augment the target application with special source code annotations that are compiled into the binary and subsequently translated into DBT actions by the DBT interpreter. The specific annotations used are described in Section 3.1. While the annotations have a very small impact on the native performance of the target application, the obvious disadvantage to this approach is that it requires source code and a special build of the target application. In addition, many applications are not trivial to annotate correctly, and annotation errors have the potential to cause the application to behave incorrectly or crash under DBT. The second approach infers JIT code regions and instruments all writes targeting those regions to use a parallel memory mapping that has writable permission. The instrumentation also flushes fragments of the translated application that are invalidated by the JIT write. While this approach is less intrusive in the user’s toolchain, it requires the use of additional address space and is more complex to implement. 1.3 Contributions This paper makes the following contributions: • An Efficient Scheme of Binary Annotations: We present
a novel source code annotation scheme that, when compiled into binary annotations in a native x86 target application (1) avoids overhead from annotation arguments,
2.
Background and Related Work
The structure of a Dynamic Binary Translator is optimized for its performance on statically compiled code, which comprises the vast majority of target applications. This structure makes its performance especially weak for dynamically generated code. In its most na¨ıve form, dynamic binary translation can be implemented as a pure interpreter, applying instrumentation each time a relevant program point is encountered. This approach would have identical overhead for both static and dynamic code. To optimize for the common case, DBT platforms typically translate fragments of the target application on demand into a memory-resident cache. This section begins with an implementation overview of DynamoRIO [2], highlighting the optimization details that benefit the common case but work against dynamically generated code. The remainder of the section outlines the strategies for handling DGC used by popular DBT platforms. 2.1 DynamoRIO DynamoRIO initially translates each basic block of the target application on demand into the code cache, linking the translated blocks in parallel with their original counterparts to replicate the original control flow within the cache. As new blocks of the target application are executed, the code cache is incrementally populated until eventually the application runs entirely within the cached copy. An indirect branch in the control flow may have many targets, which are specified by an address value in the memory space of the application. Since the data flow of the target application is identical to a native run, the address of the branch target always refers to the original application’s memory—untranslated code outside the code cache. To prevent the execution from returning to the original application, the branch is redirected to a lookup routine within the cache that finds the translated code fragment corresponding to the branch target and jumps to it. Figure 1 depicts the translation and linking process. Traces in DynamoRIO To improve performance for hot paths in the application, DynamoRIO instruments each indirect branch target with an execution counter, and when the count reaches a configurable threshold (by default 52), the fragment is designated as the head of a trace. As execution continues, the trace is progressively extended using the Next Executing Tail scheme. Indirect branches within a trace are translated into the more efficient direct branches, which
Application Code foo()
bar()
A
BB Cache
Trace Cache
A C
C
B
DynamoRIO Code Cache
D
D
E E F
Indirect Branch Lookup
F
A C D E ? F
Figure 1: Overview of Dynamic Binary Translation. Blocks of application code are dynamically translated into a code cache where they are linked back together.
do not require a lookup routine, and direct branches are removed by fusing the basic blocks of the trace into a single straight-line code sequence. VM Areas in DynamoRIO When the target application allocates memory, whether by mmap to load a module image or by an allocation function such as malloc or any other means, DynamoRIO creates an internal accounting structure for that block of memory called a VM area. Executable code in a VM area is associated with it by a list of code fragments, which can be either basic blocks or traces. When a module image is unloaded by the target application, the corresponding VM area with its list of fragments is flushed accordingly. Likewise, if the application removes executable permission from a region of memory, the corresponding code fragments must be flushed—even if the area becomes executable again, changes to the code will not be known, and any obsolete fragments will cause the application to behave incorrectly. To detect changes to code in a VM area that is both writable and executable, DynamoRIO artificially sets the page permission to read-only [3]. When a page fault occurs in the VM area, all of its code fragments are flushed. While it is possible to identify the specific fragments that were changed and flush them selectively, it would require special handling of memory permissions to execute the write exclusively of other threads, because even a momentary change to the writable permission is global and could allow a concurrent thread to write undetected. This problem is one of the root factors that makes na¨ıve handling of DGC inefficient, so we refer to it throughout this paper as the concurrent writer problem. In general, the minimum granularity of a dynamic code change is one page of memory, because a write cannot be executed exclusively within a virtual page. The optimization in Section 5 introduces an alternative, more sophisticated approach that eliminates the concurrent writer problem and enables finer granularity code changes.
DGC in DynamoRIO While this structure is very efficient for module images loaded via mmap, it requires most dynamically generated code fragments to be translated into the code cache many times repeatedly. Consider the simple case of a JIT engine generating a compiled function, executing the function, then generating a second function in the same VM area and executing it, and so on. The writing of each new function requires all the existing functions to be invalidated and retranslated. This process is especially cumbersome for traces, which must be rebuilt after each VM area flush according to the hottest paths identified by the instrumented trace heads. While it is possible to simply disable tracing for the JIT code areas, this yields very poor performance in long-running benchmarks such as Octane. Since the JIT compiles the hottest paths in the application’s JavaScript, the JIT code areas are necessarily the hottest paths in the application. Disabling traces improves the efficiency of the code generation process, but in a full run of Octane costs 25% in overall execution time because the code along the hot paths is so much less efficient in CPU execution time. The benchmark results in Section 6 indicate that DBT in general performs much worse on Chrome’s V8 JavaScript engine than on Mozilla’s Ion, even though V8 outperforms Ion in a native run. This is caused by frequent writes to small data areas, typically bit fields, scattered throughout the generated code. Since these writes do not affect translated code, DynamoRIO could theoretically execute the writes without flushing the region. But this is prevented by the risk of a concurrent write—and even if it were possible, it would still be very expensive to determine whether the write target overlaps any translated code fragment. The search would be reasonably efficient if DynamoRIO were to keep a sorted data structure of spans, but it does not because that large and expensive structure would be of no value for module image VM areas, which comprise the vast majority of translated code. Therefore, without special optimization for DGC, determining fragment overlap would require a time-consuming search of the code fragment list for the targeted VM area. 2.2 QEMU When QEMU [1] translates code fragments from a page of memory in the guest, one of two strategies is used to detect code changes on the page. The first strategy is similar to DynamoRIO, marking the page read-only and handling the fault as if it were a write event. The second strategy relies on the QEMU softmmu layer, which provides a software TLB that effectively maps the guest page table to the host page table. When the guest writes to a page of memory, the target is translated through the softmmu layer to the corresponding host page, and this translation point can be configured to instead trap into QEMU for code change handling [18]. 2.3 Pin Pin [17] translates all code into traces. For any trace containing instructions that were dynamically generated, the head of the trace is instrumented to check whether any of those instructions have changed [20]. When executable permission is removed from a page containing DGC, all traces contain-
ing code fragments translated from the page are invalidated. During periods of frequent code generation, this approach is more efficient than instrumenting every store, because traces will be executed much less frequently than stores. But the cost increases dramatically while the JIT engine is dormant and the generated traces are repeatedly executed, since the instrumented checks rarely discover code changes and are executed far more often than stores (assuming the generated code is collectively hotter than the interpreted code, and that the generated code does not itself generate code). Both DynamoRIO and QEMU rely on detecting code changes at the time of the write, leading to the concurrent writer problem, but the Pin approach relies on detecting code changes at the time the translated traces are executed. This makes it possible for Pin to selectively flush individual traces from the code cache. The benchmark results in Section 6 show that this approach outperforms region flushing for executions of the Octane benchmark. 2.4 Valgrind Valgrind [23] provides two methods for synchronizing its code cache with dynamically generated code. The first is similar to Pin, instrumenting every dynamically generated basic block with a check for modified code. The second strategy requires compiling the target application with a source code annotation [26] that is translated into a code cache flush event. While the latter approach is relatively efficient, it does not significantly improve performance because the cost of both methods is overwhelmed by the slowdown of Valgrind’s translation of basic blocks through a three-value IR. DynamoRIO implements some of the Valgrind annotations for compatibility purposes. In addition, Section 4 presents a new annotation scheme that is much more efficient than Valgrind’s. It also supports all popular compilers on the Windows 32-bit and 64-bit platforms, including Microsoft Visual Studio, the Intel C++ Compiler and GCC. 2.5 Specialized Applications of Binary Translation The Transmeta Code Morphing SoftwareTM [8] leverages hardware support to synchronize with dynamic code in several ways, including: (1) an approach like DynamoRIO’s, but with sub-page write detection, (2) the technique now used by Pin, (3) a similar approach which only revalidates a DGC fragment after its containing write-protected region has been written, (4) patching translated code on the basis of recognized DGC patterns such as jump target substitution, and (5) translating frequently modified code into translation groups, which cache a history of recent translations for recurring DGC. Librando [12] automatically diversifies the output of a JIT compiler at runtime for increased security. Librando allows the JIT to run natively, and detects JIT writes using the same page protection scheme as DynamoRIO, additionally minimizing overhead by validating each diversified basic block using a hashcode of the instruction bytes. A survey by Keppel [14] outlines a variety of techniques for detecting self-modifying code in instruction-set simulation.
3.
Annotation-Based Optimization
A simple approach to optimizing DynamoRIO for JIT code is to add source code annotations to the target application that notify the DBT about changes in generated code. Section 4 describes the design and implementation of our underlying annotation scheme. This section introduce A NNOTA TION DR, an extension of O RIGINAL DR that supports specific event annotations for JIT optimization. 3.1 New Annotations Identifying Code Changes In A NNOTATION DR, we introduce three annotations to facilitate handling DGC in DBT systems: 1. ManageCodeArea(address, size): disables the default method of detecting code changes for the specified region of memory until the area is unmanaged. 2. UnmanageCodeArea(address, size): re-enables the default method of detecting code changes for the specified region of memory. 3. FlushFragments(address, size): flush all fragments of the translated application corresponding to the specified region of the target application. These annotations indicate the allocation and deallocation of JIT code regions and notify A NNOTATION DR of all writes to the JIT code VM areas. We refer to JIT code regions as managed code regions. The default write detection schemes are disabled for managed code regions in A NNOTATION DR, because every change to JIT code is explicitly annotated. Given a correctly annotated application, the remaining challenge is minimizing redundant code fragment flushes by providing a finer granularity flush operation. A NNOTA TION DR introduces two improvements, described below. 3.2 VM Area Isolation Recall that by default, O RIGINAL DR invalidates cache code at the granularity of VM areas. A substantial performance improvement can be made in A NNOTATION DR’s handling of DGC by simply reducing the size of the VM areas containing DGC to single pages. Annotations indicate which memory allocations of the target application contain JIT code, so the corresponding VM areas can either be split into single pages upon instantiation, or lazily as code in those regions is invalidated. The annotation event for JIT writes allows A NNOTATION DR to avoid the expensive page faults required by the default strategy for detecting dynamic code changes, and more importantly alleviates the concurrent writer problem. Together these improvements reduce the execution time to 3.7× native execution time on the Octane JavaScript benchmark [6] for V8 [10] and 2.6× for Ion [21] (see Section 6). 3.3 Selective Fragment Removal Further improvement requires identifying, for each JIT write, which specific code fragments should be invalidated and selectively removing them from the code cache. For small writes such as a jump target change, it is alternatively possible to patch the corresponding fragments in the code cache instead of removing them. However, this would add
High Fan-in One challenge inadvertently raised by this optimization is that the removal of incoming direct branches can become a significant bottleneck. In statically compiled code, direct branches are rarely removed, so O RIGINAL DR optimizes for space by using a singly-linked list to identify all direct branches targeting a code fragment (Figure 3). But in a run of Octane’s Mandreel benchmark, in which V8 generates up to 150,000 direct branches that all target the same basic block, these branches are often removed during execution as stale code fragments are overwritten. The corresponding fragment removal requires an O(n) traversal of a potentially long branch list, and in the case of Mandreel this consumes the entire speedup of selective fragment removal. This slowdown can be alleviated by observing that the majority of high fan-in branches come from basic blocks that are no longer in use by the JIT, but have not been overwritten or deallocated (i.e., dangling fragments). For this reason, the slowdown does not occur in A NNOTATION DR with VM area isolation, because the coarser flushing of
0x4a700
Application Instruction Address
0x129c
AB
A B 0x4a740 C D
ABC
DEF
0x129d
FGH
I
0x129e
E 0x4a780
F
Hashtable Key
significant complexity to the interface used to build tools with A NNOTATION DR. Tool authors would need to spend effort handling the case of instrumented code being directly patched, including jump targets changing, which can drastically affect security or sandboxing tools. By instead simply invalidating fragments corresponding to the modified code we keep the tool interface consistent. The tradeoff here between complexity and performance may be worthwhile for specific tools and could be explored in future work. The invalidation process is made more complicated by several implementation factors of O RIGINAL DR: (1) the constituent basic blocks of each trace are kept separately from the trace itself, (2) traces typically do not consist of code that was contiguous in the original binary, and (3) a single basic block in the target application may be translated into several overlapping basic blocks, each having a different entry point and all having the same exit. As discussed at the end of Section 2.1, this requires an efficient data structure for sorted spans. The conventional data structure would be a red-black interval tree, but given the large quantity of DGC fragments, each traversal would likely incur at least a dozen branch mispredictions, and probably several CPU cache misses as well. Instead, A NNOTATION DR stores the DGC fragment spans in a hashtable in which each bucket represents 64 bytes of a JIT code VM area. When a DGC fragment is translated into the code cache, its span is added to each hashtable bucket it overlaps. To lookup fragments overlapping a JIT write, the hashtable is first consulted to obtain a list of buckets whose 64-byte span is touched by the write. Since it is common for JIT engines to intersperse the generated code with small data fields, A NNOTA TION DR next checks the fragments in each bucket for overlap, such that only fragments specifically overlapping the written bytes will be flushed. A single hashtable bucket can in rare cases contain up to 32 fragments (for example, in a field of two-byte trampolines), so to minimize CPU cache misses while traversing a bucket’s chain, each link in the chain holds 3 fragment spans. Figure 2 illustrates the distribution of code fragments into the hashtable buckets.
G H I
0x4a7c0
Figure 2: Distribution of translated code fragments into the overlap hashtable. To locate fragments overlapping a JIT code write, A N NOTATION DR first looks up the buckets overlapping the span of bytes written by the JIT, then identifies the specific code fragments that were overwritten (if any).
F1
F2
F3
F89273
F89274
F89275
fragment _id next_incoming_link
A
outgoing_links[0]
Figure 3: The singly-linked list of incoming branches requires an O(n) traversal to remove a fragment, resulting in significant overhead for high fan-in basic blocks that are common in JIT code.
whole pages randomly eliminates the majority of incoming branches from dangling fragments. A NNOTATION DR simulates this effect by limiting the number of incoming direct branches to 4096, removing the fragment containing the oldest incoming branch when the limit would otherwise be exceeded. In some cases the removed fragments may still be in use, requiring retranslation, but in general the removed fragments are never executed again. This heuristic is not necessarily optimal for all JIT scenarios, so to handle an extreme case it is possible to selectively substitute the linked list with a hashtable of incoming direct branches.
4.
Annotation Implementation
This section describes how our annotations are implemented. Beyond our primary use of annotations for identifying DGC, there are many other use cases for annotations in a DBT platform. Existing annotations are often for avoiding false posi-
tives in tools such as memory usage checkers. For example, Valgrind provides several dozen annotations with such functionality as printing to the Valgrind log, or marking variables in the target application as having defined values in cases where the Memcheck [26] tool’s analysis would otherwise report an undefined-use error. 4.1 Binary Annotation Scheme Source code annotations in the target application are compiled into binary annotations which can be translated by the DBT tool into event callbacks at runtime. A binary annotation is a short code sequence that has the effect of a nop during native executions of the application, but can be definitively recognized by the DBT interpreter. Annotations must support passing argument values to the DBT tool and returning a return value to the application. These argument values are constructed using normal compiled code. There are three requirements for implementing effective annotations: 1. The annotation must create minimal overhead during native execution of the target application, such that annotations can be included in the release build. 2. Compiler optimizations can potentially modify or even remove annotations, so they must be defined in such a way that the DBT tool can recognize it after optimizations have transformed it. 3. The annotations must be distinctively recognizable by the DBT tool, such that annotation detection does not create overhead for code that does not have annotations. 401972 401974 40197 c 401985 401987 40198 c 401991
jmp mov bsf jmp mov mov callq
401985 # f i r s t jump 0 x202688 ,% r a x # name b a s e 0 x f f f f f f f f f f f f f f 9 8 ,% r a x # name offset 401996 # s e c o n d jump $0x2 ,%esi # a r g u m e n t 2 $0x1 ,%edi # a r g u m e n t 1 4024 f 2 # a n n o t a t i o n f u n c t i o n call
Listing 1: Annotation macro for 64-bit GCC. The first jump operand is always 0x11 bytes, allowing the DBT tool to use it as a quick detection filter. The subsequent mov and bsf encode a pointer to the annotation name in the text section.
Our basic approach to satisfying Requirement 1 is to prefix the annotation with a jump beyond the annotation, such that the body of the annotations is dead code—skipped over in a native execution (Listing 1). Implementing the annotation using inline assembly meets all three requirements, as (1) the jump over the annotation has near zero runtime overhead, (2) inline assembly instructions are never transformed by compiler optimizations (even whole-program optimizations), and (3) the exact byte sequence can be precisely controlled to minimize ambiguity with application code. The developer invokes the annotation using a macro, which accepts ordinary arguments from the domain of application variables, constants and functions, e.g.: MANAGE_CODE_AREA(start, compute_area_size());
In this example, even if the compiler inlines the entire function body of compute area size() into the argument preparation, it would all be skipped during native execution.
4.2 Annotation Discussion Existing DBT tools usually use one of two annotation types: 1. a call to a function that is empty except for a short instruction sequence to prevent “identical code folding” optimizations from transforming all the annotation functions into a single function [25, 29], or 2. a sequence of instructions inserted at the annotation site that has the effect of a nop during native execution but can be distinctively recognized by the DBT tool. The empty functions are simple and flexible, allowing any number of arguments to the annotation, though the cost of the empty function call increases with the number of arguments (Table 1). Valgrind’s approach limits annotations to 5 arguments and requires more effort for the DBT tool to detect because the distinct instruction sequence is 12 bytes long for 32-bit applications and 16 bytes long for 64-bit applications. This not only requires more bytes to be examined during annotation detection, it also causes a complication when a basic block is truncated in the middle of an annotation. In this case, the DBT tool must either maintain a state flag for each thread indicating that the last decoded instruction could be part of an annotation, or to simply read beyond the end of a basic block to see if the subsequent bytes might form an annotation. The former approach is wasteful because the flag must be checked very frequently and it is almost always off, while the latter approach risks a segfault if the forward bytes are not readable. Valgrind’s annotations also rely on GCC pragmas which are not available in other compilers. A NNOTATION DR annotation TSan annotation Valgrind annotation
One arg 1.54× 2.35× 3.05×
Five args 1.54× 3.34× 3.05×
Five varargs 1.54× 4.01× N/A
Table 1: Native execution overhead of binary annotations in the extreme case of annotating every array index expression in the SPEC CPU 2006 benchmark 470.lbm.
Our annotation scheme using a jump over argument setup improves on both approaches. It is more efficient than always performing a function call. It also out-performs existing inline assembly annotations, as (1) the annotation is completely skipped by direct jumps during a native run (including argument setup code), (2) the annotation arguments use as many registers as the platform calling convention allows, and (3) the presence of an annotation can more efficiently detected. Table 1 shows the annotation overhead in an extreme case of adding 486 annotations in the inner loops of the lbm array computation from the SPEC 2006 benchmark suite. Even though the annotation is executed every time an array value is indexed, the overhead is just 50%. Detecting the annotation in a DBT tool still requires reading beyond the end of a basic block in case it has been truncated in the middle of an annotation. But our approach minimizes the cost of a potential segfault by minimizing the number of conditions in which (1) the risk is taken and (2) there is actually no annotation present. We selected the first two instructions of the annotation to be relatively rare for normal code:
(1) a direct short jump of fixed length (which varies per platform), and (2) int 2C, which is the only instruction in the Intel x86 ISA to start with byte CD. A basic block will usually terminate at the jump, so we only need to read the next byte to determine whether further unsafe reading is required to complete the detection, and this one-byte read is relatively inexpensive because in most cases it lies on the same page as the jump, which guarantees it must be readable. Note that the approach is slightly different for 64-bit Windows where inline assembly may not be supported (Section 4.3). 4.3 Annotations in 64-bit Microsoft Visual Studio The 64-bit Microsoft Visual Studio compiler presents a special case for the annotations because it does not support inline assembly. Without inline assembly, the annotation must be defined in ordinary C code, from which the compiler may produce a broad range of assembly sequences. Compiler optimizations such as dead code elimination make this especially complex because the annotation itself is dead code— in a native run the execution always jumps over the annotation body. It is also common for the compiler to move parts of the annotation, for example sharing a single register load between two annotations within the same function, which would make the annotation unrecognizable to A NNO TATION DR because the register load is one of the key identifying elements of the annotation. Listing 2 presents the C code for the ANNOTATION() macro, which takes the following arguments: • annotation: the name of the annotation function, as
defined in the target application.
• native code: a block of statements to execute instead of
the annotation during native execution of the application (may be empty).
• ...: arguments to the annotation function, corresponding
to the formal parameters of the annotation function.
The annotation begins and ends with conditional branches, both of which are never taken during native executions. The three values used in the conditional branches are specially selected to prevent compiler analyses from determining that the condition will always be false: # d e f i n e HEAD ( 0 x f f f f f f f f f f f f f f f 1 − ( 2 ∗ LINE ) ) # d e f i n e TAIL ( 0 x f f f f f f f f f f f f f f f 0 − ( 2 ∗ LINE ) ) # d e f i n e GET RETURN PTR ( ) \ ( ( unsigned int64 ) AddressOfReturnAddress ( ) ) # d e f i n e ANNOTATION( a n n o t a t i o n , n a t i v e c o d e , . . . ) \ do { \ i f ( GET RETURN PTR ( ) > HEAD) { \ e x t e r n c o n s t char ∗ a n n o t a t i o n ## l a b e l ; \ int2c (); \ m p r e f e t c h w ( a n n o t a t i o n ## l a b e l ) ; \ debugbreak ( ) ; \ a n n o t a t i o n ( VA ARGS ) ; \ } else { \ native code ; \ } \ } w h i l e ( GET RETURN PTR ( ) > TAIL )
Listing 2: Annotation macro for 64-bit Microsoft Visual Studio.
• GET RETURN PTR() leverages intrinsic function
AddressOfReturnAddress to obtain a pointer to the return address on the stack.
• HEAD generates an integer larger than any stack address
on 64-bit Windows (the built-in macro LINE is substituted with the source code line number on which the annotation macro is used).
• TAIL generates another such integer that is distinct from
any HEAD in an annotation on any subsequent line in the source file. This prevents ambiguity between the tail of one annotation and the head of the next (even if multiple annotations appear on the same line).
The int2c() serves as a hint to A NNOTATION DR that the preceding branch belongs to an annotation. The first byte of this instruction is distinct from the first byte of any other instruction on x86-64, making it possible to examine just one byte following any direct branch and determine with high accuracy whether it could be part of an annotation. Since the compiler must regard an interrupt similar to a memory fence, the interrupt is guaranteed not to be reordered by compiler optimizations away from the branch instruction. The prefetch of annotation## label is the unique identifier of the annotation, from which A NNOTATION DR determines (1) that the instruction sequence is definitely an annotation, and (2) the name of the annotation function (since there may be no symbol associated with the annotation function call, for example in a stripped binary). The debugbreak() instruction simplifies A NNOTATION DR’s parsing of the annotation by preventing the compiler from interleaving argument setup for the annotation call with the prefetch of the annotation label (since an interrupt is regarded similar to a memory fence). Note that while this definition of the annotation macro is robust in practice on all available versions of Microsoft Visual Studio, it is possible that future versions of the compiler may require the annotation macro definition to be revisited. Listing 3 shows a sample of an annotation compiled in Microsoft Visual Studio 2012. ; i f (GET RETURN PTR( ) > HEAD) 1400019B6 : lea r a x , [ r s p +0C8h ] 1400019BE : cmp r a x , 0 FFFFFFFFFFFFFDEFh 1400019C4 : jbe 1400019 E5 ; a n n o t a t i o n h i n t : byte CD f o l l o w s the branch 1400019C6 : int 2Ch ; a n n o t a t i o n l a b e l ( r e g i s t e r or immediate operand ) 1400019C8 : mov r a x ,< c o n s t a n t > 1400019CF : prefetchw [ rax ] ; i n t 3 i s o l a t e s p r e f e t c h from argument setup 1400019D2 : int 3 ; argument setup code 1400019D3 : mov edx , 1 1400019D8 : mov ecx , [ 1 4 0 0 3 0 1 6 0 h ] ; c a l l annotation log () 1400019DE : call a n n o t a t i o n l o g 1400019 E3 : jmp 1400019 F7 ; native code : c a l l s p r i n t f () 1400019 E5 : mov edx , [ 1 4 0 0 3 0 1 6 0 h ] 1400019EB : lea r c x ,< c o n s t a n t > 1400019 F2 : call p r i n t f ; w h i l e (GET RETURN PTR( ) > TAIL) 1400019 F7 : lea r a x , [ r s p +0C8h ] 1400019 FF : cmp r a x , 0 FFFFFFFFFFFFFDEEh 140001 A05 : ja 1400019B6
Listing 3: Annotation compiled in Visual Studio 2012.
5.
Inference-Based Optimization
The requirement to specially compile the target application with annotations can be avoided by inferring the JIT code regions and instrumenting stores that frequently write to them. This section introduces I NFERENCE DR, an extension of O RIGINAL DR that includes the selective fragment removal from A NNOTATION DR. Parallel Memory Mapping Since there are no annotations to inform I NFERENCE DR about JIT writes, it initially uses the detection scheme from O RIGINAL DR. In addition, for each page A of memory from which dynamic code has been executed, I NFERENCE DR associates a counter cA with A and increments cA on every write fault taken against A. When cA exceeds a configurable threshold (default 12), I NFERENCE DR creates a parallel mapping A0 with writable permission. Since both the original page of memory and the new parallel mapping access the same underlying physical memory, a write to the parallel page is immediately visible for reading at the original page address. Similar parallel mapping techniques appear in recent works [9, 16, 24]. For the current and every subsequent write fault taken against A from writing basic block w, I NFERENCE DR instruments each store instruction s in w with a prologue that (1) identifies each page sp overlapping the address range sr that s is about to write, and (2) queries a hashtable for any page P ∈ sp that has been mapped to a parallel page P 0 . For every such pair hP, P 0 i, the prologue continues: 1. Lookup sr in the fragment overlap hashtable (Sec. 3.3). If any fragments have been translated from sr : (a) Exit to DynamoRIO and flush the stale fragments. 2. Replace sr (in P ) with s0r (in P 0 ) so s can write freely. Virtual Memory
JIT Code Fragments
Code Cache BB
Translate Co de
BB
Read Data
BB
(a)
(b) Write Data
(c) ite Wr
JIT Engine Fragments
ata
e/D
BB
d
a Re
d Co
* *
A
Physical Memory
r-x
ta
(d) e/Da
A
d
Co
(e)
BB Instr BB
Write Code
Instr BB
Write Data
(f)
(g)
A' rw-
Figure 4: Parallel mapping in I NFERENCE DR. Physical page A is mapped both to virtual page A and A0 , such that a write to A0 is equivalent to a write to A.
Figure 4 illustrates a parallel mapping A and A0 , along with reads from A (arrows a, b and e), faulting writes to A (arrows c and d), and instrumented stores to A via A0 (arrows f and g). On deallocation of A, I NFERENCE DR removes both cA and A0 . These techniques combine to (1) eliminate the concurrent writer problem, and (2) avoid redundant invocation of the fragment flushing routine. Eliminating the Concurrent Writer Problem Without annotations, detecting modifications requires not only that writable+executable memory pages be marked read-only, but also that the read-only status be maintained even if the executable permission is removed (until the memory is deallocated). Otherwise code fragments from the entire region would have to be flushed when the pages are set executable again, because any code changes would have gone unseen. This greatly increases the impact of the concurrent writer problem, making it especially significant for all JIT writes to be quickly instrumented with the redirection to the parallel page. Fortunately, large JIT engines tend to be well organized, and we find that a small number of stores are responsible for all the JIT writes. Avoiding Redundant Fragment Flushing Even without the concurrent writer problem, extraneous invocations of the fragment flushing routine will generate significant overhead. The DynamoRIO clean-call facility allows any internal function to be called from the code cache by making a soft context switch, and this facility is used to invoke the same selective fragment flushing routine that was invoked by the annotation in Section 3. While the context switch is relatively efficient (approximately 100 CPU cycles), it becomes a significant expense when invoked for data writes in the JIT code area, which are frequent for highly optimized JITs like V8 and Ion. Redundant fragment flushing also occurs when the JIT overwrites code that was never executed—and hence never translated into the code cache. In both cases, the fragment overlap hashtable will contain no entries for the JIT write span, allowing the flushing clean-call to be skipped. Constructing the Parallel Mapping On Linux it is not generally possible to create the parallel mapping from the target application’s original memory allocation, because a shared memory file descriptor is required to attach the second mapping to the physical memory of the first mapping (a memory allocation is typically made via libc function malloc(), which does not use shared memory). Instead, I N FERENCE DR maps a new shared memory page, copies the contents of the original page to it, and replaces the original page with a new parallel mapping of the copy. In the unusual case that the application has already setup a parallel mapping of its own, it would be possible for I NFERENCE DR to query the OS for the location of the mapping and (if necessary) replace it with a specialized form of our parallel mapping that additionally maintains the application’s original mapping. JIT vs. Trampoline Both of the DGC strategies presented in Sections 3 and 5 are specifically optimized for large JIT engines that generate megabytes of code in a single execution. These optimizations work equally well for smaller JIT engines such as the Microsoft managed runtime, which gen-
512x 256x 128x 64x 32x 16x 8x 4x 2x 1x
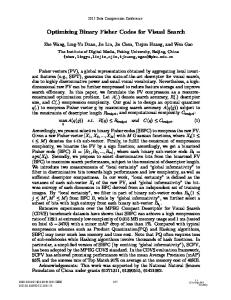
Pin OriginalDR InferenceDR
Richards DeltaBlue Crypto RayTrace EarleyBoyer RegExp Splay NavierStokes PdfJS Mandreel Gameboy CodeLoad Box2D zlib Typescript SplayLatency MandreelLatency GeometricMean
Implicit JIT Code Region Expansion When an instrumented store targets a page that has been marked read-only by I NFERENCE DR for code change detection, the instrumentation is of no advantage—there is no parallel mapping for the page yet, so the concurrent writer problem still requires the entire region to be flushed. Since any instrumented store is already known to write JIT code, it is more likely that any executable page it writes to also contains JIT code. To minimize the overhead of region flushing, I NFERENCE DR eagerly expands the JIT code region to include the written page. I NFERENCE DR additionally avoids the page fault by placing read-only markers in the parallel mapping hashtable, allowing the instrumentation to determine that its store is about to fault, and instead make a clean-call to emulate the write and flush the region.
All reported overheads represent the geometric mean of 3 runs, with P value of the two-tailed Student’s t-test [11] no more than 9.076E-7. The test platform for all benchmarks is Ubuntu 13.04 on an Intel Xeon E3-1245 v3 running at 3.40GHz with 16GB memory and solid state drives. Average iteration time vs native
erates small trampolines to bind application components to system libraries and services at runtime. The trampolines range in size from 4 bytes to roughly 250 basic blocks, so DynamoRIO will in some cases designate those trampoline regions as JIT code regions. While the frequency of code changes in these trampolines is much lower than for a JavaScript JIT engine, the concurrent writer problem has a significant enough impact to warrant parallel mapping the small number of pages occupied by the trampolines.
Benchmark
Evaluation
We evaluated the performance of each optimization stage from O RIGINAL DR to I NFERENCE DR relative to native performance on the Octane and Kraken [22] JavaScript benchmarks for two popular JIT engines, Chrome V8 and Mozilla Ion. We do not report results for SunSpider as it has largely been made obsolete by advances in JITs. We focus on JavaScript JITs because (1) other popular JITs such as Android’s Dalvik and the Microsoft Managed Runtime are not available for our target platform, (2) JITs for higherlevel scripting languages like Lua and PHP do not have well-established performance benchmarks and (3) Java is not especially relevant for DBT because the Java platform has its own ecosystem of tools that operate at the JVM level where interesting information is more readily visible. Table 2 shows both the performance overhead and improvement of each optimization for both Octane and Kraken.
128x 64x 32x 16x
Pin OriginalDR InferenceDR
8x 4x 2x 1x
Richards DeltaBlue Crypto RayTrace EarleyBoyer RegExp Splay NavierStokes PdfJS Mandreel Gameboy CodeLoad Box2D zlib Typescript SplayLatency MandreelLatency GeometricMean
6.
Average iteration time vs native
Figure 5: Optimization performance for Octane on V8.
5.1 Parallel Mapping on Other Platforms The basic technique for parallel mapping on Linux can also be applied for DBT running under Windows, though the procedure is slightly more complex. Allocating memory in Windows is a two stage process that requires first reserving the virtual address space and then committing physical storage to back the virtual address space. One complication is that portions of the reserved memory may be committed separately. Thus when a DBT engine discovers that a given reserve contains JIT code, the straightforward implementation of the DBT would simply copy the entire memory region and perform the parallel remapping. We expect that I NFER ENCE DR would port naturally to Mac OS X, which is based on Linux and supported by O RIGINAL DR.
Benchmark
Figure 6: Optimization performance for Octane on Ion.
Performance Improvement Figures 5 and 6 show the speedup of I NFERENCE DR over O RIGINAL DR and Pin (the performance of A NNOTATION DR with selective fragment removal is nearly identical to I NFERENCE DR). While our technique is applicable to DBT in general, other platforms such as QEMU and Valgrind are omitted from these results because they incur enough other overhead that DGC handling is not a bottleneck. Librando reports 3.5× overhead on Octane to randomize the V8 output for improved security. We focus our comparison on Octane here, but the relative performance of Pin is similar on Kraken.
Octane Suite Chrome V8 O RIGINAL DR A NNOTATION DR + VM Area Isolation A NNOTATION DR + Fragment Removal I NFERENCE DR Native
Kraken Suite Mozilla Ion
Chrome V8
Mozilla Ion
Score 2271
Overhead 15.80×
Speedup -
Score 7185
Overhead 4.36×
Speedup -
Time 119s
Overhead 9.08×
Speedup -
Time 36s
Overhead 3.25×
Speedup -
9514
3.77×
4.19×
11914
2.63×
1.66×
35s
2.67×
3.4×
24s
2.14×
1.5×
14532
2.47×
6.40×
13797
2.27×
1.92×
24s
1.87×
4.96×
22s
1.95×
1.64×
14257 35889
2.52× -
6.28× -
14589 31340
2.15× -
2.03× -
23s 13s
1.78× -
5.17× -
23s 11s
2.11× -
1.57× -
Table 2: Performance improvement through several stages of DynamoRIO JIT optimization, as demonstrated in the Octane and Kraken JavaScript benchmark suites for both Chrome V8 and Mozilla Ion. Overhead is relative to native, and speedup is relative to O RIGINAL DR.
Figures 5 and 6 additionally illustrate that I NFERENCE DR performs much better on some benchmarks in the Octane suite than others. Runtime analysis reveals that the benchmarks for which I NFERENCE DR performs best are getting the most mileage out of their compiled code, whereas more cumbersome benchmarks like CodeLoad and Typescript compile more code and execute it fewer times. The worst case for I NFERENCE DR is the two latency scores, which report special measurements taken during the execution of Splay and Mandreel. SplayLatency isolates garbage collection time, while MandreelLatency individually times compile-intensive operations and squares the duration of each timed event before accumulation to penalize delays during these operations. This creates a worst-case scenario for I NFERENCE DR, since its overhead is incurred during the operations that are penalized for latency. Comparison of Approaches While I NFERENCE DR and A NNOTATION DR offer similar performance, they minimize overhead in slightly different ways. Both approaches are able to isolate the specific code fragments that are modified by a JIT write, but only I NFERENCE DR is able to avoid exiting the code cache in the common case that the JIT modifies or removes code that was never translated. Since a single store instruction only modifies a small number of bytes, the I N FERENCE DR instrumentation can easily query the hashtable of overlapping code fragments from within the code cache. But the annotation may specify a JIT write spanning many pages of memory, making it significantly more complex (though not impossible) to perform the overlap check from within the code cache. This weakness in A NNOTATION DR is also its advantage, because it can remove a very large span of stale code fragments during a single cache exit. For example, Chrome V8 often generates several pages of code into a non-executable buffer and then copies it into the JIT code area. Since I NFERENCE DR instruments low-level store instructions in the memcpy function, it must invoke the flush operation for each 16-byte write. Furthermore, shared functions like memcpy are used for many purposes other than copying JIT code, so while the overlap check is very efficient, the vast majority of overlap checks for the memcpy stores find no fragments to flush. Conversely, since the annotation of the JIT copy function is placed at a much higher level within the JIT code, A NNOTATION DR is able to flush the entire set of pages in a single exit of the code cache.
While the annotations represent a contribution in themselves, A NNOTATION DR would typically only be preferable in a scenario where I NFERENCE DR is not feasible, since they offer similar performance. One example of such a scenario is that I NFERENCE DR may not be fully compatible with 32-bit applications that can consume large amounts of memory, because during a memory-intensive execution there may not be sufficient address space to construct the parallel memory mappings. There is also a special case on the 32-bit Windows platform in which the application could initially allocate all of its memory in one very large reserve, requiring I NFERENCE DR to double-map the entire reserve (Section 5.1)—which may not be possible in the 4GB address space of a 32-bit process. Should this become an issue, the user can choose to either (1) avoid such large workloads when running under the DBT tool, or (2) annotate the application and use A NNOTATION DR. Another consideration is security—the presence of the parallel mapping in virtual memory makes it possible for an adversary to write to the JIT code region undetected by the DBT. This could potentially create a vulnerability for a security-focused client of I NFERENCE DR that needs to receive notifications of all DGC writes. Since protecting the parallel mappings inevitably creates additional overhead, A NNOTATION DR may be the better alternative. Annotation Developer Effort The amount of work required to annotate a target application varies. Annotating Ion required a complex runtime analysis to place 17 annotations. V8 was much easier because it is designed for portability to platforms that require an explicit i-cache flush—we only needed to annotate the global flush function in one place, and memory handling functions in 4 places, all of which were easy to find with no runtime analysis. For builds of V8 having Valgrind annotations enabled, A NNOTATION DR can use the existing Valgrind annotation of the i-cache flush function, making the integration that much easier. Space Overhead Both optimization approaches maintain hashtables that consume up to 2× the total size of all live DGC fragments, which is a moderate overhead in comparison to application data. I NFERENCE DR additionally doubles the number of virtual memory mappings required for JIT code regions, but this does not increase physical memory usage (beyond OS accounting for the mappings).
SPEC CPU 2006 SPEC Int SPEC fp O RIGINAL DR 12.27% 17.73% 8.60% I NFERENCE DR 12.35% 17.88% 8.60% Table 3: I NFERENCE DR does not increase overhead for normal applications that do not dynamically generate code. A NNOTA TION DR is omitted because I NFERENCE DR includes annotation detection (for the benefit of tools).
Negligible Side Effects We show that the optimization does not negatively impact the performance of DynamoRIO on normal applications by evaluating I NFERENCE DR relative to O RIGINAL DR on the SPEC CPU 2006 benchmark suite (Table 3). The SPEC CPU 2006 benchmarks include a broad range of applications written in C, C++, and Fortran, but does not include any dynamically generated code.
7.
[10] [11] [12]
[13] [14]
Conclusion
Dynamically generated code has become commonplace in modern applications. Previous approaches to maintaining consistency between dynamically generated code and their cached copies introduced significant overhead into dynamic binary translation systems. We present two new approaches that enable dynamic binary translation systems to efficiently support dynamically generated code. Our benchmark results show that both approaches significantly improve on the state of the art by factors as high as 7.3× over state-of-the-art DBT systems, enabling these systems to support dynamically generated code with reasonably low overheads.
8.
[9]
Acknowledgments
We thank Google for their support of this project through the Summer of Code program. We also thank Peter Maydell, Nitzan Mor-Sarid, Andrei Homescu, Ian Schweer, and the anonymous reviewers for their informative and insightful comments. This project was partly supported by the National Science Foundation under grants CCF-0846195, CCF1217854, CNS-1228995, and CCF-1319786.
References [1] F. Bellard. QEMU, a fast and portable dynamic translator. In USENIX Annual Technical Conference, 2005. [2] D. Bruening. Efficient, Transparent and Comprehensive Runtime Code Manipulation. PhD thesis, MIT, 2004. [3] D. Bruening and S. Amarasinghe. Maintaining consistency and bounding capacity of software code caches. In IEEE/ACM Symp. on Code Generation and Optimization, 2005. [4] D. Bruening and Q. Zhao. Practical memory checking with Dr. Memory. In IEEE/ACM Symp. on Code Generation and Optimization, 2011. [5] D. Bruening, Q. Zhao, and S. Amarasinghe. Transparent dynamic instrumentation. In ACM Conf. on Virtual Execution Environments, 2012. [6] S. Cazzulani. Octane: The JavaScript benchmark suite for the modern web. http://blog.chromium.org/2012/ 08/octane-javascript-benchmark-suite-for.html, 2012. [7] W. Cheng, Q. Zhao, B. Yu, and S. Hiroshige. TaintTrace: Efficient flow tracing with dynamic binary rewriting. In IEEE Symp. on Computers and Communications, 2006. [8] J. C. Dehnert, B. K. Grant, J. P. Banning, R. Johnson, T. Kistler, A. Klaiber, and J. Mattson. The Transmeta Code
[15] [16] [17]
[18] [19]
[20] [21] [22] [23]
[24] [25] [26] [27]
[28] [29]
Morphing SoftwareTM : Using speculation, recovery, and adaptive retranslation to address real-life challenges. In IEEE/ACM Symp. on Code Generation and Optimization, 2003. D. Dhurjati and V. Adve. Efficiently detecting all dangling pointer uses in production servers. In IEEE/IFIP Conf. on Dependable Systems and Networks, 2006. Google, Inc. V8 JavaScript engine. https://code.google. com/p/v8/, 2014. W. S. Gosset. The probable error of a mean. Biometrika, 6(1), 1908. A. Homescu, S. Brunthaler, P. Larsen, and M. Franz. Librando: transparent code randomization for just-in-time compilers. In ACM Conf. on Computer & Communications Security, 2013. D. Keppel. A portable interface for on-the-fly instruction space modification. In ACM Conf. on Architectural Support for Programming Languages and Operating Systems, 1991. D. Keppel. How to detect self-modifying code during instruction-set simulation. In IEEE/ACM Workshop on Architectural and Microarchitectural Support for Binary Translation, 2009. V. Kiriansky, D. Bruening, and S. Amarasinghe. Secure execution via program shepherding. In USENIX Security, 2002. J. Li, C. Wu, and W.-C. Hsu. Dynamic register promotion of stack variables. In IEEE/ACM Symp. on Code Generation and Optimization, 2011. C.-K. Luk, R. Cohn, R. Muth, H. Patil, A. Klauser, G. Lowney, S. Wallace, V. J. Reddi, and K. Hazelwood. Pin: Building customized program analysis tools with dynamic instrumentation. In ACM Conf. on Programming Language Design and Implementation, 2005. P. Maydell. Inquiry, QEMU developer’s email list. http://lists.gnu.org/archive/html/qemu-devel/ 2014-08/msg05142.html, 2014. Microsoft. A detailed description of the data execution prevention (DEP) feature in Windows XP Service Pack 2, Windows XP Tablet PC Edition 2005, and Windows Server 2003. support.microsoft.com/kb/875352. N. Mor-Sarid. Inquiry, Pinheads email list. https: //groups.yahoo.com/neo/groups/pinheads/ conversations/messages/10959, 2014. Mozilla. IonMonkey. https://wiki.mozilla.org/ IonMonkey, 2014. Mozilla. Kraken JavaScript benchmark (version 1.1). http: //krakenbenchmark.mozilla.org/, 2014. N. Nethercote and J. Seward. Valgrind: A framework for heavyweight dynamic binary instrumentation. In ACM Conf. on Programming Language Design and Implementation, 2007. B. Niu and G. Tan. Rockjit: Securing just-in-time compilation using modular control-flow integrity. In ACM Conf. on Computer and Communications Security, 2014. K. Serebryany and T. Iskhodzhanov. Threadsanitizer: Data race detection in practice. In ACM Workshop on Binary Instrumentation and Applications, 2009. J. Seward and N. Nethercote. Using Valgrind to detect undefined value errors with bit-precision. In USENIX Annual Technical Conference, 2005. D. Song, D. Brumley, H. Yin, J. Caballero, I. Jager, M. G. Kang, Z. Liang, J. Newsome, P. Poosankam, and P. Saxena. BitBlaze: A new approach to computer security via binary analysis. In IEEE International Conf. on Information Systems Security, 2008. Standard Performance Evaluation Corporation. SPEC CPU2006 benchmark suite, 2006. http://www.spec.org/osg/cpu2006/. TSan. ThreadSanitizer wiki. https://code.google.com/ p/data-race-test/source/browse/trunk/dynamic\ _annotations/dynamic\_annotations.h, 2014.