Albanian j. agric. sci. 2013;12 (4): 565-570
Agricultural University of Tirana
(Open Access)
RESEARCH ARTICLE
Metabolic profile and reproduction performance in cows during the puerperal period ILIR DOVA1 ANA KAPAJ 2 ENKELEDA OZUNI 1 STELA PAPA3 1
Faculty of Veterinary Medicine, Agricultural University of Tirana, Albania
2
Faculty of Economy and Agribusiness, Agricultural University of Tirana, Tirana, Albania
3
Faculty of Natural Sciences, University of Tirana, Tirana, Albania
Abstract: The relationship between metabolic profile in cows and the efficiency of reproduction performance involves an integrated complex of the endocrine system as well as the metabolic signals that control the metabolism and the reproduction process in cows. The number services per conception in cows has proven statistically correlative connections with inorganic phosphorus, magnesium and glucose in the before calving period, but there are not proven statistically connections with other metabolic indicators in the same period. In the period about two weeks after calving there is only one statistically proven connection with magnesium in blood serum. Meanwhile in the period of one month after calving there is one connection statistically proved, with glucose, and in the two months after calving period there is a statistically proven connection only with the urea.
Correlative relationships of metabolic indicators taken for study during the calving conception interval indicate that the correlations are weak and statistically unproved in these fourth physiological states. Keywords: metabolic indicators, reproductive performance, glucose, urea, total calcium
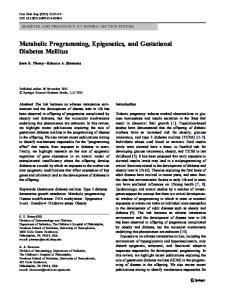
1. Introduction The transition from the impregnated period in the lactation period is associated by drastic changes in the matter of cow metabolism. A significant growth to fulfill the needs for metabolites in the milk synthesis occurs during this period. This requirement becomes even more apparent when a food supply in cows is low. Consequently we deal with a matter mobilization from reserve tissues, particularly from the adipose tissue. The relationship between metabolic profile in cows and the efficiency of reproduction processes involves an integrated complex of the endocrine system as well as the metabolic signals that control the matter metabolism and the reproduction process in cows. Different hormones play the primary, regulatory and integration role in this complex. Nutrition integration, the metabolic processes with hormones and the reproduction is shown in Fig. 1 [5]. These hormones in a back-feed mechanism control food feeding, mammalian gland function and the whole body reproduction system in cattle. GH and free fatty acids (Ayl) are antagonistic to insulin action and in this way they give rise to a new state of insulinresistance in the moment when it is related with its specific receptors in the after calving period. [11].
Insulin resistance inhibits insulin depending transporting systems for glucose and conserves glucose for lactose synthesis as well as for the synthesis of fatty acids in milk composition. Thus, insulin-resistance restricts the amino acids trans membrane transport and consequently it is inhibited the protein synthesis in extra mammalian cells, meanwhile it is stimulated the milk protein synthesis. Therefore, Insulin and IGF receptors act directly in their ovarian receptors, increasing their sensitivity to FSH and LH in ovary and in the uterus [14]. Metabolites have an important but temporary role in their combination with reproductive hormones, especially during the dry period which is closely related to the impact on the BCS especially in the before calving period. Glucose and AYL are really active playing this role, which exercise their action through both somatothropic and gonadothropic axis. However, this mechanism still remains to be clarified [6]. Usually, cows with a negative energy balance have an 1A receptor inhibition of the ‘GH’ by reducing the insulin level in blood circulation [13,4]. This phenomenon results in a decrease of the IGF-1 synthesis in the liver. IFG-1 reduction in blood circulation will be associated with the reduced follicles sensitivity to LH, GH and steroid genesis [9].
Correspondence: Ilir Dova, Faculty of Veterinary Medicine, Agricultural University of Tirana, Albania, Affiliation; Email:
[email protected] (Accepted for publication 5 June 2013) ISSN: 2218-2020, © Agricultural University of Tirana
Dova et al
The follicular growth inhibition and the Estradiol synthesis leads to a failure of ovulation or it may also
affect the quality of the mature oocite. This will definitely lead to an estrus or egg fertilization failure.
Figure1: The regulatory feedback system that controls the reproductive axis (shaded area A) and the GH axis (area B) interact on several levels and thus they connect the intake of food, the metabolic homeostasis with reproduction processes. [13].
2. Materials and methods We took 30 cows in our study in 4 different physiological conditions (2 weeks before calving, 2 weeks after calving, 1 month after calving and 2 months after calving). So, we preleased blood from jugular vein of cows. After separating the serum we realized the determination of metabolic indicators (general protein, standard bicarbonate, inorganic phosphor, urea, glucose, total calcium and magnesium). We noted the calving conception interval and the number services to conception until it was achieved the cow’s fertilization. Based on these data it was determined the number of services to conception. The metabolic indicators data and the reproductive performance were statistically processed by counting the multiple factorial regression equation. The calculation data was made with ANOVA method, and the Excel software program.
3. Results and discussion The energy concepts and nitrogenous substances in the late calving period are mainly associated with the glucose and amino acids obtaining from the fetus. In this way, facing the requirements for these two metabolites is closely related with food provision and the regulation of metabolic pathways in such manners that ensure their needs, which grow 30-50% in the pre-relevance period [2]. This includes the neoglucogenesis intensification, and the increase of 566
amino acids synthesis in the rumen and their absorption in intestine. The needs for amino acids, glucose and fatty acids in the breast, within 4 days after calving, grow several times compared to the before calving period. This will lead to a decrease of entering the glucose in the metabolic pathways, also the decrease of entering the amino acids in the peripheral organs and tissues. This also will lead to a decrease of entering lactose, proteins and fats in the synthesis pathways in breast milk. In this period the insulin receptor "resistance" to associate with insulin, a characteristic for the period of pregnancy gradually begins to decrease until it is eliminated entirely. Consequently homeostatic mechanisms of glucose and protein begin to improve [3]. We were trying to accomplish relationships that exist between the metabolic indicators of reproductive performance in cows, in this physiological period. The data for the correlative relationships of metabolic indicator with the calving conception interval and the numbers of services per conception in four physiological states are shown in Tables 1 and 2.
Data in Table 1 represent correlative relationships of metabolic indicators taken in our study during the calving conception interval. These data indicate that the correlations are weak and statistically unproved in these four periods studied. The conclusions achieved in the study of [1] lead that the impact side of total proteins and total calcium are on the same side as our results.
Metabolic profile and reproduction performance in cows during the puerperal period
But the bonding strength in our study is small and statistically unproved. The level of inorganic phosphorus in our study has a positive impact on the level of calving conception interval meanwhile in the study of [1] it has a negative impact on calving conception interval level. This seems related to the comprehensive analysis performed by [1] and the analysis according to the physiological conditions. This is evident in the fact that in one month after calving period and in two months after calving period the impact in our study results positive. So, while studying certain metabolites in the puerperal period, [12] notes that the studied
cows. Glucose, on the other side, has a critical effect on the oocites maturation and blastocites development, but its impact on the calving conception interval is controversial [13]. The calcium
concentration affects negatively in the first stage of before and after calving period, meanwhile it affects totally positively in one month after calving periods [8]. This phenomenon is consistent with our data. The same data already studied in the U.S. claim that hypocalcaemia is noted in almost 25-41% of cows. This condition leads in negative implications on the cow uterus health [13].
metabolic indicators are correlatively related by a weak bond with the calving conception interval in Table 1: Correlations between calving conception interval and metabolic indicators in cows General proteins
Standard bicarbonate
Inorganic phosphor
Glucose
Urea
General Ca
Mg
Two weeks before calving
-0.07
-0.08
0.11
-0.23
-0.06
-0.09
0.03
Two weeks after calving
-0.18
-0.05
0.17
0.03
0.2
-0.14
0.28
One month after calving
0.05
-0.19
-0.02
0.27
0.19
0.06
0.18
Two months after calving
0.09
-0.05
0.27
0.21
-0.12
0.05
0.05
Table 2: Correlations between the number services per conception and blood indicators in cows Total proteins
Standard bicarbonate
Inorganic phosphor
Glucose
Urea
General Ca I
Mg
Two weeks before calving
-0.26
0.18
0.6a
0.51a
-0.22
0.24
-0.39c
Two weeks after calving
-0.18
-.005
0.064
0.03
0.23
-0.05
0.34c
One month after calving
0.12
-0.15
0.02
0.31c
0.23
0.15
0.3
Two months after calving
0.007
0.2
0.08
0.27
-0.34c
0.18
-0.03
. Table 3: Multiple regression (Multiple R) of calving conception interval and numbers of services per conception with metabolic indicator according to physiological condition in cow. 2 weeks before calving
2 weeks after calving
One month after calving
Two months after calving
Multiple R of calving conception interval
0.44
0.41
0.38
0.34
Multiple R of numbers of services per conception
0.4
0.54
0.46
0.42
Data in Table 2 shows that the number of services per conception in cows has correlative connections with inorganic phosphorus, magnesium and glucose in the before calving period, but there are not proven statistically connections with other metabolic indicators in the same period. In the period about two weeks after calving there is only one statistically proved connection with magnesium in 567
blood serum. Meanwhile in the period of one month after calving there is one connection statistically proved, with glucose, and in the two months after calving period there is a statistically proven connection only with urea. The correlative connections in all physiological periods after calving are weak. This confirms the conclusion reached by other studies that the reproductive performance have
Dova et al
relations only to the metabolic profile on before calving period [7]. Data in Table 3 represent the multiple regression of the calving conception intervals with metabolic indicators that appear higher in two weeks before calving and in two weeks after calving and lower in two other phisiological periods. The multiple regression with the numbers of services per conception appear almost identical in all the physiological condition taken in the study . Relations between metabolic indicators of blood serum and reproductive performance are also presented in multiple regression equations: Two weeks before calving period, the multiple regression equation is presented: Calving conception interval=188.9-15X1 +0.14X2 +5.25X3 -1.32X4 -1.24X5 +0.01X6 +17.18X7 R2 =0.2 F log=0.7 P=0.67 The data presented in the multiple regression equation between calving conception interval and blood indicators for the 2 week before calving the coefficient that defines the equation (R2) does not have a statistical validity (P= 0.67). The variable depending coefficients affect the calving conception interval generally in the same direction that we found during our calculation of the correlation coefficient, where the only exception is the standard bicarbonate and the general level of calcium. Two weeks after calving period, the multiple regression equation is presented: Calving conception interval =95.48-7.67X1 0.069X2 + 2.83X3 + 0.07X4 + 0.67X5 – 1.94X6 + 26.78X7
R2 =0.17 Flog=0.55 P= 0.79 The multiple regression data show that the accounted equation is not confirmed statistically (P=0.79). Three of the studied variables actually affect the shortening of our calving conception interval, while the other four variables have a positive impact, thus affecting the duration of the period. One
month
after
calving
the
multiple
regression equation is presented: Calving conception interval = 97.12 – 7.73X10.075X2 + 2.7X3 + 0.004X4 + 0.58X5 – 1.6X6 + 27.14X7 R2 =0.29 Flog= 0.98 P=0.47 Also this equation is not confirmed statistically (P = 0:47).The determining variables of the calving 568
conception intervals have different impacts on the calving conception interval. General proteins have a significant impact in the reduction of the calving interval, while the standard bicarbonate and the general calcium have a low impact in the extension of the calving conception interval. On the other side, the level of inorganic phosphorus, glucose, urea and magnesium has a weak influence on the extension of the calving conception interval. Two
month
after
calving
the
multiple
regression equation is presented: Calving conception interval = 11.01 – 2.08X1 – 0.17X2 + 3.32X3 – 0.13X4 – 0.98X5 + 11.46X6 + 27.29X7 R2 = 0.12 Flog=0.34 P=0.92 The variables impact of the blood indicators studied in their complex offer us a slight impact but unproved statistically (P = 0.92). We note that in this physiological condition the total proteins, standard bicarbonate, glucose and urea affect the shortening of the calving conception interval, meanwhile the other indicators influence the duration of the calving conception interval. The relations between the numbers of services to conception with the metabolic indicators of blood serum are shown in the equation. Two weeks before calving period, the multiple regression equation is presented: Numbers of services per conception =2.65 – 0.4X1 + 0.003X2 + 0.42X3 + 0.052X4 -0.048X5 – 0.05X6 + 0.06X7 R2=0.7 Flog=6.34 P=0.006 The data of multiple regression assert the
achieved conclusion from [4, 13] that low levels of metabolic indicators in the before calving period is closely related with the feeding condition of after calving period. Therefore, it has a strong connection with fertility in cows. Two weeks after calving period the multiple regression equation is presented: Numbers of services per conception =2.4 – 0.42X1 + 0.005X2 – 0.03X3 + 0.028X4 + 0.03X5+ 0.016X6 + 1.4X7 R2=0.29 Flog= 1.04 P=0.44 In the two weeks after calving period, the multiple regression equation results statistically unproved (P = 0:44), a fact that indicates that only 44% of the defined connections by the equation are realized by the interaction of all blood indicators,
Metabolic profile and reproduction performance in cows during the puerperal period
while the rest is totally influenced by other factors. The coefficient which determines the equation is 0:29 (R2 = 0:29).
connections in all physiological periods after calving are weak. •
Correlations between calving conception interval and metabolic indicators in cows. The data indicate that the correlations are weak and statistically unproved in these fourth physiological periods studied.
•
Multiple regression equation between the numbers of services per conception and the metabolic indicators in blood serum are diminished by passing from one physiological period to another. This indicates a proved impact during two weeks before calving in other periods is not proved statistically. Multiple regression equation between the calving conception interval and the metabolic indicators in blood serum are not proved statistically in fourth physiological periods taken for study.
One month after calving period the multiple regression equation is presented: Numbers of services per conception =-0.61– 0.06X1+0.0012X2–0.15X3+0.026X4+0.0001X5 + 0.24X6 + 0.081X7 R2=0.21 Flog = 0.69 P=0.7 During the one month after calving period, the calculated equation for determining the impact of all blood indicators has not a statistical validity (P = 0.7). This indicates that only 70% of the impact is realized by blood indicators while the rest comes from other factors. The coefficient of determination is 00:21 (R2 = 0:21). Two months after calving period the multiple regression equation is presented: Numbers of services per conception =-0.34 – 0.26X1 + 0.0015X2 +0.21X3- 0.11X4 + 0.06X5 + 0.55X6 + 1.23X7 R2=0.18 Flog = 0.57 P=0.77 Data probability of the multiple regression equation between the numbers of services per conception and the metabolic indicators of blood serum are diminished by passing from one physiological period to another. This indicates a proved impact of the equation (P = 0.006) during the two week before calving period. The equations are certainly false in three other periods of our physiological periods obtained in the study. The probability fluctuates from P = 0:44 in the period two weeks after calving up to P = 0.77 in two months after calving period.
4. Conclusions The correlative and regressive analysis between reproductive performance and metabolic indicators allow us to conclude: • Correlations between the number services per conception and metabolic indicators in two weeks before calving, correlations statistically are proved with the inorganic phosphorus, glucose and magnesium in blood serum .Correlations in two weeks after calving is proved with magnesium. One month after calving correlation is proved with glucose and two month after calving is proved with urea. Correlative
569
•
5. References 1. Aliko H: Përcaktimi I profilit metabolik normal në kategoritë gjedhit të racës “Laramane e zezë”.1979, Disertation for PhD. 2. Bell AW: Regulation of organic nutrient metabolism during transition from late pregnancy to early lactation. J.Animal Sci.,1995, 73(9), 2804-2819 3. Bisinotto RS, Greco LF, Ribeiro ES, Martinez N, Lima FS, Staples CR, Thatcher WW, Santos JEP: Influence of nutrition and metabolism on fertility of dairy cows. Anim. Reprod.,2012,Vol.9, Nr.3 260-272 4. Buttler ST, Pelton SH, Buttler WR: Insulin increases 17 β estradiol production by dominant follicule of the first postapartum follicule wave. Reproduction.,2004, 127:537545. 5. Chagas LM, Bass JJ, Blanche D, Burke CR, Kay JK, Lindsay DR, Lucy MC, Martin GB, Meier S, Rhodes FM, Roche JR, Thatcher WW, Webb R(2007): Invited Review:New Prespectives on roles of Nutrition and metabolic priorites in the subfertility of High producing dairy cows. J.Dairy Sci.,2007, 90:4022-32 6. Chagas LM, Rhodes FM, Blanche D, Gore PJS, Macdonald KA, Verker GA: Precalving feeding and body condition effects on metabolic response and postpartum anestrus interval in grazing primiparus dairy cows. J.Dairy Sci.,2006, 89:1981-1989. 7. Jorritisma R, Wensing T, Kruip AM, Vos LAM, Jos P.T.M. Noordhuizen: Metabolic change in
Dova et al
early lactation and impaired reproductive performance in dairy cows. Vet. Res.,2003, 34: 11-26.
11. Lucy MC: Mechanism linking nutrition and reproduction in postpartum cows. Reproduction.,2003, 61:415-427.
8. Lewis RS: Calcium signaling mechanism in T lymphocytes. Ann. Rev. Imunol.,2001, 19: 497521
12. Onita P, Colibar O: Energy, protein and mineral profile in peripartial period at dairy cows. Lucrari Scientific Medicina Veterinaria XLII(2), Timisoara.,2009.
9. Lucy MC, Beck J, Staples CR, Head HH, De La Sota RL, Thatcher WW: Follicular dynamics plasma metabolites, hormones and insulin-like growth factor1(IGF-1) in lacting cows with positive or negative energy balance during preovulatory period. Reprod. Nutr. Dev.,1992, 32: 331-341. 10. Lucy MC: Fertility in high-producting dairy cows. Reason of decline and corrective strategies for substainable improvement. Reprod. Suppl,2007, 64:237-254
570
13. Santos JEP, Bisinoto RS, Ribeiro ES, Lima FS, Thatcher WW: Impacts of Metabolism and nutrition during the transition period on fertility of dairy cows. High plains dairy Conference Amarillo, Texas.,2012. 14. Watson AJ, Westhusin ME , Winger QA: IGF, paracrine and autocrine interactions between conceptus and oviduct. J.Reprod. Fertility. Suppl.,1999, 54: 303-315.