Economica (2017) 84, 239–260 doi:10.1111/ecca.12233
On the Share of Inheritance in Aggregate Wealth: Europe and the USA, 1900–2010 By FACUNDO ALVAREDO†, ‡, BERTRAND GARBINTI†† and THOMAS PIKETTY† †Paris School of Economics
‡INET at Oxford and CONICET
††Banque de France and CREST
Final version received 13 February 2017. This paper provides historical series on the evolution of the share of inherited wealth in aggregate private wealth in Europe (France, the UK, Germany, Sweden) and the USA over the 1900–2010 period. Until 1910, the inheritance share was very high in Europe (70–80%). It then fell abruptly following the 1914–45 shocks, down to about 30–40% during the 1950–80 period, and is back to 50–60% (and rising) since around 2010. The US pattern also appears to be U-shaped, albeit less marked, and with significant uncertainty regarding recent trends, due to data limitations. We discuss possible interpretations for these long-run patterns.
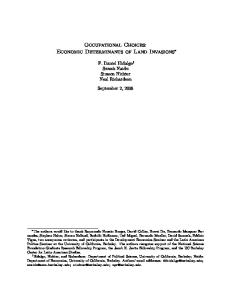
INTRODUCTION There exists substantial uncertainty regarding the relative magnitude of inherited wealth and self-made wealth in aggregate wealth accumulation, and how this changes over time and across countries. The 1980s saw a famous controversy between Modigliani (a strong lifecycle advocate, who argued that the share of inherited wealth was as little as 20–30% of US aggregate wealth) and Kotlikoff–Summers (who instead argued that the inheritance share was as large as 80%, if not larger). Particularly confusing was the fact that both sides claimed to look at the same data, namely US data from the 1960s and 1970s.1 The disagreement came both from the lack of adequate long-run series on inheritance, and from definitional issues. In this paper we attempt to provide a clearer conceptual framework as well as better data series in order to estimate and compare the evolution of the inheritance share in aggregate wealth in Europe and the USA over the 1900–2010 period. We should stress at the onset that although our estimates represent an improvement on the previous literature, they should still be viewed as tentative and exploratory. The broad patterns and orders of magnitude that we find appear to be robust, but one would need to collect additional historical data from inheritance and probate archives in order to be able to better understand some of the finer evolutions as well as the similarities and differences between countries. Our main findings are summarized in Figure 1. The inheritance share in aggregate wealth accumulation was very high in Europe during the 19th century and until the First World War (over 70% around 1900–10, and possibly even more than 80% in some countries). It then fell abruptly following the 1914–45 capital shocks (destructions, inflation, taxation). Around 1970–80, the share of inherited wealth was less than 40%. It has been rising substantially in recent decades, and it seems to be about 50–60% (and rising) in 2000–10. The US pattern also appears to be U-shaped, albeit less markedly. The inheritance share in aggregate wealth accumulation was lower in the USA than in Europe in the 19th century and on the eve of the First World War (less than 60% in the USA vs. over 70% in Europe). This certainly reflects a ‘new world’ effect (the migrants usually did not come with much inheritance, and had to save on their own). However the US © 2017 The London School of Economics and Political Science. Published by Blackwell Publishing, 9600 Garsington Road, Oxford OX4 2DQ, UK and 350 Main St, Malden, MA 02148, USA
Stock of inherited wealth (% private wealth)
240
[APRIL
ECONOMICA
80% Europe (FranceGermany-UK) USA (benchmark estimate) USA (high-gift estimate)
70%
60%
50%
40%
30% 1900
1910
1920
1930
1940
1950
1960
1970
1980
1990
2000
2010
FIGURE 1. Share of inherited wealth, Europe and the USA 1900–2010. Notes: Simplified definitions using inheritance vs. saving flows; approximate lower-bound estimates. The inheritance share in aggregate wealth accumulation was over 70% in Europe in 1900–10. It fell abruptly following 1914–45 shocks, down to 40% in the 1970–80 period. It was back to about 50–60% (and rising) in 2000–10. The US pattern also appears to be U-shaped but less marked, and with significant uncertainty regarding recent trends, due to data limitations.
inheritance share was rising fast in the late 19th and early 20th centuries. The shocks caused by the 1930s and the Second World War led to a downturn, but much less pronounced than in Europe, so the US inheritance share became higher than in Europe by the mid-20th century. In recent decades, the inheritance share seems to have increased substantially in the USA. However, there is significant uncertainty about the exact levels and trends, due in particular to the limitations of US estate tax data (which covers only a small fraction of all decedents, so it cannot be used to produce aggregate series). We should also emphasize that there are significant variations within Europe. For simplicity, we define ‘Europe’ in Figure 1 as the average of France, Germany and the UK.2 We will see later that France and Germany follow a particulary marked U-shaped pattern, while the UK pattern is in some ways closer to the US evolution. In brief, our general conclusion is that there are substantial variations in the inheritance share over time and across countries, and that one should be careful not to interpret averages over one or two decades as steady-state outcomes. Wealth accumulation takes time: it spans over several generations, so it is important to take a very-long-run perspective on these issues. Modigliani’s conclusions—with a large majority of wealth coming from lifecycle savings—might have been right for the immediate postwar period (though somewhat exaggerated). But the Kotlikoff–Summers estimates—with inheritance accounting for a significant majority of wealth—appear to be closer to what we generally observe in the long run, in both the 19th and early 20th centuries, and in the late 20th and early 21st centuries. Regarding the very long run, we stress that there are many different possible steadystate levels for the inheritance share. As we will see, there are several forces that tend to imply that low-growth societies also have higher inheritance shares. But other effects can go in the opposite direction. Depending on the evolution of demographic parameters, Economica © 2017 The London School of Economics and Political Science
2017]
SHARE OF INHERITANCE IN AGGREGATE WEALTH
241
social tastes for leaving bequests, the generosity of public pensions systems, and so on, one can observe very different equilibrium levels for the inheritance share in different countries. The rest of the paper is organized as follows. In Section I, we discuss the concepts, methods and data sources that we use in order to estimate the share of inherited wealth in aggregate wealth accumulation. We propose a simplified definition of the inheritance share (based on the comparison of inheritance flows and saving flows). This can be implemented with much fewer data than a full-fledged microdata-based definition. The resulting estimates should be considered as lower bound estimates. However, they appear to track down relatively well the more sophisticated estimates. In Section II, we present our main results, starting with European countries, then moving to the US case. In Section III, we discuss open issues and prospects for future research. I. CONCEPTS, DATA SOURCES AND METHODS Here we summarize and clarify the main conceptual and methodological issues related to the measurement of the aggregate inheritance share. The discussion below builds on some of the material presented in Piketty and Zucman (2015), in which we also discuss the determinants of long-run wealth–income ratios and steady-state wealth inequality. We refer interested readers to this paper, as well as to Piketty, Postel-Vinay and Rosenthal (2014), for a more detailed discussion of these related issues. Basic notions and definitions The most natural way to define the share of inherited wealth in aggregate wealth is to cumulate past inheritance flows. That is, assume that we observe the aggregate wealth stock Wt at time t in a given country, and that we would like to define and estimate the aggregate inherited wealth stock WBt. We view WBt as the fraction of aggregate wealth that can be attributed to inheritance, so by definition WBt must be such that WBt ≤ Wt. Conversely, we define aggregate self-made wealth WSt as the fraction of aggregate wealth that cannot be attributed to inheritance: WSt = Wt�WBt. Assume that we observe the annual flow of inheritance Bs that occurred in any year s ≤ t. At first sight, it might seem natural to define the stock of inherited wealth WBt as the sum of past inheritance flows: Z WBt ¼
s�t
Bs � ds:
However, there are several practical and conceptual difficulties with this ambiguous definition, which need to be addressed before the formula can be applied to actual data. First, one obviously needs to apply some proper price deflator to past inheritance flows, so that one can ignore price inflation (which in general could be different for capital goods and other goods; more on this below). Next, it is critical to include in this sum not only past bequest flows Bs (wealth transmissions at death) but also inter gift flows Vs (wealth transmissions inter vivos).3 R vivos � That is, one should define WBt ¼ s � t Bs � ds, with B�s ¼ Bs þ Vs . Alternatively, if one cannot observe directly the gift flow Vs, then one should replace the observed bequest flow Bs by some grossed up level B�s ¼ ð1 þ vs Þ � Bs , where vs = Vs/ Economica © 2017 The London School of Economics and Political Science
242
ECONOMICA
[APRIL
Bs is an estimate of the gift–bequest flow ratio. In countries where adequate data are available, the gift–bequest ratio is at least 10–20%, and it is often higher than 50%, especially in the recent period.4 It is thus critical to include gifts in one way or another. In countries where fiscal data on gifts are insufficient, one should at least try to estimate a grossing-up factor 1 + vs using surveys (which often suffer from severe downward biases) and harder administrative evidence from other countries. Next, in order to properly apply this definition, one should take into account only the fraction of the aggregate inheritance flow Bst ≤ Bs that was received at time s by individuals who are still alive at time t. The problem is that doing so properly requires very detailed individual-level information. At any time t, there are always individuals who received inheritance a very long time ago (say, 60 years ago) but who are still alive (because they inherited at a very young age and/or are enjoying a very long life). Conversely, a fraction of the inheritance flow received a short time ago (say, 10 years ago) should not be counted (because the relevant inheritors are already dead—e.g. they inherited at an old age and/or died young—so their inheritance has already been consumed and/or transmitted to someone else). In practice, however, such unusual events tend to balance each other, so a standard simplifying assumption is to cumulate the full inheritance flows observed over the previous H years, where H is the average generation length, that is, the average age at which parents have children (typically H = 30 years). Therefore we obtain the simplified definition Z WBt ¼
t�30 � s � t
ð1 þ vs Þ � Bs � ds:
In some cases we have access to the full individual-level demographic information, so we compare the full definition and the simplified definition. Both estimates generally turn out to be extremely close to one another (see Piketty et al. 2014). The Kotlikoff–Summers–Modigliani controversy Assume now that these difficulties can be addressed (in particular, assume that we can properly estimate the grossing-up factor 1 + vs and the average generation length H). There are more substantial difficulties ahead. First, in order to properly compute WBt, one needs to be able to observe inheritance flows B�s over a relatively long time period (typically, the previous 30 years). In the famous Kotlikoff–Summers–Modigliani (KSM) controversy, Kotlikoff and Summers (1981), Kotlikoff (1988) and Modigliani (1986, 1988) used estimates of the US inheritance flow for only one year (and a relatively ancient year: 1962). They simply assumed that this estimate could be used for other years. Namely, they assumed that the inheritance flow–national income ratio (which we denote as bys ¼ B�s =Ys ) is stable over time. One problem with this assumption is that it might not apply. As we will see below, extensive historical data on inheritances that were recently collected for a number of European countries show that the bys ratio has changed tremendously over the past two centuries, from about 20–25% of national income in the 19th and early 20th centuries, down to less than 5% at mid-20th century, back to about 10–15% in the early 21st century. So one cannot simply use one year of data and assume that we are in a steady state: one needs long-run time series on the inheritance flow in order to estimate the aggregate stock of inherited wealth. Economica © 2017 The London School of Economics and Political Science
2017]
SHARE OF INHERITANCE IN AGGREGATE WEALTH
243
Next, one needs to decide the extent to which past inheritance flows need to be upgraded or capitalized. This is the main source of disagreement and confusion in the KSM controversy. Modigliani (1986, 1988) chooses zero capitalization. That is, he simply defines the stock of inherited wealth WM Bt as the raw sum of past inheritance flows with no adjustment whatsoever (except for the GDP price index): Z WM Bt ¼
t�30 � s � t
B�s � ds:
For simplicity, assume that we look at a country with fixed inheritance flow–national income ratio by ¼ B�s =Ys , growth rate g (so that Yt = Ys�eg(t�s)), generation length H, and aggregate private wealth–national income ratio b = Wt/Yt. Then, according to the Modigliani definition, the steady-state formulae for the stock of inherited wealth relative to M M national income WM Bt =Yt and for the share of inherited wealth ut ¼ WBt =Wt are given by WM Bt =Yt
1 ¼ Yt
Z
B�s � ds ¼
t�30 � s � t �gH
M uM t ¼ WBt =Wt ¼
1�e g
�
1 � e�gH � by ; g
by : b
In contrast, Kotlikoff and Summers (1981) and Kotlikoff (1988) choose to capitalize past inheritance flows by using the economy’s average rate of return to wealth (assuming that it is constant and equal to r). Following the Kotlikoff–Summers definition, the steady-state formulae for the stock of inherited wealth relative to national income KS WKS ¼ WKS Bt =Yt and for the share of inherited wealth ut Bt =Wt are given by WKS Bt =Yt
1 ¼ Yt
Z
erðt�sÞ � B�s � ds ¼
t�30 � s � t ðr�gÞH
KS uKS t ¼ WBt =Wt ¼
e
eðr�gÞH � 1 � by ; r�g
� 1 by � : r�g b
In the special case where growth rates and rates of return are negligible (i.e. infinitely close to zero), the definitions coincide. That is, if g ≃ 0 and r � g ≃ 0, then (1 � e�gH)/ KS M KS ¼ g = (e(r�g)H � 1)/(r � g) = H, so WM Bt =Yt ¼ WBt =Yt ¼ H � by and ut ¼ ut H � by =b. Thus in the case where growth and capitalization effects can be neglected, one simply needs to multiply the annual inheritance flow by generation length. If the annual inheritance flow is equal to by = 10% of national income, and generation length is equal KS to H = 30 years, then the stock of inherited wealth is equal to WM Bt ¼ WBt ¼ 300% of national income according to both definitions. In the case where aggregate wealth amounts to b = 400% of national income, the inheritance share is equal to KS uM ¼ 75% of aggregate wealth. t ¼ ut However, in the general case where g and r � g are significantly different from zero, the two definitions can lead to widely different conclusions. For instance, with g = 2%, r = 4% and H = 30, we have the capitalization factors (1 � e�gH)/(g�H) = 0.75 and Economica © 2017 The London School of Economics and Political Science
244
ECONOMICA
[APRIL
(e(r�g)H � 1)/((r � g)�H) = 1.37. In this example, for a given inheritance flow by = 10% KS and aggregate wealth–income ratio b = 400%, we obtain uM ¼ 103%. t ¼ 56% and ut About half of wealth comes from inheritance according to the Modigiani definition, and all of it according to the Kotlikoff–Summers definition. This is the main reason why Modigliani and Kotlikoff–Summers disagree so much about the inheritance share. They both use the same (relatively fragile) estimate for the US by in 1962. But Modigliani does not capitalize past inheritance flows and concludes that the inheritance share is as low as 20–30%. Kotlikoff–Summers do capitalize the same flows and conclude that the inheritance share is as large as 80–90% (or even larger than 100% in some specifications).5 The limitations of the KSM definitions Which of the two definitions is more justified? In our view, both are problematic. It is wholly inappropriate not to capitalize at all past inheritance flows. But full capitalization is also inadequate. The key problem with the KSM representative agent approach is that it fails to recognize that the wealth accumulation process always involves different kinds of people and wealth trajectories. In particular, in every society, there are inheritors (people who typically consume part of the return to their inherited wealth) and there are savers (people who do not inherit much but do accumulate wealth through labour income savings). This is an important feature of the real world that must be taken into account for a proper understanding of the aggregate wealth accumulation process. The Modigliani definition is particularly problematic, since it simply fails to recognize that inherited wealth produces flow returns. This mechanically leads to artificially low numbers for the inheritance share uM t (as low as 20–40%), and to artificially high numbers for the lifecycle share in wealth accumulation, which Modigliani defines as 1 � uM t (up to 60–80%). As Blinder (1988) argues: ‘a Rockefeller with zero lifetime labour income and consuming only part of his inherited wealth income would appear to be a lifecycle saver in Modigliani’s definition, which seems weird to me’. One can easily construct illustrative examples of economies where all wealth comes from inheritance (with dynasties of the sort described by Blinder), but where Modigliani would still find an inheritance share well below 50%, simply because of his definition. This makes very little sense.6 The Kotlikoff–Summers definition is conceptually more satisfactory than Modigliani’s, but it suffers from the opposite drawback, in the sense that it mechanically KS leads to artificially high numbers for the inheritance share uKS can t . In particular, ut easily be larger than 100%, even though there are lifecycle savers and self-made wealth accumulators in the economy, and a significant fraction of aggregate wealth accumulation comes from them. This will arise whenever the cumulated return to inherited wealth consumed by inheritors exceeds the savers’ wealth accumulation from their labour savings. In the real world, this condition seems to hold not only in prototype rentier societies such as Paris during the late 19th and early 20th centuries (see Piketty et al. 2014), but also in countries and time periods when aggregate inheritance flows are relatively low. For instance, aggregate series for France show that the capitalized bequest share uKS has been larger than 100% throughout the 20th century, including in the t 1950s–1970s, a period where a very significant amount of new self-made wealth was accumulated (Piketty 2011). Economica © 2017 The London School of Economics and Political Science
2017]
SHARE OF INHERITANCE IN AGGREGATE WEALTH
245
In sum: the Modigliani definition leads to estimates of the inheritance share that are artificially close to 0%, while the Kotlikoff–Summers definition leads to inheritance shares that tend to be structurally above 100%. Neither definition offers an adequate way to look at the data. The PPVR definition In an ideal world with perfect data, the conceptually consistent way to define the share of inherited wealth in aggregate wealth is the following. It was first formalized and applied to Parisian wealth data by Piketty, Postel-Vinay and Rosenthal (2014), so we refer to it as the PPVR definition. The basic idea is to split the population into two groups. First, there are ‘inheritors’ (or ‘rentiers’), whose net assets are worth less than the capitalized value of the wealth that they inherited (i.e. over time they have consumed more than their labour income). The second group is composed of ‘savers’ (or ‘self-made individuals’), whose net assets are worth more than the capitalized value of the wealth that they inherited (i.e. over time they have consumed less than their labour income). Aggregate inherited wealth can then be defined as the sum of inheritors’ wealth plus the inherited fraction of savers’ wealth, and self-made wealth as the non-inherited fraction of savers’ wealth. By construction, inherited and self-made wealth are less than 100% and sum to aggregate wealth, which is certainly a desirable property. Although the definition is fairly straightforward, it differs considerably from the standard KSM definitions based on representative agent models. The PPVR definition is conceptually more consistent, and provides a more meaningful way to look at the data and to analyse the structure of wealth accumulation processes. In effect, it amounts to defining inherited wealth at the individual level as the minimum between current wealth and capitalized inheritance. More precisely, consider an economy with population Nt at time t. Take a given individual i with wealth wti at time t. Assume that he or she received bequest b0ti at time ti < t. Denote by b�ti ¼ b0ti � erðt�ti Þ the capitalized value of b0ti at time t (where erðt�ti Þ is the cumulated rate of return between time ti and time t). Individual i is said to be an ‘inheritor’ (or a ‘rentier’) if wti \ b�ti , and a ‘saver’ (or a ‘self-made individual’) if wti � b�ti . We define the set of inheritors as Nrt ¼ fis.t. wti \ b�ti g, and the set of savers as Nst ¼ fi s.t. wti � b�ti g. We denote by qt ¼ Nrt =Nt and 1 � qt ¼ Nst =Nt the corresponding population shares of inheritors and savers; wrt ¼ Eðwti j wti \ b�ti Þ and wst ¼ Eðwti j wti � b�ti Þ denote the � � s� � � average wealth levels of both groups; br� t ¼ Eðbti j wti \ bti Þ and bt ¼ Eðbti j wti � bti Þ r denote the levels of their average capitalized bequest; and pt ¼ qt � wt =wt and 1 � pt ¼ ð1 � qt Þ � wst =wt denote the shares of inheritors and savers in aggregate wealth. We define the total share φt of inherited wealth in aggregate wealth as the sum of inheritors’ wealth plus the inherited fraction of savers’ wealth, and the share 1 � φt of self-made wealth as the non-inherited fraction of savers’ wealth: s� ut ¼ ½qt � wrt þ ð1 � qt Þ � bs� t �=wt ¼ pt þ ð1 � qt Þ � bt =wt ; s� 1 � ut ¼ ð1 � qt Þ � ðwst � bs� t Þ=wt ¼ 1 � pt � ð1 � qt Þ � bt =wt :
The downside of this definition is that it is more demanding in terms of data availability. While Modigliani and Kotlikoff–Summers could compute inheritance shares in aggregate Economica © 2017 The London School of Economics and Political Science
246
ECONOMICA
[APRIL
wealth by using aggregate data only, the PPVR definition requires microdata. Namely, we need data on the joint distribution Gt ðwti ; b�ti Þ of current wealth wti and capitalized inherited wealth b�ti in order to compute qt, pt and φt. This requires high-quality, individual-level data on wealth and inheritance over two generations, which are often difficult to obtain. It is worth stressing, however, that we do not need to know anything about the individual labour income or consumption paths (yLsi, csi, s < t) followed by individual i up to the time of observation.7 For plausible joint distributions Gt ðwti ; b�ti Þ, the PPVR inheritance share φt will KS typically fall somewhere in the interval ½uM t ; ut �. There is, however, no theoretical reason why it should be so in general. Imagine, for instance, an economy where inheritors consume their bequests the very day they receive them, and never save afterwards, so that wealth accumulation comes entirely from the savers, who never receive any bequest (or negligible amounts), and who patiently accumulate savings from their labour income. Then with our definition, φt = 0%: in this economy, 100% of wealth accumulation comes from savings, and nothing at all comes from inheritance. However, with the Modigliani and uKS could be and Kotlikoff–Summers definitions, the inheritance shares uM t t arbitrarily large. A simplified definition: inheritance flows vs. saving flows When available microdata are not sufficient to apply the PPVR definition, one can also use a simplified, approximate definition based on the comparison between inheritance flows and saving flows. Assume that all we have are macrodata on inheritance flows byt = Bt/Yt and saving flows st = St/Yt. Suppose for simplicity that both flows are constant over time: byt = by and st = s. We want to estimate the share φ = WB/W of inherited wealth in aggregate wealth. The difficulty is that we typically do not know which part of the aggregate saving rate s comes from the return to inherited wealth, and which part comes from labour income (or from the return to past savings). Ideally, one would like to distinguish between the savings of inheritors and savers (as defined above), but this requires microdata over two generations. In the absence of such data, a natural starting point would be to assume that the propensity to save is on average the same whatever the income sources. That is, a fraction φ�a of the saving rate s should be attributed to the return to inherited wealth, and a fraction 1 � a + (1 � φ)�a should be attributed to labour income (and to the return to past savings), where a = YK/Y is the capital share in national income, and 1 � a = YL/Y is the labour share. Assuming again that we are in steady state, we obtain the following simplified formula for the share of inherited wealth in aggregate wealth: u¼
by þ u � a � s ; by þ s
i.e.
u¼
by : by þ ð1 � aÞ � s
Intuitively, this formula simply compares the size of the inheritance and saving flows. Since all wealth must originate from one of the two flows, it is the most natural way to estimate the share of inherited wealth in total wealth.8 There are a number of caveats with this simplified formula. First, real-world economies are generally out of steady state, so it is important to compute average values of by, s and a over relatively long periods of time (typically over the past H years, with Economica © 2017 The London School of Economics and Political Science
2017]
SHARE OF INHERITANCE IN AGGREGATE WEALTH
247
H = 30 years). If one has time series estimates of the inheritance flow byt, capital share at and saving rate st, then one can use the following full formula, which capitalizes past inheritance and saving flows at rate r � g: R
u¼R
ðr�gÞðt�sÞ � bys � ds t�H � s � t e ðr�gÞðt�sÞ � ðbys þ ð1 � as Þ � ss Þ t�H � s � t e
: � ds
With constant flows, the full formula boils down to u¼
by : by þ ð1 � aÞ � s
Second, one should bear in mind that the simplified formula φ = by/(by + (1 � a)�s) is an approximate formula. In general, as we show below, it tends to underestimate the true share of inheritance, as computed from microdata using the PPVR definition. The reason is that individuals who have only labour income tend to save less (in proportion to their total income) than those who have large inherited wealth and capital income, which in turn seems to be related to the fact that wealth (and particularly inherited wealth) is more concentrated than labour income. On the positive side, simplified estimates of φ seem to follow micro-based estimates relatively closely (much more closely than KSM estimates, which are either far too small or far too large), and they are much less demanding in terms of data. One needs to estimate only macro flows. Another key advantage of the simplified definition over the KSM definitions is that it does not depend on the sensitive choice of the rate of return or the rate of capital gains or losses. Whatever these rates might be, they should apply equally to inherited and selfmade wealth (at least as a first approximation), so one can simply compare inheritance and saving flows. This is particularly important, because the real rate qt of capital gains (or losses)—i.e. the difference between the aggregate asset price index and the GDP price index—has been shown to play an important role in the dynamics of the aggregate wealth–income ratio bt = Wt/Yt (together with the saving rate st), both in the short run and in the medium run. (See Piketty and Zucman (2014) for detailed decomposition of the evolution of wealth–income ratios between price effects—i.e. real capital gains and losses—and volume effects—i.e. saving flows.) Estimating the saving rate st and capital share at In order to apply the simplified definition of the inheritance share φ = by/(by + (1�a)�s), we first need long-run macroeconomic series on the private saving rate st and the capital share at, which are relatively easy to find (see, for example, the historical national accounts database put together by Piketty and Zucman (2014)). One important point is that one needs to use net-of-capital-depreciation saving rates and capital shares (i.e. after deduction of consumption of fixed capital). It is also worth noting that the relevant saving rate here is the private saving rate, that is, the sum of the personal (household) saving rate and the corporate saving rate (undistributed profits). In practice, the second component of private saving can be very Economica © 2017 The London School of Economics and Political Science
248
ECONOMICA
[APRIL
important for certain countries and time periods (see Piketty and Zucman 2014). It is critical to include it, as otherwise one would tend to underestimate the share of self-made wealth and overestimate the share of inherited wealth.9 Regarding the capital share, in our benchmark series we attribute to mixed income (self-employment sector) the same labour–capital split as in the corporate sector. We also use alternative assumptions (such as a fixed capital share, e.g. 20% or 30%) and find that it makes very little difference.10
Estimating the inheritance flow–national income ratio byt The more complicated part is usually to estimate the inheritance flow–national income ratio byt. Whenever possible, we attempt to provide two independent measures of the inheritance flow. The first, which we call the fiscal flow, uses bequest and gift tax data, and makes allowances for tax-exempt assets, such as life assurance in France. The second measure, which we call the economic flow, combines estimates of private wealth Wt, mortality tables and observed age–wealth profiles, using the accounting equation B�t ¼ ð1 þ vt Þ � lt � mt � Wt ; where mt is the mortality rate (number of adult decedents divided by total adult population), lt is the ratio between average adult wealth at death and average adult wealth for the entire population, and vt = Vt/Bt is an estimate of the gift–bequest flow ratio. The gap between the fiscal and economic flows can be interpreted as capturing tax evasion and other measurement errors. As we will see below in the case of France, the gap appears to be approximately constant over time and relatively small, so that the two series deliver consistent long-run patterns. Unfortunately, we cannot make this comparison for all countries, due to data limitations. In particular, the US estate tax data cannot be used to compute the aggregate inheritance flow, because only a very small fraction of all decedents is subject to federal estate tax and is included in estate tax data. (Note that in France and in a number of European countries, only a minority of the population is subject to inheritance tax, but everybody is covered by the statistics.) So for the USA we will be able to compute only economic flow series. The economic flow series allow—by construction—for a straightforward decomposition of the various effects at play in the evolution of byt. In the above equation, dividing both terms by Yt gives byt ¼ B�t =Yt ¼ ð1 þ vt Þ � lt � mt � bt : Similarly, dividing by Wt, we can define the rate of wealth transmission as bwt ¼ B�t =Wt ¼ ð1 þ vt Þ � lt � mt ¼ l�t � mt ; with l�t ¼ ð1 þ vt Þ � lt ¼ gift-corrected ratio: Economica © 2017 The London School of Economics and Political Science
2017]
SHARE OF INHERITANCE IN AGGREGATE WEALTH
249
If lt = 1 (i.e. decedents have the same average wealth as the living) and vt = 0 (no gift), then the rate of wealth transmission is simply equal to the mortality rate: bwt = mt (and byt = mt�bt). If lt = 0 (i.e. decedents die with zero wealth, as in Modigliani’s pure lifecycle theory of wealth accumulation) and vt = 0 (no gift), then there is no inheritance at all: bwt = byt = 0. In order to apply the economic flow formula byt = (1 + vt)�lt�mt�bt, we need long-run series on vt, lt, mt and bt. The easiest part is the mortality rate mt (demographic data are plentiful). Annual long-run series on the aggregate private wealth–national income ratios bt were recently collected for a large number of countries (Piketty and Zucman 2014). The more difficult part is about lt, and even more so vt. In order to compute lt, one needs data on the age–wealth profile, which can be obtained from household wealth surveys or wealth censuses, or from estate or inheritance tax data (assuming that they cover a sufficiently large part of the population, which is not the case for the USA). In order to estimate vt, one needs reliable administrative data on bequests and gifts, which are very difficult to obtain, so we need to make assumptions (more on this below). II. MAIN RESULTS ON THE LONG-RUN EVOLUTION OF INHERITANCE In this section we apply our definitions and present our main results. We start with France and other European countries for which we have estimates (Germany, the UK, Sweden), and then move to the US case. Inheritance series for France The inheritance flow–national income ratio byt. We start by presenting the evidence on the dynamics of the inheritance flow–national income ratio byt in France, a country for which historical data sources are exceptionally good (Piketty 2011; Piketty and Zucman 2015). The main conclusion is that byt has followed a spectacular U-shaped pattern over the 20th century. The inheritance flow was relatively stable around 20–25% of national income throughout the 1820–1910 period (with a slight upward trend), before being divided by a factor of about 5–6 between 1910 and the 1950s, and then multiplied by a factor of about 3–4 between the 1950s and the 2000s (see Figure 2). These are enormous historical variations, but they appear to be well founded empirically. In particular, the patterns for byt are similar with our two independent measures of the inheritance flow. Using the economic flow definition, we can see that the U-shaped pattern followed by the French inheritance–income ratio byt is the product of two U-shaped evolutions. First, it partly comes from the U-shaped evolution of the private wealth–income ratio bt. The U-shaped evolution of byt, however, is almost twice as marked at that of bt. The wealth– income ratio was divided by a factor of about 2–3 between 1910 and 1950 (from 600– 700% to 200–300%), while the inheritance flow was divided by a factor of around 5–6 (from 20–25% to about 4%; see Figure 2). The explanation is that the rate of wealth transmission bwt ¼ l�t � mt has also been following a U-shaped pattern: it was almost divided by two between 1910 and 1950 (from over 3.5% to just 2%), and has been rising again to about 2.5% in 2010. The U-shaped pattern followed by bwt, in turn, comes entirely from l�t . The relative wealth of decedents was at its lowest historical level in the aftermath of the Second World War (which, as we will see below, is largely due to the fact that it was too late for older Economica © 2017 The London School of Economics and Political Science
Annual flow of bequests and gifts (% national income)
250
[APRIL
ECONOMICA
32% 28%
Economic flow (computed from national wealth estimates, mortality table and age-wealth profiles)
24% 20%
Fiscal flow (computed from bequest and gift tax data, incl. tax-exempt assets)
16% 12% 8% 4% 0% 1820
1840
1860
1880
1900
1920
1940
1960
1980
2000
FIGURE 2. Annual inheritance flow as a fraction of national income, France 1820–2010. Notes: The annual inheritance flow was about 20–25% of national income during the 19th century and until 1914; it then fell to less than 5% in the 1950s, and returned to about 15% in 2010.
cohorts to recover from the shocks and re-accumulate wealth after the war). Given that aggregate wealth was also at its lowest historical level, the combination of these two factors explain the exceptionally low level of the inheritance flow in the 1950s and 1960s. By contrast, the mortality rate mt has been constantly diminishing: this long-run downward trend is the mechanical consequence of the rise in life expectancy (for a given cohort size).11 In recent decades, a very large part of the rise in l�t ¼ ð1 þ vt Þ � lt comes from the rise in the gift–bequest ratio vt, which used to be about 20% during most of the 19th and 20th centuries, and has gradually risen to as much as 80% in recent decades.12 That is, the gift flow is currently almost as large as the bequest flow. Although there is still much uncertainty about the reasons behind the rise in gifts, the evidence suggests that it started before the introduction of new tax incentives for gifts in the 1990s and 2000s, and has more to do with the growing awareness by wealthy parents that they will die old and that they ought to transmit part of their wealth inter vivos if they want their children to fully benefit from it. In any case, one should not underestimate the importance of gifts. In particular, one should not infer from a declining age–wealth profile at old ages or a relatively low relative wealth of decedents that inheritance is unimportant: this could simply reflect the fact that decedents have already given away a large part of their wealth. The inheritance stock–aggregate wealth ratio φt. How do the annual inheritance flows transmit into cumulated inheritance stocks? Given the data limitations that we face, we report in Figure 3 two alternative estimates for the share φt of total inherited wealth in aggregate French wealth between 1850 and 2010. According to both measures, there is again a clear U-shaped pattern. The share of inherited wealth φt was as large as 80–90% of aggregate wealth in 1850–1910, down to as little as 35–45% around 1970, and back up to 65–75% by 2010. Economica © 2017 The London School of Economics and Political Science
Cumulated stock of inherited wealth (% private wealth)
2017]
251
SHARE OF INHERITANCE IN AGGREGATE WEALTH
100% Share of inherited wealth (PPVR definition, extrapolation) Share of inherited wealth (simplified definition, lower bound)
90% 80% 70% 60% 50% 40% 30% 20% 1850
1870
1890
1910
1930
1950
1970
1990
2010
FIGURE 3. Share of inherited wealth as a fraction of aggregate private wealth, France 1850–2010. Notes: Inherited wealth represented 80–90% of total wealth in France in the 19th century; this share fell to 40–50% during the 20th century, and is back to about 60–70% in the early 21st century.
The higher series, which we see as the most reliable, was obtained by applying the micro-based PPVR definition (see Section I). The limitation here is that the set of microdata on wealth over two generations that has been collected in French historical archives is more complete for Paris than for the rest of France (see Piketty, Postel-Vinay and Rosenthal 2006, 2014). For years with missing data for the rest of France, the estimates reported in Figure 3 were extrapolated on the basis of the Parisian data. Ongoing data collection suggests that the final estimates will not be too different from the approximate estimates reported here. The lower series, which we see as a lower bound, comes from the simplified definition based on the comparison of inheritance and saving flows (see Section I). That is, the lower series was computed as φ = by/(by + (1 � a)�s) (using average values for by and (1 � a)s computed over the previous 30 years). The key advantage of this simplified definition is that it requires much fewer data: it can readily be computed from the inheritance flow series byt that was reported above. It delivers estimates of the inheritance share φt that are always somewhat below the micro-based estimates, with a gap that appears to be approximately constant. The gap seems to be due to the fact that the simplified definition attributes too much saving to pure labour earners with little inheritance. In both series, the share φt of total inherited wealth in aggregate wealth reaches its lowest historical point in the 1970s, while the inheritance flow byt reaches its lowest point in the immediate aftermath of the Second World War. The reason is that the stock of inherited wealth comes from cumulating the inheritance flows of the previous decades— hence the time lag. Inheritance series for other European countries What do we know about the importance of inheritance in other countries? A recent wave of research attempts to construct estimates of the inheritance flow–national income ratio Economica © 2017 The London School of Economics and Political Science
252
[APRIL
ECONOMICA
Annual flow of bequests and gifts (% national income)
byt in a number of European countries. The series constructed by Atkinson (2013) for Britain and Schinke (2013) for Germany show that byt has also followed a U-shaped pattern in these two countries over the past century (see Figure 4). Data limitations, however, make it difficult at this stage to make precise comparisons between countries. For Britain, the inheritance flow byt of the late 19th and early 20th centuries seems to be similar to that of France, namely about 20–25% of national income. The flow then falls following the 1914–45 shocks, albeit less spectacularly than in France, and recovers in recent decades. Karagiannaki (2011), in a study of inheritance in the UK from 1984 to 2005, also finds a marked increase in that period. The rebound, however, seems to be less strong in Britain than in France, so that the inheritance flow appears smaller than in France today. We do not know yet whether this finding is robust. At this stage, available British series are pure ‘fiscal flow’ series (as opposed to French series, for which we have both ‘economic’ and ‘fiscal’ estimates). As pointed out by Atkinson (2013), the main reason for the weaker British rebound in recent decades is that the gift–bequest ratio vt has not increased at all according to fiscal data (vt has remained relatively flat at a low level, around 10–20%), possibly due to an unrecording of gifts in tax data. Germany also exhibits a U-shaped pattern of inheritance flow byt that seems to be broadly as sharp as in France. In particular, just like in France, the strong German rebound in recent decades comes with a large rise in the gift–bequest ratio vt during the 1990s and 2000s (vt is above 50–60% in the 2000s). The overall levels of byt are generally lower in Germany than in France, which is not surprising given the lower aggregate wealth–income ratio bt. Should we compare the rates of wealth transmission (i.e. bwt = byt/bt), the levels would be roughly the same in both countries in 2000–10. We report in Figure 5 the corresponding estimates for the share φt of total inherited wealth in aggregate wealth, using the simplified definition φ = by/(by + (1 � a)s) (again using average values for by and (1 � a)s computed over the previous 30 years). For
24% France 20% UK 16%
Germany
12% 8% 4% 0% 1900
1910
1920
1930
1940
1950
1960
1970
1980
1990
2000
2010
FIGURE 4. Inheritance flow in Europe 1900–2010 . Notes: The inheritance flow follows a U-shaped in curve in France as well as in the UK and Germany. It is possible that gifts are underestimated in the UK at the end of the period. Economica © 2017 The London School of Economics and Political Science
Stock of inherited wealth (% private wealth)
2017]
253
SHARE OF INHERITANCE IN AGGREGATE WEALTH
100% France
90%
UK
80%
Germany 70% 60% 50% 40% 30% 20% 1900
1910
1920
1930
1940
1950
1960
1970
1980
1990
2000
2010
FIGURE 5. Share of inherited wealth in Europe 1900–2010. Notes: Simplified definitions using inheritance vs. saving flows; approximate lower-bound estimates. The inheritance share in aggregate wealth accumulation follows a U-shaped curve in France and Germany (and to a more limited extent in the UK). It is possible that gifts are underestimated in the UK at the end of the period.
Germany, the inheritance share φt appears to be generally smaller than in France. In particular, it reaches very low levels in the 1960s and 1970s, due to the extremely low inheritance flows in Germany in the immediate postwar period, and to large saving rates. In recent decades, the German φt has been rising fast and seems to catch up with that of France. In the UK, the inheritance share φt apparently never fell to the low levels observed in France and Germany in the 1950s, and seems to be always higher than on the Continent. The reason, for the recent period, is that the UK has had relatively low saving rates since the 1970s.13 Recent historical research suggests that inheritance flows have also followed U-shaped patterns in Sweden (see Ohlsson et al. 2014). Here byt appears to be smaller than in France, but this again seems largely due to lower bt ratios. When we look at the implied bwt and φt ratios, which in a way are the most meaningful ratios to study, both the levels and shape are relatively similar across European countries. As shown in Figure 6, the share of inherited wealth followed the same evolution in Sweden and France in the 20th century (the main difference being that it seems to have increased a little less in Sweden than in France in recent decades, due to a rise in the private saving rate). We stress again, however, that a lot more data need to be collected—and are currently being collected—on the historical evolution of inheritance before we can make proper international comparisons. Inheritance series for the USA Finally, we provide new estimates for the long-run evolution of inheritance in the USA. As already mentioned, one special difficulty is that US fiscal data on bequests and gifts are relatively low quality. In particular, the federal estate tax covers only few decedents (in 2012 only about 1 decedent out of 1000 paid the estate tax), so the resulting data cannot be used to study aggregate inheritance flows. Economica © 2017 The London School of Economics and Political Science
Stock of inherited wealth (% private wealth)
254
[APRIL
ECONOMICA
100% France UK Germany Sweden
90% 80% 70% 60% 50% 40% 30% 20% 1900
1910
1920
1930
1940
1950
1960
1970
1980
1990
2000
2010
FIGURE 6. Share of inherited wealth: the case of Sweden. Notes: Simplified definitions using inheritance vs. saving flows; approximate lower-bound estimates. The inheritance share in aggregate wealth accumulation follows broadly similar evolutions in Sweden and France over the 1900–60 period, but in recent decades the Swedish inheritance share shows little increase, due a large rise in the saving rate.
Therefore we proceed as follows. First, we apply the formula byt = (1 + vt)�lt�mt�bt in order to compute inheritance flow series for the USA. We use standard demographic data sources to compute the mortality rate mt, and we borrow the aggregate private wealth–national income ratio bt from Piketty and Zucman (2014). We use household wealth survey data from the Survey of Consumer Finances over the 1962–2013 period in order to estimate the relative wealth of decedents lt. We also use data from the US censuses of 1860 and 1870 (which include information on wealth) in order to estimate the age–wealth profiles and the relative wealth of decedents for the late 19th century.14 Next, one needs to find ways to estimate the gift–bequest ratio vt, which is not easy to do in the absence of high-quality fiscal data. Given the data limitations, we choose to present two alternative estimates. In our benchmark estimate, we assume a fixed vt = 20%.15 In our high-gift estimate, we assume that vt has followed the same trajectory in the USA as in France and Germany since the 1980s (namely, with a gradual increase from vt = 20% to vt = 80%).16 Finally, we use our resulting byt series and the at and st series from Piketty and Zucman (2014) in order to apply the simplified definition φ = by/(by + (1 � a)s) (again using average values for by and (1 � a)s computed over the previous 30 years). Our estimates are summarized in Figure 7.17 The US pattern also appears to be U-shaped, albeit less markedly than in European countries. The inheritance share in aggregate wealth accumulation was lower in the USA than in Europe in the 19th century and on the eve of the First World War (less than 60% in the USA vs. over 70% in Europe). However, the US inheritance share was rising fast in the late 19th and early 20th centuries. The shocks caused by the 1930s and the Second World War led to a downturn, but much less pronounced than in Europe, so that the US inheritance share became higher than in Europe by the mid-20th century (with the exception of the UK). In recent decades, the inheritance share seems to have increased substantially in the USA. Economica © 2017 The London School of Economics and Political Science
Stock of inherited wealth (% private wealth)
2017]
255
SHARE OF INHERITANCE IN AGGREGATE WEALTH
100% France UK Germany Sweden USA (benchmark estimate) USA (high-gift estimate)
90% 80% 70% 60% 50% 40% 30% 20% 1900
1910
1920
1930
1940
1950
1960
1970
1980
1990
2000
2010
FIGURE 7. Share of inherited wealth: the case of the USA. Notes: Simplified definitions using inheritance vs. saving flows; approximate lower-bound estimates. The inheritance share in aggregate wealth accumulation seems to follow a U-shaped curve in the USA over the past century, but it is less marked than for France and Germany. There is significant uncertainty regarding recent trends, due to data limitations.
However we should stress that there is significant uncertainty about the exact levels and trends for the recent decades, due in particular to the limitations of US estate tax data. In our benchmark estimate, the rise in the inheritance share is relatively moderate, and the US level appears to be intermediate between France and the UK as of 2010 (and very close to both). In our high-gift estimate, the rise is much larger, and the share of inheritance in US aggregate wealth appears to be substantially higher than in all European countries (including the UK). More research is needed before we can reach more precise comparisons between the USA and other countries. In a recent paper, Wolff and Gittleman (2014) analyse the retrospective data on bequest and gift receipts reported in the Survey of Consumer Finances (SCF) and find little evidence of a rise in inheritances since the 1980s. One major problem with this approach, however, is that self-reported inheritance flows are implausibly low, and inconsistent with the economic flow computations (see Section III).18 Given the relatively low US saving rates in recent decades, it is evident that even moderate inheritance flows (between 5% and 10% of national income) imply a relatively large share φt of total inherited wealth in aggregate wealth (at least according to the simplified definition of φ based on the comparison between by and s). These estimates are imperfect, but they appear to be more reliable than what one can estimate using selfreported inheritance data. Another interesting recent study is Kaplan and Rauh (2013), who use Forbes billionaire data. They find that Americans in the Forbes 400 are less likely to have inherited their wealth today than in the 1980s. It is unclear, however, whether this result reflects a true economic phenomenon or illustrates the limits of Forbes and other wealth rankings. Inherited wealth holdings are probably tougher to spot than self-made wealth, first because inheritors’ portfolios tend to be more diversified, and also because inheritors may not like to be in the press, while many entrepreneurs usually enjoy it and do not attempt to dissimulate their wealth nearly as much. The Economica © 2017 The London School of Economics and Political Science
256
ECONOMICA
[APRIL
conclusions about the relative importance of inherited vs. self-made wealth obtained by analysing Forbes list data may thus be relatively fragile. In particular, it should be noted that the data are purely qualitative (we know whether there is ‘some inheritance’ or ‘predominant inheritance’, but no quantitative estimate is actually available).19 That being said, it is also perfectly possible that the share of inheritance in US wealth accumulation has increased at the aggregate, macro level, but not for top billionaires.
III. OPEN ISSUES AND TOPICS FOR FUTURE RESEARCH In this section, we discuss a number of open issues and topics which in our view should rank high in the research agenda on the evolution of inheritance. The steady-state level of the inheritance share We have shown that there are substantial variations in the inheritance share over time and across countries. This is partly due to the fact that observed data frequently reflects out-of-steady-state time series. Wealth accumulation spans several generations and many decades, and one should be careful not to interpret averages over one or two decades as steady-state outcomes. However, this can also be due to the existence of different possible steady-state values for the share of inheritance in aggregate wealth accumulation. Generally speaking, the inheritance share φ depends on many different economic and demographic parameters. In particular, it depends on the structure of saving motives. In societies where individuals save mostly for lifecycle reasons, the inheritance share should be negligible. Conversely, in societies with strong tastes for leaving bequests, the inheritance share can be arbitrarily large. Generally speaking, it is clear that any inheritance share φ can be a steady state. For a given distribution of saving motives, there are several forces implying that lower growth rates might lead to higher inheritance shares. To see this, consider the simplified formula φ = by/(by + (1 � a)s), and replace the inheritance flow with by = l�m�b (neglecting the gift term v for simplicity) and the saving rate with s = g�b (the Harrod–Domar–Solow formula for the standard one-sector capital accumulation model). We get φ = l�m/(l�m + (1 � a)g). In other words, for given l�m and a, the inheritance share φ is higher the smaller the growth rate.20 This effect can be reinforced by the fact that the l parameter—i.e. the relative wealth of decedents—is endogenous and might well depend on the growth rate g, as well as on demographic parameters such as life expectancy and the mortality rate m. In the pure lifecycle model where agents die with zero wealth, l is always equal to zero, and so is the inheritance share φ, independently of the growth rate g, no matter how small g is. But for given (positive) bequest tastes and saving parameters, one can show that in steady state, l = l(g) tends to be higher when growth rate g and mortality rate m are lower (Piketty 2011; Piketty and Zucman 2015). This is an issue that would deserve further research, especially in light of the rapid ageing process and the prospects for negative population growth in a number of countries. It would be interesting to explore in future research the interplay between the inheritance share and the dynamics of wealth inequality (Piketty 2014; Piketty and Zucman 2015). Economica © 2017 The London School of Economics and Political Science
2017]
SHARE OF INHERITANCE IN AGGREGATE WEALTH
257
Developing better data sources on inheritance Another major challenge for future research is the development of better data sources to study wealth and inheritance. The fact that household wealth surveys suffer from major limitations is already well known. In particular, recent research has shown that the SCF underestimates both the levels and trends in top wealth shares in the USA, and that one needs to use administrative data (such as capital income flows reported to tax authorities by financial institutions) in order to better monitor the evolution of wealth inequality (Saez and Zucman 2014). It is worth stressing that these limitations are even more stringent when it comes to the measurement of inheritance. In order to illustrate this, we have reported in Table 1 the ratio between the self-reported flow of inheritance and gift receipts in wealth surveys from France and the USA (using the retrospective questionnaires) and the total economic flow on inheritance and gift (which we estimated using macroeconomic data on aggregate private wealth, mortality rates and age–wealth profiles). The ratio is typically of the order of 20–30%, which is extremely low. Another difficulty is that the underreporting behaviour might be biased in various ways; for example, individuals with particular wealth trajectories might tend to underreport inheritance receipts with different intensities. We have attempted to develop various imputations techniques in order to scale up the inheritance receipts in the SCF, and our general conclusion is that it is very difficult to come up with robust findings. In order to improve data quality, it seems necessary to link wealth survey data with administrative data sources. This includes data from property records, capital income flows and estate declarations. Otherwise it will be very difficult to make substantial progress on these important issues.
TABLE 1
EVIDENCE OF UNDERREPORTING OF INHERITED WEALTH IN HOUSEHOLD SURVEYS Self-reported flow of inheritance and gift receipts (% of benchmark estimates of total economic flow of inheritance and gift) France (INSEE Wealth Survey) USA (Survey of Consumer Finances)
2003 2009 1989 1992 1995 1998 2001 2004 2007 2010 2013
29% 21% 44% 31% 58% 26% 20% 27% 20% 22% 25%
Notes In 2003, the self-reported flow of inheritance and gift receipts in the French household wealth survey equals 29% of the total estimated economic flow. The self-reported flow was computed as the average receipts reported for the 6 years before survey year (the results are similar if we take a 3-year or 1-year window). The benchmark economic flow was computed using macroeconomic data on aggregate wealth, mortality rates and age–wealth profiles (see text). Economica © 2017 The London School of Economics and Political Science
258
ECONOMICA
[APRIL
ACKNOWLEDGMENTS This paper presents the authors’ views and should not be interpreted as reflecting those of their institutions. We are most grateful to the editor and two anonymous referees for their helpful reactions and suggestions. We acknowledge financial support from the European Research Council (Grant 340831), and the ESRC/DFID joint fund (Grant ES/I033114/1), and the Institute for New Economic Thinking.
NOTES 1. See Kotlikoff and Summers (1981), Kotlikoff (1988) and Modigliani (1986, 1988). Modigliani’s theory of lifecycle saving was first formulated in the 1950s and 1960s; see the references given in Modigliani (1986). 2. Looking at GDP-weighted averages rather than simple arithmetic averages, or including Sweden in the European average, hardy affects the ‘Europe’ series. See the online appendix. 3. Otherwise, a country where all individuals give away their wealth to their children and relatives a few months before they die would appear to be a country with no inherited wealth. 4. See below. Note that even in countries where fiscal data on gifts are relatively comprehensive (such as France), the fiscal gift flow includes only formal, monetary capital gifts, and typically ignores informal presents and in-kind gifts (at least up to a certain level), so these gift–bequest ratios should be viewed as lower bounds. Also note that in-kind gifts made to minors living with their parents (i.e. the fact that minor children are usually catered by their parents) are systematically left aside. 5. Both sides also disagree somewhat about the measurement of by, but the main source of divergence really comes from this capitalization effect. In effect, Modigliani favours a by ratio around 5–6%, while Kotlikoff– Summers find it more realistic to use a by ratio around 7–8%. Given the data sources that they use, it is likely that both sides tend to somewhat underestimate the true ratio. See Section II. 6. It is worth stressing that the return to inherited wealth (and the possibility to save and accumulate more wealth out of the return to inherited wealth) is a highly relevant economic issue not only for high-wealth dynasties of the sort referred to by Blinder, but also for middle-wealth dynasties. For instance, it is easier to save if one has inherited a house and has no rent to pay. An inheritor saving less than the rental value of his inherited home would be described as a lifecycle saver according to Modigliani’s definition, which again seems odd. 7. Of course, more data are better. If we also have (or estimate) labour income or consumption paths, then we can compute lifetime individual savings rate sBti, i.e. the share of lifetime resources that was not consumed up to time t: sBti ¼ wti =ðb�ti þ y�Lti Þ ¼ 1 � c�ti =ðb�ti þ y�Lti Þ; with y�Lti ¼
Z yLsi erðt�sÞ ds ¼ capitalized value at time t of past labour income flows s\t
and c�ti ¼
Z csi erðt�sÞ ds ¼ capitalized value at time t of past consumption flows: s\t
By definition, inheritors are individuals who consumed more than their labour income (i.e. wti \ b�ti $ c�ti [ y�Lti ), while savers are individuals who consumed less than their labour income (i.e. wti � b�ti $ c�ti � y�Lti ). But the point is that we need to observe only an individual’s wealth (wti) and capitalized inheritance (b�ti ) in order to determine whether he or she is an inheritor or a saver, and in order to compute the share of inherited wealth. 8. Similar formulae based on the comparison of inheritance and saving flows have been used by DeLong (2003) and Davies et al. (2012, pp. 123–4). One important difference is that these authors do not take into account the fact that the saving flow partly comes from the return to inherited wealth. See the discussion in Section III. 9. In principle, one should include only the fraction of undistributed profits that can be attributed to corporations owned by the personal household sector (rather than by the government sector). In practice, for the countries and time periods that we look at, this makes very little difference. See Piketty and Zucman (2014) and the online appendix. Economica © 2017 The London School of Economics and Political Science
2017]
SHARE OF INHERITANCE IN AGGREGATE WEALTH
259
10. See the online appendix, where one can use the formulae for alternative assumptions and series. 11. The mortality rate, however, is about to rise somewhat in coming decades in France due to baby boomers (see Piketty 2011). This effect will be even stronger in countries (like Germany and Japan) where cohort size has declined in recent decades, and will tend to push inheritance flows towards even higher levels. 12. See Figure A1 in the online appendix, and Piketty (2011). 13. In effect, British saving rates in recent decades are insufficient to explain the large rise in the aggregate wealth–income ratio, which can be accounted for only by large capital gain (Piketty and Zucman 2014). Note that the simplified definition of φt based on the comparison between inheritance and saving flows amounts to assuming the same capital gains for inherited and self-made wealth. This seems like the most reasonable assumption, at least as a first approximation. 14. One could also use data from state-level estate taxes (which typically cover a higher fraction of decedents than the federal estate tax) in order to obtain more estimates of lt, particularly for the early 20th century. 15. This corresponds approximately to what we find in federal estate tax data, but it might underestimate the true vt. 16. See Figures A2 and A3 in the online appendix for the resulting series for lt and byt. 17. All detailed computations—as well as a number of sensitivity checks—are provided in the online appendix. 18. One additional challenge in this study is that inherited assets are generally valued using asset prices at the time when the assets were transmitted: no capital gain is included—which probably contributes to a relatively low estimated inheritance share in total US wealth (about 20%, just as in Modigiani’s estimates). 19. Kopczuk and Edlund (2009) observe that in estate tax data, the share of women among the very wealthy in the USA peaked in the late 1960s (at nearly one-half) and then declined to about one-third. They argue that this pattern reflects changes in the importance of inheritance, as women are less likely to be entrepreneurs. However, this is again a relatively indirect way to measure the inheritance share, since many other effects are at play here. 20. A similar point has been made by a number of authors, such as Laitner (2001) and DeLong (2003). In particular, according to DeLong, the share of inheritance in total wealth accumulation should be higher in low-growth societies, because the annual volume of new savings is relatively small in such economics (so that in effect most wealth originates from inheritance). Using our notations, the inheritance share φ = φ(g) is a decreasing function of the growth rate g. See also Davies et al. (2012, pp. 123–4).
REFERENCES ATKINSON, A. B. (2013). Wealth and inheritance in Britain from 1896 to the present. Centre for Analysis of Social Exclusion Paper 178. BLINDER, A. (1988). Comments on Modigliani and Kotlikoff–Summers. In D. Kessler and A. Masson (eds), Modelling the Accumulation and Distribution of Wealth. Oxford: Oxford University Press, pp. 68–76. DAVIES, J. B., LLUBERAS, R. and SHORROCKS, A. (2012). Global Wealth Databook. Zurich: Credit Suisse. DELONG, J. B. (2003). Bequests: an historical perspective. In A. Munnell (ed.), The Role and Impact of Gifts and Estates. Washington, DC: Brookings Institution. KAPLAN, S. N. and RAUH, J. (2013). Family, education, and sources of wealth among the richest Americans, 1982–2012. American Economic Review, 103(3), 158–66. KARAGIANNAKI, E. (2011). Recent trends in the size and the distribution of inherited wealth in the UK. CASE paper no. 146, London School of Economics. KOPCZUK, W. and EDLUND, L. (2009). Women, wealth and mobility. American Economic Review, 99(1), 146–78. KOTLIKOFF, L. (1988). Intergenerational transfers and savings. Journal of Economic Perspectives, 2(2), 41–58. ———— and SUMMERS, L. (1981). The role of intergenerational transfers in aggregate capital accumulation. Journal of Political Economy, 89, 706–32. LAITNER, J. (2001). Secular changes in wealth inequality and inheritance. Economic Journal, 111(474), 691–721. MODIGLIANI, F. (1986). Life cycle, individual thrift and the wealth of nations. American Economic Review, 76 (3), 297–313. ———— (1988). The role of intergenerational transfers and lifecycle savings in the accumulation of wealth. Journal of Economic Perspectives, 2(2), 15–40. OHLSSON, H., ROINE, J. and WALDENSTROM, D. (2014). Inherited wealth over the path of development: Sweden 1810–2010. Mimeo. PIKETTY, T. (2011). On the long-run evolution of inheritance: France 1820–2050. Quarterly Journal of Economics, 126(3), 1071–131. ———— (2014). Capital in the 21st Century. Cambridge, MA: Harvard University Press. ———— and ZUCMAN, G. (2014). Capital is back: wealth-income ratios in rich countries 1700–2010. Quarterly Journal of Economics, 129(3), 1155–210.
Economica © 2017 The London School of Economics and Political Science
260
ECONOMICA
[APRIL
———— and ———— (2015). Wealth and inheritance in the long run. In A. B. Atkinson and F. Bourguignon (eds), Handbook of Income Distribution, Vol. 2B. Amsterdam: North-Holland, pp. 1303–68. ————, POSTEL-VINAY, G. and ROSENTHAL, J.-L. (2006). Wealth concentration in a developing economy: Paris and France, 1807–1994. American Economic Review, 96(1), 236–56. ————, ———— and ———— (2014). Inherited vs. self-made wealth: theory and evidence from a rentier society (1872–1927). Explorations in Economic History, 51(1), 21–40. SAEZ, E. and ZUCMAN, G. (2014). Wealth inequality in the U.S. since 1913: evidence from capitalized income tax data. NBER Working Paper number 20625. SCHINKE, C. (2013). Inheritance in Germany 1911 to 2009. Paris School of Economics Working Paper. WOLFF, E. and GITTLEMAN, M. (2014). Inheritances and the distribution of wealth or whatever happened to the great inheritance boom? Journal of Economic Inequality, 12(4), 439–68.
SUPPORTING INFORMATION Additional Supporting Information may be found in the online version of this article: Figure A1 The ratio between average wealth at death and average wealth of the living, France 1820–2010 Figure A2 The ratio between average wealth of decedents and average wealth of the living Figure A3 The annual inheritance flow as a fraction of national income by = B/Y
Economica © 2017 The London School of Economics and Political Science