35th Annual International Conference of the IEEE EMBS Osaka, Japan, 3 - 7 July, 2013
On the Impact of Arousals on the Performance of Sleep and Wake Classification Using Actigraphy Pedro Fonseca, Xi Long, Member, IEEE, Jerome Foussier, Member, IEEE, and Ronald M. Aarts, Fellow IEEE
Abstract— We evaluated the impact of arousals on the performance of actigraphy-based sleep/wake classification. Using a dataset of 15 healthy adults and a threshold optimized for this task we found that the percentage of sleep epochs with activity counts above that threshold was significantly larger in epochs with and following arousals. We also found that 41.1% of all false positive classifications occurred in these epochs. Finally, we determined that excluding these epochs from the evaluation led to a maximum precision increase of 17.2%. Considering wake detections in those epochs as correct led to a maximum precision increase of 31.3%. We concluded that unless arousals can be automatically identified or at least distinguished from wake, the performance of actigraphy-based sleep/wake classifiers is limited by their presence.
I. INTRODUCTION Despite important advances on unobtrusive sleep measurements over the last years, overnight polysomnographic recordings (PSG) assisted by expert technicians remain the gold standard for sleep medicine [1]. However, although PSG offers accurate physiological measurements during sleep, essential for the correct diagnosis of sleep disorders, it has severe drawbacks. High costs of laboratory facilities, equipment and qualified personnel, disruption of “normal” sleep, and impossibility to perform long-term monitoring, all have motivated research in the area of unobtrusive sleep monitoring. The area of actigraphy has been relatively popular in the assessment of sleep-wake disturbances [2]. Actigraphy consists of the measurement of gross body movements by means of a wrist(or limb-) worn accelerometer. A measure of so-called “activity counts” quantifying the amount of body movements occurring during an epoch (typically 30 seconds long) is recorded and used to determine whether the subject was awake or resting (asleep) during that period [3]. Actigraphy has been indicated by the American Academy of Sleep Medicine (AASM) as a suitable method to assist in the evaluation of patients with circadian disorders and sleepwake disturbances, and also to assess response to therapy of circadian disorders and insomnia [4]. An extensive amount of work has been done on developing and evaluating actigraphy-based sleep/wake classifiers [2]. Ultimately, most Research supported by Philips Research. P. Fonseca, X. Long and R. M. Aarts are with Philips Research, High Tech Campus, 5656 AE Eindhoven, The Netherlands and with the Dept. of Electrical Engineering, Eindhoven University of Technology, Den Dolech 2, 5612 AZ Eindhoven, The Netherlands (e-mail: {pedro.fonseca, xi.long, ronald.m.aarts}@philips.com). J. Foussier is with the Philips Chair for Medical Information Technology, RWTH Aachen University, Pauwelsstrasse 20, 52074 Aachen, Germany (e-mail:
[email protected]).
978-1-4577-0216-7/13/$26.00 ©2013 IEEE
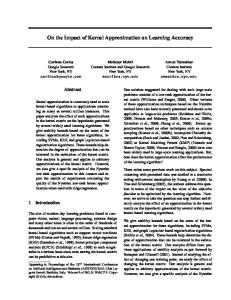
depend to a great extent on the amplitude of activity counts. In its simplest form these classifiers analyze the activity counts measured within a given epoch. If the value of activity counts is above a certain threshold, the epoch is classified as wake, otherwise it is classified as sleep. Although in practice most algorithms include more advanced techniques such as the analysis of the values in neighboring epochs [3], or the duration and periodicity of movements [5], it is clear that the performance of such a classifier will depend on the discriminative power of activity counts for sleep and wake. Unfortunately, in this regard actigraphy suffers from two important drawbacks. First, in the periods just before and after sleep, many subjects do not move although they are awake, meaning that sleep/wake estimation will very often overestimate sleep [6]. This problem has been mitigated by the use of cardiorespiratory features in addition to actigraphy [7], exploiting known autonomic changes associated with sleep [8]. The second problem is related to the occurrence of arousals. An arousal is defined as a rapid shift in the EEG frequency and can be accompanied by an increase of electromyographic (EMG) activity, cardiac frequency or body movements [9],[10]. This means that many sleep epochs will share some physiological characteristics of wake, in particular in regard to the presence of body movements. An example is illustrated in Fig. 1 where many activity peaks occurring during sleep epochs largely coincide with the occurrence of annotated arousals. This problem has been previously identified, and rule-based solutions involving the amplitude of activity counts and duration of periods of activity have been proposed [11].
Figure 1. Full-night recording of a healthy subject. (Top) actigraphy. (Bottom) after PSG scoring, with wake (black) and sleep epochs with and without arousals (gray and white, respectively).
6760
Despite positive recommendations regarding the use of actigraphy in clinical settings [4], there is still evidence of its low performance in clinical populations with fragmented sleep or in cases where the normal sleep-wake cycle is disrupted [6]. In order to better understand the role arousals may play in this problem, we will evaluate and quantify their impact on the performance of actigraphy-based sleep/wake classifiers. II. METHODS AND MATERIALS A. Data Set In this study we used a data set comprising full PSG and simultaneously recorded actigraphy (Actiwatch, Philips Respironics) of 15 healthy subjects (10 females) with a Pittsburg Sleep Quality Index [12] of less than 6 and no record of respiratory or sleep diseases. The subjects had an average age of 31.0 (± 10.4) year. Nine subjects were monitored in the Sleep Health Center, Boston, USA during 2009 (Alice 5 PSG, Philips Respironics) and six subjects were monitored in the Philips Experience Lab, Eindhoven, the Netherlands during 2010 (Vitaport 3 PSG, TEMEC). Arousal scoring and sleep staging was performed by a sleep technician according to the guidelines of the American Academy of Sleep Medicine (AASM) [1]. Epochs were further labeled as sleep if they had a sleep stage score of N1, N2, N3, or REM and were labeled as wake otherwise. Sleep epochs in which an arousal was found were labeled as arousal. The average total sleep time was 6.67 (± 1.15) hour and the average sleep efficiency was 92.63 (± 3.68) %. Subjects had an average of 87.00 (± 61.50) arousals, corresponding to an arousal index of 13.00 (± 8.95) arousal/hour. B. Arousal Neighborhood and Annotations Body movements following the occurrence of arousals do not always occur in the same epoch as the arousal. This is the case, for example, when body movements extend beyond the boundary of the epoch when the arousal starts, or when the arousal starts close to the end of an epoch and is followed by body movements in the subsequent epoch. Since the actigraphy recordings and the sleep staging were performed in non-overlapping 30 second epochs, our analysis is bound to their fixed boundaries. For this reason, techniques which could alleviate this problem using, for instance, sliding windows, cannot be used here. Instead, we introduce the concept of an “arousal neighborhood”, consisting of an (integer) number of epochs immediately following an arousal epoch. The notation Anx is used to indicate a set of epochs which comprise the arousal epoch and the x following epochs. Each neighborhood is limited by x, the occurrence of the next arousal, or the occurrence of a wake epoch. The notation arousalx is used to indicate an epoch which belongs to Anx. Based on the manual annotations by the sleep technician we define the following additional sets:
S – epochs labeled as sleep.
A – sleep epochs during which an arousal was scored.
S-A – sleep epochs where no arousal occurred.
C. Class Similarity We first characterize the activity count values for each set of epochs introduced in the previous section. Using a Mann-Whitney unpaired 1-sided test [13], we determined whether activity counts in arousal epochs are significantly larger than in sleep epochs and whether (and to which extent) increasing the neighborhood size led to an increase in the value of activity counts. D. Sleep/Wake Classification The simplest way to classify sleep and wake is to analyze the activity counts measured during each epoch of the recording. When the activity counts are above a certain threshold, the epoch is classified as wake (positive class) otherwise it is classified as sleep. When a sleep epoch is erroneously classified as wake, it is considered a “false positive” (FP). Although several successful variations or additions to this method have been proposed, the performance of such a classifier ultimately depends on how well activity counts discriminate between sleep and wake. The threshold for sleep/wake classification was experimentally determined as the value T that maximizes the overall performance (Cohen’s kappa coefficient of agreement, κ [14]) of a simple epoch-based linear discriminant similar to one used by Devot et al. [7], across all subjects. Using this threshold we classified all epochs in the data set as sleep or wake. Based on the classification results, we analyzed the false positive rate (FPR, ratio between the number of false positives and the total number of epochs) for arousal neighborhoods of different sizes. This allowed us to determine whether the proportion of false positives occurring in A or Anx (for different values of x) was significantly larger than those occurring in S. We then evaluated how false positives were distributed over S-A, A and Anx. Here, instead of classifying each epoch, we classified each arousal neighborhood according to the maximum activity count in the epochs that comprise it. If that value was above the threshold T, the whole neighborhood was considered to have a false positive. Finally, we evaluated the performance of the classifier. Receiver operating characteristic (ROC) curves are not wellsuited for this problem since wake and sleep are imbalanced (92.8% of the epochs in our data set were labeled as sleep) [15]. Recall (or sensitivity) was computed as the ratio between the number of true positives (TP, wake classifications occurring on epochs labeled as wake), and the total number of epochs labeled by the sleep technician as wake. Precision (or positive predictive value) was computed as the ratio between TP and the number of positive classifications (TP+FP), using different criteria for TP and FP (Table I). These criteria allowed us to analyze how the presence of arousals influenced classification performance under different conditions. PW corresponds to a “standard” precision which disregards the presence of arousals. P-A and P-Anx correspond to the precision of the classifier if there were no arousals.
6761
TABLE I.
CRITERIA USED TO COMPUTE PRECISION TP
PW P+A P+Anx P-A P-Anx
classif. wake wake wake wake wake
TABLE II.
FP
label wake wake wake wake | arousal wake | arousalx
classif. wake wake wake wake wake
Set 1 S-A A An1 An2
label sleep sleep & !arousal sleep & !arousalx sleep & !arousal sleep & !arousalx
COMPARISON BETWEEN ACTIVITY COUNTS
median(ac1) 0.00 0.20 0.24 0.40
Set 2 A An1 An2 An3
median(ac2) 0.20 0.24 0.40 0.72
p* < 0.001 < 0.005 0.15 0.22
*Significance was tested with a Mann-Whitney unpaired 1-sided test. median(ac1) and median(ac2) represent the median of the activity count values for set 1 and 2.
“&”,”|” and “!” represent the logical operators “and”, “or” and “not”.
This would be the case if we were able to automatically detect all epochs with or immediately following arousals. P+A and P+Anx give an estimate of precision in applications where arousals with similar characteristics as wake have the same importance as actual wake epochs and therefore should not be considered false positives, for an example when analyzing sleep fragmentation.
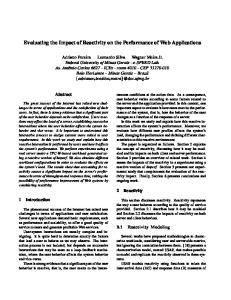
Figure 2. κ for sleep/wake classification using different thresholds.
III. RESULTS A. Class Similarity Table II compares the activity count values in different sets of epochs. We found the values in A to be significantly larger than in S-A. The values in An1 are also significantly larger than in A. Increasing the neighborhood size beyond one epoch does not lead to a significant increase in the activity count values. B. Sleep/Wake Classification Fig. 2 illustrates the κ obtained after sleep/wake classification using different thresholds. At the threshold T of 28.88 we obtained the maximal κ of 0.42. At this threshold, there was furthermore a significant difference between the FPR for A (12.2%) and for An1-8 and the FPR for S (4.0%) (Fig. 3). This means that the fraction of epochs with arousals (or in the neighborhood of arousals) with high activity counts is significantly larger than it is, overall, in sleep epochs.
Figure 3. FPR for S (∞), A (0) and Anx. *, † and ‡ indicate neighborhoods with FPR significantly larger than for S at p<0.001, p<0.005 and p<0.05, respectivly, with a chi-square test with Rao-Scott correction for correlated data [16].
Fig. 4 illustrates a stacked plot with the distribution of false positives (sleep epochs with activity counts above T) over different sets of epochs. A large percentage (41.1% in the subject pool) of all false positives occurs in epochs with arousals (25.0%) and within one or two epochs following an arousal (12.5% and 3.6% respectively). Table III indicates the recall and precision using T. P-An1, P-An2, P+A, P+An1, and P+An2 are significantly larger than the standard precision PW. Fig. 5 illustrates the performance obtained with different thresholds for the criteria in Table I. There is an overall performance increase when arousals are considered. This can be further confirmed in Fig. 6, where the precision increase for each criterion is plotted. Excluding arousal neighborhoods (P-An2), we obtain an average precision increase of 11.9% (maximum increase of 17.2% for a recall of 43.4%). Considering positive classifications on arousal neighborhoods as true positives (P +An2), the average precision increase is 20.0% (maximum increase of 31.3% for a recall of 67.1%).
Figure 4. Percentage of FP per set. “P” indicates the subject pool. “S-An2” indicates the set comprised of all sleep epochs not in the neighborhood (of size 2) of arousals.
TABLE III.
RECALL AND PRECISION WITH A THRESHOLD OF 28.88
Recall (%)
Precision (%) PW
P-A
P-An1*
P-An2†
P+A*
mean (std)
47.4 (23.3)
43.9 (18.8)
50.6 (20.2)
56.6 (18.7)
59.3 (18.2)
57.9 (16.7)
Pooled
45.0
47.2
54.4
61.2
64.0
60.4
*, † and ‡ indicate precision significantly larger than for W, at p<0.05, p<0.01 and p<0.001 respectively, using a chi-square test with Rao-Scott correction for within-subject correlations [16].
6762
findings reported in this paper also hold when such features are considered and whether they are also valid in subjects with disrupted sleep-wake cycles. ACKNOWLEDGMENT The authors thank Els Møst and Adrienne Heinrich for their critical review of this manuscript. REFERENCES [1] Figure 5. Precision-recall curves for different precision criteria. Area under each curve, computed with the algorithm by Davis and Goadrich [15]: PW: 45.2%, P+A: 55.6%, P+An2: 67.4%, P-A: 49.4%, P-An2: 55.6%.
[2] [3] [4] [5]
[6] [7] Figure 6. Precision increase with different criteria. Average precision increase: P+A: 9.4%, P+An2: 20.0%, P-A: 4.8%, P-An2: 11.9%.
[8]
IV. DISCUSSION AND CONCLUSIONS Our results confirm that the activity counts in sleep epochs with and following arousals are significantly larger than in other sleep epochs. Using a threshold optimized for overall sleep/wake classification performance we found that 41.1% of all false positive classifications actually occur in epochs with or immediately following arousals. We also found that the average proportion of false positives (FPR) occurring in these epochs is more than three times larger than the proportion of false positives occurring in all sleep epochs (12.2% and 4.0% respectively). These results have important consequences. First, they mean that unless arousals can be detected, the precision of an actigraphy-based sleep/wake classifier will always be limited. If positive classifications occurring on these epochs can be automatically excluded, the precision of the classifier can increase by a maximum of 17.2%. Alternatively, if we cannot reliably detect the presence of arousals during sleep but instead consider positive classifications on arousal epochs as correct, the precision of the classifier increases by a maximum of 31.3%. These findings are in line with earlier observations that body movements may follow cortical arousals during sleep [9]. However, the physiological consequences of these events are not limited to body movements. In fact, the sympathetic surge corresponding to the occurrence of an arousal is also manifested at cardiac level [9]. Interestingly, recent work in sleep/wake classification showed that the addition of cardiac features to actigraphy increases sensitivity to the wake class [7],[17]. In follow-up studies we will investigate whether the
[9] [10] [11]
[12]
[13] [14] [15] [16] [17]
6763
C. Iber, S. Ancoli-Israel, A. L. Chesson, and S. F. Quan, The AASM manual for the scoring of sleep and associated events: rules, terminology and technical specifications. American Academy of Sleep Medicine, 2007. A. Sadeh and C. Acebo, “The role of actigraphy in sleep medicine,” Sleep Medicine Reviews, vol. 6, no. 2, pp. 113–124, 2002. R. Cole, D. Kripke, W. Gruen, D. Mullaney, and J. Gillin, “Automatic sleep/wake identification from wrist activity,” Sleep, vol. 15, no. 5, p. 461, 1992. T. Morgenthaler et al., “Practice parameters for the use of actigraphy in the assessment of sleep and sleep disorders: an update for 2007,” Sleep, vol. 30, no. 4, p. 519, 2007. J. Hedner, G. Pillar, S. D. Pittman, D. Zou, L. Grote, and D. P. White, “A novel adaptive wrist actigraphy algorithm for sleep-wake assessment in sleep apnea patients,” Sleep, vol. 27, no. 8, pp. 1560– 1566, 2004. J. Paquet, A. Kawinska, and J. Carrier, “Wake detection capacity of actigraphy during sleep,” Sleep, vol. 30, no. 10, p. 1362, 2007. S. Devot, R. Dratwa, and E. Naujokat, “Sleep/wake detection based on cardiorespiratory signals and actigraphy,” Engineering in Medicine and Biology Society (EMBC), 2010 Annual International Conference of the IEEE, pp. 5089–5092, 2010. D. Pitson and J. Stradling, “Autonomic markers of arousal during sleep in patients undergoing investigation for obstructive sleep apnoea, their relationship to EEG arousals, respiratory events and subjective sleepiness,” Journal of Sleep Research, vol. 7, no. 1, pp. 53–59, 2002. P. Halász, M. Terzano, L. Parrino, and R. Bódizs, “The nature of arousal in sleep,” Journal of Sleep Research, vol. 13, no. 1, pp. 1–23, 2004. “EEG arousals: scoring rules and examples: a preliminary report from the Sleep Disorders Atlas Task Force of the American Sleep Disorders Association,” Sleep, vol. 15, no. 2, pp. 173–184, 1992. G. Jean-Louis, F. Zizi, H. Von Gizycki, and P. Hauri, “Actigraphic assessment of sleep in insomnia: application of the Actigraph Data Analysis Software (ADAS),” Physiology & Behavior, vol. 65, no. 4, pp. 659–663, 1998. D. J. Buysse, C. F. Reynolds, T. H. Monk, S. R. Berman, and D. J. Kupfer, “The Pittsburgh Sleep Quality Index: a new instrument for psychiatric practice and research,” Psychiatry Research, vol. 28, no. 2, pp. 193–213, 1989. H. B. Mann and D. R. Whitney, “On a test of whether one of two random variables is stochastically larger than the other,” The Annals of Mathematical Statistics, vol. 18, no. 1, pp. 50–60, 1947. J. Cohen, “A coefficient of agreement for nominal scales,” Educational and Psychological Measurement, vol. 20, no. 1, pp. 37– 46, 1960. J. Davis and M. Goadrich, “The relationship between Precision-Recall and ROC curves,” Proc. 23rd Int. Conf. Machine learning, pp. 233– 240, 2006. J. Rao and A. Scott, “A simple method for the analysis of clustered binary data,” Biometrics, pp. 577–585, 1992. X. Long, P. Fonseca, R. Haakma, R. M. Aarts, and J. Foussier, “TimeFrequency Analysis of Heart Rate Variability for Sleep and Wake Classification,” Proc. 2012 IEEE 12th Int. Conf. on Bioinformatics & Bioengineering (BIBE), 2012.