1
On the digital trail of mobile cells
Christophe Zimmer, Bo Zhang, Alexandre Dufour, Aym´eric Th´ebaud, Sylvain Berlemont, Vannary Meas-Yedid, and Jean-Christophe Olivo-Marin
Quantitative Image Analysis Unit, Institut Pasteur, 25-28 rue du Docteur Roux, 75015 Paris, France. Acknowledgments: We thank our collaborators in the labs of N. Guill´en, S. Tajbakhsh, R. M´enard, and F. Amblard for having stimulated some of our work on cell tracking, which was funded by Institut Pasteur, notably through two ’Programme Transversal de Recherches’ projects. January 30, 2006
DRAFT
2
I NTRODUCTION Cell migration is a field of intense current research, where biologists increasingly rely on methods and expertise from physics and engineering. Signal processing approaches can contribute significantly to this research, notably to help analyze the exploding quantity of imaging data produced with standard and new microscopy techniques. In the following 1 , we first provide a brief background on the importance of understanding cell movements, then review a selection of current efforts on tracking moving cells, with an emphasis on deformable model approaches. We will point out some of the main difficulties posed by cellular imaging, discuss advantages and limitations of different tracking techniques and suggest a few directions for future advances. Cell migration in biomedical research: Most animal cells are able to generate forces which allow them to change their shape and move on substrates such as glass or inside organisms [3]. Cell migration is central to several fundamental biological processes, many of which have important medical implications. For example, cells of a developing embryo migrate to distant locations, where they differentiate into specific cell types to shape different organs; failures of this process can have dramatic consequences such as brain malformations. In the adult organism, activated cells of the immune system migrate towards sites of inflammation to target infectious agents; overstimulated immune cells, however, can cause diseases such as arthritis. Metastatic cancer occurs when tumor cells migrate through neighboring tissue, reach the blood stream and disseminate. As a final example, the shape of cells plays an important role in determining cell fate during embryonic development [4]. Understanding the mechanisms of cell migration and morphology and how they can be controlled to prevent or cure disease is thus a central goal for biomedical research. Engineers and physicists can play an important role in this research, on several fronts. First, a complete understanding of cell movements will require elaborate mechanical models based both 1
some ideas expressed in this paper have been previously discussed in [1] and [2].
January 30, 2006
DRAFT
3
on principles from physics and on knowledge derived from purely biological studies. Second, important insights can be gained with the help of techniques to manipulate living cells, e.g. optical tweezers, electric fields, or micro-engineered substrates. Third, microscopy technologies are crucial to study the spatial inhomogeneities and temporal variations within cells that are required for cells to actively migrate. Fourth, of more immediate interest to the signal processing community, powerful automated methods are needed to exploit the rapidly accumulating wealth of imaging data. The need for automated image analysis: An obvious and perhaps the strongest reason that calls for computerized approaches is the sheer quantity of data to be analyzed. The amount of data needed to understand cell migration is considerable, for several reasons: First, hundreds of genes and many more proteins are involved in the regulation of the cytoskeleton, the dynamic network of flexible filaments that underlies cell shape and motion. Although many studies focus on individual proteins, a full understanding of cell motility will come from investigating protein interactions. This requires high-throughput screens, where very large numbers of protein combinations at various concentrations are altered, e.g. by mutations or drug compounds. Second, in contrast to other cell phenotypes, the motility of a cell generally cannot be characterized from a single image. Since cell migration is to a large extent stochastic [3], only statistical moments of trajectory parameters are meaningful, thus many time points are needed to reliably quantify motion characteristics of individual cells. In addition, inter-cellular variability implies that large numbers of cells must be observed. Next to quantity, another important reason to turn to computerized methods is quality. Current studies of cell migration still often rely on manual (though generally computer-assisted) quantification of cell trajectories. In addition to being laborious, manual analyses lack reproducibility and objectivity and are unpractical, when not impossible, in 3D.
January 30, 2006
DRAFT
4
T RACKING CELLS : DIFFICULTIES ,
SOLUTIONS AND OPEN PROBLEMS
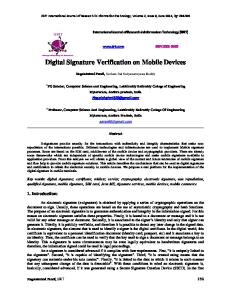
We now turn to the image analysis problem of tracking cells from dynamic microscopy data. We will confine the discussion to methods that segment and track individual cells, i.e. where the extracted information reduces to a description of each cell’s outline (in 2D) or surface (in 3D), plus indications allowing to link the segmented regions in time. This is an important restriction, since both collective cell motion and intracellular flows can be analyzed without identifying single cells, e.g. by optical flow techniques [5]. Similarly, we will not discuss the dynamics of intracellular molecules that underlies cell plasticity and motion (see the review on tracking at the molecular scale by Meijering et al. in this issue). Standard tools and their shortcomings: Commercial microscopy software packages generally feature tools for object segmentation and tracking, mostly based on standard image processing schemes. Segmentation is typically done by thresholding, preceded by smoothing, possibly followed by morphological operations such as closing holes, and labeling of connected components. For dynamic tracking, segmented regions may then be linked in time by nearest neighbor matching. Alternatively, simple segmentation-free tracking methods are available, such as correlation matching, where the position of an object is computed as the pixel whose neighborhood maximizes the correlation with the object’s neighborhood in the previous frame or a manually defined reference frame. Such processing methods can be used with some success to track well contrasted, spatially isolated cells of fixed shapes, e.g. fluorescent bacteria. However, simple intensity based thresholding fails for cells observed in non-fluorescent imaging modes, as in Figs. 1a,b, and for cells in contact as in Figs. 1a,b,c,d. Likewise, standard correlation matching cannot keep track of cells that change shape, as those in Figs. 1a,b,d. Such limitations are often partly compensated by graphical user interfaces that allow users to correct processing errors, but at the expense of speed and reproducibility, the main benefits of automation. In the following, we discuss a few efforts by us and other groups to develop more powerful cell tracking techniques based on more advanced work in the computer vision community. January 30, 2006
DRAFT
5
Approaches to cell tracking: Current efforts on cell tracking originate from diverse applicative motivations, and rely on a variety of methodological approaches. The diversity of cellular imaging data makes a systematic categorization of existing methods difficult, not to speak of performance comparisons a situation that is in contrast to the problem of tracking simpler objects such as diffraction limited particles (see Meijering et al., this issue). Despite the lack of a unified framework and applicative dispersion, several problems are recurrent in diverse cell tracking applications and have often led to similar solutions. Although we acknowledge that other approaches may be equally worthwhile, we also believe that the specific set of methods provided by active contours and deformable models (see below), is particularly adapted to the problem of tracking highly deformable cells. Consistently, this framework has been adopted for cell tracking by several groups working independently [6], [7], [8], [9], [10], [11], [12]. This review will therefore emphasize methods related to this framework, though a few other techniques will also be mentioned. In the remainder of this section, we give a brief introduction to deformable models, then discuss some of the main difficulties in applying them to cell tracking and solutions proposed to overcome them. Deformable models for cell segmentation and tracking: Deformable models, originating mostly from the work of [13], are closed fronts (curves in 2D or surfaces in 3D) that iteratively evolve in the image domain, usually according to a gradient descent algorithm designed to minimize a cost function E . This cost function, E = αEI + (1 − α)EP contains both image-related terms, which tend to be minimal when the front is at the object boundary, and image-independent terms that embody prior information on the computed boundary and play the role of regularizers in ill-posed problems [13]. For example, the image-dependent terms, EI , may contain statistical measures of the intensity or texture over regions defined by the front, or integrals along the front of an edge indicator function such as the gradient magnitude (EI =
H
|∇I| ds in 2D). The image-independent term, EP , is typically a penalty on total
boundary length (EP = January 30, 2006
H
ds in 2D) or curvature, but can also comprise global constraints such as
DRAFT
6
similarity of the front to a given reference shape. Deformable models thus allow to simultaneously fulfill demands from the image and prior information reflecting biological knowledge. Via the weights of the different energy terms (such as α), they allow a control over the relative importance of these different, possibly conflicting, constraints. Thanks to this, deformable models in general compare favorably with multi-step procedures where image information is first used ”blindly” to compute intermediate segmentations, and where external knowledge is applied at a later stage to correct the segmentations, for instance by eliminating regions of unrealistic size or shape, e.g. [14]. In such multi-step procedures, errors made at different stages of processing tend to multiply. Deformable models also provide a flexible framework, because suitable energy terms can be defined depending on the image characteristics and prior knowledge specific to a given application. Accordingly, these methods have found extremely widespread use in computer vision, especially in medical imaging (see e.g. [15] for a review). Two main categories of deformable models can be distinguished according to the mathematical representation of the contour or surface: explicit models, where the boundary is represented by parametric functions (e.g. [13]), and implicit models, where the boundary is defined as the zero level set of a scalar function defined over the image domain (e.g. [16]). As discussed below, the two techniques have well-known advantages and drawbacks, which both come to bear in cell tracking - therefore we and others opportunistically employ one or the other technique for different imaging problems.
Difficulties and solutions Fluorescent and non-fluorescent cells: As can be seen from Fig.1, the appearance of cells strongly depends on the type of microscopy used for imaging. An important distinction is that between fluorescent (Figs. 1c,d) and non fluorescent (Figs. 1a,b) microscopy techniques. The latter, which include phase contrast microscopy, bright field microscopy and differential interference contrast microscopy (DIC), are
January 30, 2006
DRAFT
7
still often used to image moving cells because they allow prolonged observations with little alterations of cell physiology. In these techniques, contrast generation relies on the spatial variations in refraction index and absorption coefficient of unstained biological materials [17]. Unlike in fluorescence images, regions occupied by cells do not necessarily have consistently higher (or lower) intensities than the background (e.g. the glass slide). Instead, cells may appear as regions of non-uniform intensity and display darker regions at their edges surrounded by brighter regions, or vice-versa (see Figs. 1a,b), depending on their positions with respect to the focal plane. In these images, the average intensity of the image region occupied by a cell can be approximately equal to that of the local background, thus precluding segmentation by simple intensity thresholding. However, such images can often be transformed into images resembling those of fluorescence microscopy with the help of simple texture filters such as standard deviation [18], [19] or mean absolute difference [20], [9]. Indeed, cells that are sufficiently in focus often appear as textured regions due to small intracellular structures such as vesicles, on a locally rather uniform background if imaged on glass slides (Figs. 1a,b). However if the cell texture is blurred due to loss of focus, or when the background is substantially inhomogeneous, such filters may become ineffective [8], [21]. This is the case, for instance, for leukocytes rolling in small blood vessels observed by intravital microscopy [8]. These cells may even appear brighter than the background in one frame, and darker in the next [8]. This led the authors of [8] to develop an active contour method that targets edges rather than regions. To increase the limited capture range that plagues standard [13] edge oriented active contours, a gradient vector flow technique was employed, that propagates gradient information throughout the image domain [8]. A very different example is a method designed to track cancer cells in phase contrast microscopy with particularly ill defined cell boundaries, due notably to change of focus [21]. This method uses a crude shape model consisting in the 8 mass centers of a combination of kernels that represent alternating bright and dark grey level patterns, as are visible for cells at different degrees of defocusing. The model is adjusted to the image by coupled mean shift processes, in a scheme that
January 30, 2006
DRAFT
8
achieves robust cell tracking, but abandons the goal of accurate segmentation [21]. Fluorescent dyes allow to label specific cellular structures, and in multi-photon microscopy, enable imaging of cells deep inside tissue. To outline the cell boundary, one may use fluorescent markers that target the cell membrane, or that diffuse throughout the cell cytoplasm and provide relatively uniform staining [22], [10], [1]. Depending on the type of labeling, the image-dependent term of deformable models can be defined in a boundary-oriented or region-oriented manner. For example, [22] and [12] use front evolution methods to segment images with fluorescently stained nuclei and/or cell membranes, in which the front velocity is a function of the smoothed image gradient [22] or distance to a thresholded edge map computed from the first and second derivatives of the image intensity [12]. For cells labeled with non specific (cytoplasmic) fluorophores, we used a region oriented energy based on intensity variance inside and outside the boundary, which is remarkably robust at low signal to noise ratios [1], an important advantage for imaging at high temporal resolution (i.e. with small exposure times) or for extended periods (before loss of fluorescence due to photobleaching). Although the largely empirical techniques mentioned above have been applied with reasonable success, a more principled and potentially powerful -but insufficiently explored- approach is to incorporate knowledge about the process of image formation by the microscope. An interesting example is [23], where a model of the optics is used to construct templates of cells in DIC imaging that can be used in cell detection by correlation matching. These templates are computed from the cell’s optical thickness map, which for transparent cells is either derived from theory (for cells of simple geometry such as spherical algal cells), or directly extracted from the image. For more complex, non-transparent cells, the optical thickness can be obtained from the DIC image combined with a brightfield image of the same cells [23]. Similarly, we recently described a first version of a fluorescent bacteria detection algorithm [24] based on a non-deformable parametric model of the bacterium and a model of the microscope point spread function (PSF, see review by Auget et al., this issue) and the noise. Deformable models could likewise be
January 30, 2006
DRAFT
9
extended by incorporating a model of the imaging process. Such extensions would give a physical basis to the image dependent energy terms and are bound to improve the segmentation of objects corrupted by noise and blur, in effect performing simultaneously segmentation and deconvolution. Cell shapes and deformations: Another important difficulty for cell tracking is the diversity of cell shapes, also apparent in Fig. 1. On the simpler end, round blood cells or algal cells [23], pill-shaped bacteria [24], or crescent-shaped sporozoites (infectious malaria agents, Fig. 1c) move essentially without noticeable shape changes (gliding motility). For such cells, outlining is not instructive, and can be replaced by a simpler estimation of the cell position, defined for instance by its center of mass. Correlation tracking techniques may already yield acceptable results. But in very noisy images or if illumination or focus varies, more robust results are expected from methods that do not require a specific template of the cell’s image, but make use of an a priori known shape as a strong constraint together with more flexible image-dependent constraints. A good example is the leukocyte tracking method of [8], which constrains active contours to be approximately elliptical and of roughly constant size, and can thereby cope with large changes of contrast and clutter. Another example is a variant of the kernel model of [21] used to handle the ”funnel” geometry sometimes adopted by rapidly moving cells. However, most animal cells (including those in Figs. 1a,b,d) are highly plastic and move by actively changing their shape in a cyclic coordinated process that involves membrane extensions at the leading edge, attachment to the substrate, detachment at the rear, and contraction (crawling motility) [3]. For such cells, accurate descriptions of morphological changes are of great interest to the understanding of motility, but are also more challenging to extract. Standard deformable models use energy terms EP that penalize quantities such as boundary length and/or curvature. With adequate weights, these constraints appear to be well adapted to cells such as unicellular amoebae (Fig. 1a), which exhibit considerable shape variations, but whose membranes remain relatively smooth despite blunt protrusions called pseudopodia [9], [1]. Cells such as macrophages or fibroblasts (Fig. 1b), however, can take even more complex shapes
January 30, 2006
DRAFT
10
with membrane extensions resembling sheets (lamellipodia) or spikes (filopodia). The latter features are a challenge to most deformable models, because they violate the smoothness constraints [6]. Deformable models where the smoothness constraints can be relaxed at a limited number of high curvature points may provide a solution, but have not been applied yet. As for the image dependent energy terms EI , the choices of specific energy terms EI and their corresponding weights are to a large extent empirical. Significant improvements may be expected from models where these empirical terms are replaced by energies based on biophysical knowledge of the properties of cellular membranes. From 2D to 3D: Although most studies on cell motility are still done in 2D [8], [9], [21], it is known that cell migration can be very different in 3D environments. For instance, tumor cells treated with drugs that block migration on 2D substrates can still move inside an artificial 3D collagen matrix by means of a very different type of motility [25]. Thus, it is increasingly necessary to image moving cells in 3D. Obviously, 3D imaging is also necessary to fully characterize cell shape, even for cells moving on 2D substrates. Therefore, several methods to analyze cells from 3D images are being developed [20], [26], [14], [1]. In [20], individual slices of DIC image stacks are outlined automatically, then a triangulation is performed to provide a faceted reconstruction of the cell in 3D. Such an essentially 2D method does not allow, however, to directly incorporate three-dimensional constraints, such as smoothness, volume or shape, which are useful to improve segmentation of noisy images [1], [12], [27]. A fully 3D alternative are active surfaces, as used in [27], [12] and [1] to segment cells in 3D fluorescence microscopy. All three methods employ the level set representation, which can be relatively easily extended to higher dimensions, in contrast to parametric models. The 3D character of the technique also allowed us [1] to incorporate the biological constraint that cell volumes remain approximately constant on the time scale of observations thanks to a regulation of osmotic fluxes by the cell (volume homeostasis). Similarly, the strong robustness to image noise [27], [1] can be attributed partly to the 3D spatial interpolation property
January 30, 2006
DRAFT
11
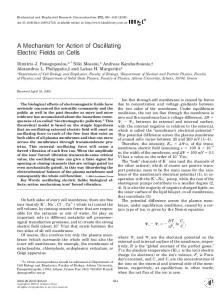
inherent to the active surface approach. Cell contacts: A recurrent problem when tracking multiple cells is posed by cells that touch or overlap each other, because the boundary between cells in contact is often difficult to identify automatically, and often also by eye [9], [11], [14], [22], [1]. These situations can of course be avoided by studying cells in isolation [6], [20], [10]. However, cells interact with each other and cell-cell interaction are known to influence migration [3], thus cannot always be ignored. Inter-cellular contacts range from occasional [9], [8], [1] to constant, the extreme case being that of cells packed inside a tissue (Fig. 1d, [1]) or a growing embryo [22], [28], [14], where the intercellular space becomes negligible. Different solutions have been proposed to handle cells in contact. An important special case are cells with highly constrained shapes, as discussed above. These constraints can be exploited to discriminate cells that touch or even partly occlude each other - such as elliptical leukocytes [8] or Candida yeast cells [23] -, but as discussed above, are not applicable to highly plastic amoebae [9] or cancer cells [21]. Independently evolving deformable models [13], [16] would normally merge adjacent cells. To prevent this, we and others use front evolution methods that constrain different fronts not to overlap [22], [29], [1]. Although this added constraint effectively prevents contours from overlapping, the cell boundaries may still be incorrectly located in the absence of strong intensity gradients at the cell-cell interface. Global imageindependent constraints such as volume conservation [1] can only help computing plausible boundaries; to capture the true boundary, additional image information will need to be incorporated, e.g. the optical flow [5]. Cell segmentation becomes very challenging in tissue, where cellular membranes often cannot be reliably attributed to individual cells (see Fig. 1d). The difficulty can be partly avoided by staining nuclei instead of the cell cytoplasm [27], [1]. Stained nuclei often remain distinguishable even in growing tissue owing to their generally convex shape and the background provided by the non-fluorescent (or differently stained) cytoplasms. Fig. 2a shows an example from [1], where nuclei of growing epithelial cells (Fig.
January 30, 2006
DRAFT
12
1d) are automatically segmented and tracked despite close contacts. In [28], both individual cells and nuclei of a growing C. elegans embryo are reconstructed and followed in time, but outlining is done manually. In [22], an automatic method is described to segment both tissue cells and nuclei with stained membranes from static images. It uses fronts that grow outwards from unique seeds inside each cell/nuclei, are attracted to stained membranes and forbidden to overlap. The seeds are either placed manually or computed by a scheme similar to the Hough transform, which is adapted to nuclei or cells of relatively compact shapes, but may not be generalizable to more complex cell shapes. A more general solution and extension to [26], [27] and [1] may be achieved with two types of active surfaces coupled by geometrical set inclusion relationships, one targeting stained nuclei, while the other targets cell membranes stained in a different color, as in Fig. 1d. Dividing and incoming cells: Of particular interest in the study of developing embryos, proliferating stem cells or cancer cells is the ability to detect cell divisions. This allows to construct cell lineage trees, and analyze cellular phenotypes in relationship with their ancestry. Changes in object topology are an easy task for level set techniques, as illustrated in Fig. 2b (from [1]) in contrast to native parametric models, which have rigid topology. As already discussed, this topological flexibility has a flip-side [27], [9], [1] since distinct cells will normally be merged into a single object as soon as they touch, but coupling multiple level sets with an overlap penalty offers a solution [1]. Symetrically, parametric models can be extended to handle division at the cost of adding relatively complex reparametrization schemes [9]. Both explicit and implicit deformable models can thus be adapted to embody the biological knowledge that cells can divide, but (except in very special cases) do not merge. Other approaches, such as the essentially segmentation-free mean-shift algorithm of [21], are less suited to handle object divisions than object fusions. Thus, the method [21] is applied in reverse: starting from the end of the sequence, objects are tracked backwards in time until they are too close to each other to represent distinct cells, in which case they are merged into a single object [21].
January 30, 2006
DRAFT
13
Note that new cells can also appear in the image simply by moving into the field of view. This is a problem for parametric active contours [9], [8], [11] and other methods [21], which can only follow cells already present on the first frame of the sequence. With the level set approach, however, a deformable model initialized on the boundary of the observation volume can be used to capture incoming cells. This can also be done for the first frame of the sequence to avoid the manual initialization step required by parametric active contours [9], [8] and [11]. Cell displacements and temporal sampling: An obvious issue when tracking multiple cells is how to link segmented cells between time frames. In model-free segmentation methods, such as thresholding, one typically assigns a score based on distance moved and some measure of cell similarity to each candidate match, then chooses the match with the highest score. Good similarity criteria, unfortunately, are hard to find: image features based on intensity or texture generally show little differences among cells; shape is neither a suitable feature for crawling cells, which move by deforming their surface, nor for gliding cells, which have mostly identical shapes; kinetic features, such as direction and speed, are not sufficiently predictive in typical cellular random walks -although exceptions exist such as spinning sporozoites (Fig. 1c), or cells carried by a blood flow, for which position predictions by Kalman filtering can be used [8]. With deformable models, the link is usually done implicitly by propagating the converged contour of the previous frame for variational segmentation of the current frame [13], [9], [8], [11]. This typically requires inter-frame cell displacements smaller than the cell diameter, which in turn imposes a sufficiently high temporal sampling rate. Achieving such rates is mostly unproblematic in 2D imaging, but in 3D imaging this can impose a stringent trade-off between number of slices (i.e. axial resolution), and exposure time (i.e. contrast). This underscores the importance of using a framework powerful enough to handle low signal to noise ratios.
January 30, 2006
DRAFT
14
Validation As for all image analysis methods, quantitative validation against a ground truth is critical. In 2D image sequences, even non-experts can usually determine reliable cell tracks, albeit at a significant time cost. Manually generated tracks can then be used as ground-truth for evaluation, at least within the error margin of human tracking, which can be estimated with multiple operators [9]. Such evaluations were done e.g. in [9], [8], [21], [19], and tracking performance was assessed in terms of localization errors and the percentages of cells correctly tracked (i.e. with a tolerable localization error). The latter measure can also be obtained more conveniently by visual inspection and classification (good vs. bad) of automated tracks. Reported tracking performances range from 70% to almost 100% [9], [8], [21], [19], but the considerable differences among the investigated images make comparisons mostly meaningless. Quantitative evaluations of segmentation performance is difficult, because manual segmentations are much more time-consuming and subjective, especially for 3D images. Nevertheless, classifications of segmentations by experts with the help of adequate visualization software has been used to evaluate segmentation quality e.g. by [26], [14]. Considerably faster, more accurate and reliable evaluations can of course be done on simulated data, where the ground truth is known to perfect precision. In addition, this allows to quantify how the performance is affected by various factors, such as image noise and blur or object shape, see e.g. [26], [27], [22], [1]. The central difficulty here is to capture enough of the variability of real images to reliably predict image analysis results. A different, complementary approach is to use real images of objects of known geometries, such as fluorescent beads, as done in [27]. This allows to account for degradations due to the imaging set-up, but does not capture the complexity of cell shape and staining heterogeneity. Finally, partial validations on real images of real cells are sometimes possible by assessing measures of extracted cell parameters whose properties are known a priori and are not constrained by the image analysis procedure. An example is to verify the constancy of extracted cell volumes in methods that do not impose this as a constraint, e.g. [28] (or [1] without volume constraint). January 30, 2006
DRAFT
15
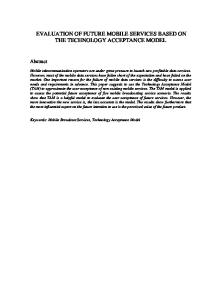
O UTLOOK Limitations and perspectives: Despite many efforts, only a portion of which could be covered here, the goal of fully automated and reliable cell tracking remains elusive. Current methods suffer from shortcomings in several important respects: First, practically all the methods discussed above require at least a handful of arbitrary parameters (e.g. the weights of different energy terms in deformable model algorithms, such as α) that must be tuned empirically for each different data set or type of image. This in effect reintroduces laborious user-intervention, hinders reproducibility, and offers no guarantee that the choice of parameters is optimal. Second, although the accuracy of automated tracking techniques often exceeds manual tracking accuracy on average, automated tracking is more vulnerable to drastic errors. Improving the performance of deformable cell tracking models will likely require using additional sources of information from the image, such as the motion (e.g. optical flow) or more complex statistical models of cell appearances and shapes. More global optimization methods may also help. Alternatively, machine learning approaches could be used to set processing parameters based on a few user-supplied segmentations and tracking examples. Significant improvements in this field may come simply from adopting methodologies already developed in the general computer vision literature. However, the most powerful future cell tracking methods will likely come from a better integration of the microscope optics as well as some knowledge from biophysics (for the latter, however, care will be needed to avoid introducing biases on the very cell properties that the methods are intended to extract). Finally, a statistical framework is highly desirable that would allow to provide confidence levels to all extracted cell tracking data. Applications: Space limitations do not allow us to adequately discuss how cell tracking can be put to use in biological research. Many examples can be found in [30]. Figure 3 illustrates how a simple analysis (power spectrum of changes in area enclosed) of an active contour tracking a crawling amoeba reveals the presence of a regularity (4s-periodicity) in an apparently random succession of membrane deformations. This periodicity, which may hint at an underlying biochemical clock, is invisible by January 30, 2006
DRAFT
16
simple visual inspection of the images and would most likely have remained hidden in the absence of computerized quantification. This illustrates how computerized quantitative image analysis can not only help to answer biological questions, but can also play a role in uncovering previously unsuspected phenomena that raise new biological questions.
R EFERENCES
[1] A. Dufour, V. Shinin, S. Tajbakhsh, N. Guill´en, J.-C. Olivo-Marin, and C. Zimmer, “Segmenting and Tracking Fluorescent Cells in Dynamic 3-D Microscopy with Coupled Active Surfaces,” IEEE Trans. Image Proc., vol. 14, no. 9, pp. 1396–1410, September 2005. [2] C. Zimmer, B. Zhang, S. Blazquez, E. Labruy´ere, F. Frischknecht, R. M´enard, N. Guill´en, and J.-C. Olivo-Marin, “Automated cell tracking tools for quantitative motility studies,” in American Institute of Physics Conf. Proc., vol. 75, 2004, pp. 177–184. [3] D. Bray, Cell movements.
Garland, New York, 2001.
[4] R. McBeath, D. M. Pirone, C. M. Nelson, K. Bhadriraju, and C. S. Chen, “Cell shape, cytoskeletal tension, and RhoA regulate stem cell lineage commitment,” Developmental Cell, vol. 6, no. 4, pp. 483–495, April 2004. [5] K. Miura, “Tracking movement in cell biology,” in Advances in Biochemical Engineering/Biotechnology.
Springer, 2005, pp. 267–295.
[6] F. Leymarie and M. D. Levine, “Tracking Deformable Objects in the Plane Using an Active Contour Model,” IEEE Trans. Pattern Anal. Machine Intell., vol. 15, no. 6, pp. 617–634, 1993. [7] K. Giuliano, R.DeBiasio, P. Feineigle, and D. Taylor, “Toward the Automated Dissection of Morphological and Molecular Dynamics of Living Normal and Transformed Cells,” in Motion analysis of living cells, D. R. Soll and D. Wessels, Eds.
January 30, 2006
Wiley-Liss, 1998, pp. 53–65.
DRAFT
17
[8] N. Ray, S. Acton, and K. Ley, “Tracking Leukocytes In Vivo With Shape and Size Constrained Active Contours,” IEEE Trans. Med. Imag., vol. 21, no. 10, pp. 1222–1235, October 2002. [9] C. Zimmer, E. Labruy`ere, V. Meas-Yedid, N. Guill´en, and J.-C. Olivo-Marin, “Segmentation and Tracking of Migrating Cells in Videomicroscopy with Parametric Active Contours,” IEEE Trans. Med. Imag., vol. 21, pp. 1212–1221, 2002. [10] D. Dormann, T. Libotte, and C. W. T. Bretschneider, “Simultaneous quantification of cell motility and protein-membrane-association using active contours,” Cell Motil Cytoskeleton, vol. 52, no. 4, pp. 221–30, 2002. [11] O. Debeir, I. Camby, R. Kiss, P. V. Ham, and C. Decaestecker, “A model-based approach for automated in vitro cell tracking and chemotaxis analyses,” Cytometry, vol. 60A, pp. 29–40, 2004. [12] P. M. Kasson, J. B. Huppa, M. Krogsgaard, M. M. Davis, and A. T. Brunger, “Quantitative imaging of lymphocyte membrane protein reorganization and signaling,” Biophys. J., vol. 88, pp. 579–589, January 2005. [13] M. Kass, A. Witkin, and D. Terzopoulos, “Snakes: Active Contour Models,” Int’l J. Computer Vision, vol. 1, pp. 321–331, 1988. [14] C. Wahlby, I. Sintorn, F. Erlandsson, and G. B. E. Bengtsson, “Combining intensity, edge and shape information for 2D and 3D segmentation of cell nuclei in tissue sections,” J. Microsc., vol. 215, pp. 67–76, Jul 2004. [15] T. McInerney and D. Terzopoulos, “Deformable models,” in Handbook of Medical Imaging, I. Bankman, Ed.
Academic Press, 2000, pp. 127–145.
[16] J. Sethian, Level Set Methods and Fast Marching Methods.
Cambridge University Press, New
York, 1999. [17] S. Inou´e and K. R. Spring, Video Microscopy: The Fundamentals, 2nd ed.
Plenum Press, 1997.
[18] K. Wu, D. Gauthier, and M. D. Levine, “Live Cell Image Segmentation,” IEEE Trans. Biomed.
January 30, 2006
DRAFT
18
Engineering, vol. 42, no. 1, pp. 1–12, Jan 1995. [19] K. Althoff, “Segmentation and Tracking Algorithms for In Vitro Cell Migration Analysis,” Ph.D. dissertation, Chalmers University of Technology, Gothenburg, Sweden, 2005. [20] D. Soll, E. Voss, O. Johnson, and D. Wessels, “Three-Dimensional Reconstruction and Motion Analysis of Living, Crawling Cells,” Scanning, vol. 22, pp. 249–267, Jul-Aug 2000. [21] O. Debeir, P. V. Ham, R. Kiss, and C. Decaestecker, “Tracking of migrating cells under phasecontrast video microscopy with combined mean-shift processes,” IEEE Trans. Med. Imag., vol. 24, no. 6, pp. 697–711, June 2005. [22] C. Ortiz De Solorzano, R. Malladi, S. A. Leli´evre, and S. J. Lockett, “Segmentation of Nuclei and Cells using Membrane Related Protein Markers,” J. Microsc., vol. 201, no. 3, pp. 404–415, March 2001. [23] D. Young, C. Glasbey, A. Gray, and N. Martin, “Towards automatic cell identification in DIC microscopy,” J. Microsc., vol. 192, pp. 186–193, 1998. [24] B. Zhang, J. Enninga, J.-C. Olivo-Marin, and C. Zimmer, “Automated Super-Resolution Detection of Fluorescent Rods in 2D,” in Proc. IEEE Int’l Symp. Biomed. Imag. (ISBI 2006), 2006, to appear. [25] D. J. Webb and A. F. Horwitz, “New dimensions in cell migration.” Nat Cell Biol., vol. 5, no. 8, pp. 690–2, Aug 2003. [26] C. Ortiz De Solorzano, E. G. Rodriguez, A. Jones, D. Pinkel, J. Gray, D. Sudar, and S. Lockett, “Segmentation of confocal microscope images of cell nuclei in thick tissue sections,” J. Microsc., vol. 193, pp. 212–226, 1999. [27] A. Sarti, C. Ortiz De Solorzano, S. Lockett, and R. Malladi, “A Geometric Model for 3-D Confocal Image Analysis,” IEEE Trans. Biomed. Eng., vol. 47, no. 12, pp. 1600–1609, December 2000. [28] P. J. Heid, E. Voss, and D. R. Soll, “3D-DIASemb: A Computer-Assisted System for Reconstructing and Motion Analyzing in 4D Every Cell and Nucleus in a Developing Embryo,” Developmental
January 30, 2006
DRAFT
19
Biology, vol. 245, pp. 329–347, 2002. [29] D. Mukherjee, N. Ray, and S. Acton, “Level Set Analysis for Leukocyte Detection and Tracking,” IEEE Trans. Image Processing, vol. 13, no. 4, pp. 562–572, April 2004. [30] D. R. Soll and D. Wessels, Eds., Motion Analysis of Living Cells.
Wiley-Liss, 1998.
F IGURE AND TABLE CAPTIONS Table 1: Selected cell tracking methods and some of their features. Abbreviations: BF: brightfield, DIC=differential interference contrast, PC=phase contrast, F=fluorescence. MI: manual initialization, MS: manual segmentations, FA: fully automated. Figure 1: Imaging mobile cells. (a) Pathogenic amoebae Entamoeba histolytica (courtesy E. Labruy´ere), imaged under a phase contrast microscope. (b) Fibroblasts imaged under a phase contrast microscope (courtesy C. Murphy). (c) Plasmodium falciparum sporozoites, expressing the green fluorescent protein (courtesy F. Frischknecht) . (d) Epithelial (MDCK) cells, with nuclei stained in red and cell membranes stained in green, observed with spinning disk confocal microscopy; the image is a maximum intensity projection of a stack of 40 image slices (courtesy V. Shinin). All examples show cells in vitro. Figure 2: Tracking dividing (top) and touching (bottom) nuclei (from [1]). Top row: The red surface is the segmented nucleus of a cell undergoing mitosis on frame 3. The two daughter cells are fully separated on frame 4. Bottom row: The three nuclei on the left of the image are isolated from each other, then move together and touch (frames 3 and 4), yet their identity is well preserved. Figure 3: Quantitative analysis of cell deformations. The frequency spectrum (right) of the apparent area of a crawling amoeba (stacked outlines, left), suggests the existence of a 4s periodicity.
January 30, 2006
DRAFT
9
20
Ref. [7] [20] [27] [9] [29] [12] [21] [10], [25] [1]
dimension 2D+t 3D+t 3D+t 2D+t 2D+t 2D+t 2D+t 2D+t 3D+t
method active contours
microscopy BF DIC DIC PC PC PC PC PC / F F
active contours image level sets active contours mean shift active contours active surfaces
Example application human fibroblast amoeba Dictyostelium C. elegans embryo leukocytes same endothelial cells cancer and endothelial cells amoebae E.histolytica same and epithelial cells
cell contacts no no yes yes yes no yes yes yes
automation MI FA MS MI FA MI MI MI FA
TABLE I
Table 1
a a Fig. 1.
Fig. 2.
b b
c c
d d
Figure 1
Figure 2
Figure 3 Fig. 3. January 30, 2006
DRAFT