APPLIED PHYSICS LETTERS 87, 172903 共2005兲
Observation of ferroelectricity in a confined crystallite using electron-backscattered diffraction and piezoresponse force microscopy P. Gupta, H. Jain,a兲 and D. B. Williams Department of Materials Science and Engineering and Center for Optical Technologies, Lehigh University, Bethlehem, Pennsylvania 18015
Sergei V. Kalinin,b兲 J. Shin, S. Jesse, and A. P. Baddorf Condensed Matter Sciences Division, Oak Ridge National Laboratory, Oak Ridge, Tennessee 17831
共Received 6 July 2005; accepted 6 September 2005; published online 21 October 2005兲 LaBGeO5 is a model transparent ferroelectric glass-ceramic 共TFGC兲 material, developed as an inexpensive alternative to single-crystal nonlinear optical materials. The optical activity of the TFGC originates from the ferroelectric phase which remains under a hydrostatic pressure exerted by the surrounding glass matrix. A combination of two techniques, electron-backscattered diffraction 共EBSD兲 and piezoresponse force microscopy 共PFM兲, is employed to monitor the development of the ferroelectric phase. A method is proposed to theoretically construct PFM amplitude maps from EBSD orientation maps. The theoretical vertical piezoresponse map is compared with the experimental piezoresponse map from PFM. A good correlation between the theoretical and experimental maps is observed. © 2005 American Institute of Physics. 关DOI: 10.1063/1.2120919兴 A new class of optical materials known as transparent ferroelectric glass-ceramics1 共TFGCs兲 is emerging, which could be easily formed into various shapes or drawn into fibers, and which exhibit nonlinear2 effects such as electro-optic,3 second-harmonic generation,4,5 etc. Typically, a TFGC system consists of an optically active, ferroelectric phase within an optically passive, transparent glass-matrix phase, e.g., LiNbO3 in SiO2 共Ref. 6兲 or TeO2 共Refs. 7 and 8兲 glasses. The usefulness of TFGC is affected by at least two following factors: 共1兲 If the ferroelectric transformation occurs below the glass transition temperature 共Tg兲, a hydrostatic pressure from the glass can suppress the transformation. For example, the ferroelectric transformation in PbTiO3 is suppressed when it is embedded in a glass of Tg ⬎ Tc.9,10 共2兲 The minimization of scattering from crystallites requires their size to be below the wavelength of light, where ferroelectric size effects may become important. LaBGeO5 共LBGO兲, a material with stillwellite structure 共space group P31兲, is one of the most promising and simple TFGC systems because it crystallizes homogeneously into a ferroelectric phase of the same composition11 as the parent glass. Moreover, bulk crystallization is relatively easier in LBGO as compared with other systems where only surface crystallization is observed.12 To understand the development of ferroelectricity in LBGO TFGC, this system has been studied using a combination of three-dimensional 共3D兲 piezoresponse force microscopy13 共PFM兲 and electronbackscattered diffraction 共EBSD兲. Using the interpretation of the vector PFM data,14 the orientation maps obtained from EBSD were converted into a 3D piezoresponse map 共d33 , d34 , d35兲 using published data on single-crystal LBGO.15 Despite the extreme complexity of the PFM response surfaces, the theoretical PFM images have shown good agreement with experiment, indicative of a good match between the properties of the constrained crystallite and bulk material. a兲
Electronic mail:
[email protected] Electronic mail:
[email protected]
b兲
LBGO glass-ceramic samples were prepared using a two-step heat treatment of the LBGO glass. The details of the sample preparation are described elsewhere 共Gupta et al.16兲. Partially crystallized samples were mechanically polished using CeO2 powder to remove the thin opaque crystalline surface layer and then etched for 1 min by concentrated hydrochloric acid to reveal surface crystallites for easy detection and characterization. A FEI XL-30 environmental scanning electron microscope 共ESEM兲 共20 kV accelerating voltage and 0.3 Torr water vapor chamber pressure兲 was used for EBSD measurements. The presence of the water vapor reduced the charging of the uncoated glass-ceramic sample, result in significantly improved images. The EBSD analysis was accomplished using a TexSEM Laboratories system, comprising of a phosphor screen and a Si-intensified target 共SIT兲 camera with associated image processing hardware and orientation imaging microscopy 共OIM兲 v.2.5 software. The grain-orientation maps of the specimen were created by measuring crystal orientations at an array of points. At each point, an EBSD pattern was captured and indexed, and the resulting orientation was stored along with the probe position and the figures of merit describing the quality of the pattern and the indexing procedure. These data were subsequently used to generate the orientation maps. The PFM data were acquired using a commercial scanning probe microscope 共SPM兲 system 共MultiMode NS-IIIA, Veeco Instruments兲 equipped with external lock-in amplifiers and a function generator 共SRS 830 and DS 345, Stanford Research Instruments兲. To avoid capacitive crosstalk, the tip was directly biased through a homebuilt tip holder. Goldcoated Si probes 共NSC-12, spring constants of 1 – 5 N / m, Micromasch兲 were used. For some measurements, to simultaneously acquire the vertical and lateral amplitudes and phase signals, the microscope was equipped with an external computer with LABVIEW software emulating additional signal acquisition channels. The mechanical response due to the converse piezoelectric effect in the vertical and lateral directions causes tip bending and torsion proportional to the am-
0003-6951/2005/87共17兲/172903/3/$22.50 87, 172903-1 © 2005 American Institute of Physics Downloaded 09 Nov 2005 to 128.180.2.41. Redistribution subject to AIP license or copyright, see http://apl.aip.org/apl/copyright.jsp
172903-2
Appl. Phys. Lett. 87, 172903 共2005兲
Gupta et al.
FIG. 2. 共a兲 The schematic of the crystal orientation shows the principal axes of this crystal 共x , y , z兲 relative to the principal axes of the sample 共x⬘ , y ⬘ , z⬘兲. The orientational dependence for the 共b兲 vertical PFM signal d33 and the 共c兲 dc and 共d兲 ds components of the lateral PFM signal. For simplicity, the surfaces are shown for 0 ⬍ ⬍ , corresponding to the half of the antisymmetric response surface. Black and gray correspond to negative and positive response signs.
piezoresponse requires the transformation of the piezoelectric coefficients defined for the crystal axes to piezoelectric coefficients with respect to the laboratory axes, i.e., d0ij → dij. In the general case, the relationship between the dij tensor in the laboratory coordinate system and the d0ij tensor in the crystal coordinate system is17 共1兲
0 dij = A−1 ij dijNij ,
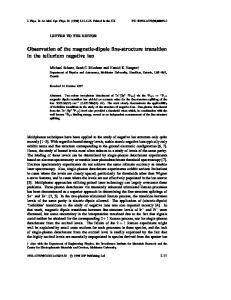
where Aij = Aij共 , , 兲 is the rotation matrix relating two coordinate systems and the elements of Nij = Nij共 , , 兲 are the functions of the elements of Aij.18 For the C3 point group of LBGO,19 the d0ij matrix has the following form: FIG. 1. 共a兲 Map showing the orientation of the different regions of a crystallite. Each orientation is identified by a number on the map, and is referenced in the inset inverse pole figure. 共b兲 Scanning electron micrograph of the same crystallite as in 共a兲.
plitude of the mechanical response of the sample. To acquire a 3D PFM data set containing information on all the three components of the electromechnical response vector, the sample was rotated by 90° and a matching set of x-LPFM and y-LPFM data was acquired. Shown in Fig. 1共a兲 is the EBSD orientation map from a 40 m crystallite in Fig. 1共b兲. The orientation of the crystallite in the form of Euler’s angles is represented as a gray scale map divided into several numbered regions. The indicated numbers signify the predominant orientation of the region located on the accompanying inverse pole figure. The data file from this map contains position coordinates 共x , y兲 and Euler’s angles used for the construction of the theoretical piezoresponse maps. For a uniform field, the vertical and lateral amplitude PFM images are interpreted as 共 PR , xPR , yPR兲 = 共d33 , d34 , d35兲 maps,14 respectively, where dij corresponds to the elements of the piezoelectric constant tensor in the laboratory coordinate system. Thus construction of the theoretical
冤
0 d11
0 d0ij = − d22 0 d31
0
0 d14
0 d22
0
0 0 0 d24 − d14 − 2d11 ,
0 d31
0 d33
0
0 d24
0
0 − 2d22
冥
0 − d11
0
共2兲
0 0 0 0 0 , d24 , d22 , d31 , d33 兲 共d11
and the corresponding elements are = 共1.7, −0.9, 0.6, −0.9, 1.3兲 pm/ V, as measured by Horiuchi 0 = 0 pm/ V.15 et al.15 From the Kleinman condition, d14 Due to the low symmetry of LBGO, all the three Euler angles determine the dij matrix and hence the PFM signal. However, it can be shown that for this symmetry the PFM signals are d33共, 兲 = d33共, 兲,
共3a兲
d34共, , 兲 = dc共, 兲cos + ds共, 兲sin ,
共3b兲
d35共, , 兲 = − dc共, 兲sin + dc共, 兲cos .
共3c兲
The response surfaces for d33, dc, and ds are shown in Figs. 2共b兲–2共d兲. Note that due to the fact that the absolute values of the elements of the d0ij matrix are comparable, the shape of the response surfaces is extremely complex. Therefore, for lateral response, a minor deviation in crystallographic orientation will result in a large change in the PFM signal, while the vertical PFM signal is relatively simpler.
Downloaded 09 Nov 2005 to 128.180.2.41. Redistribution subject to AIP license or copyright, see http://apl.aip.org/apl/copyright.jsp
172903-3
Appl. Phys. Lett. 87, 172903 共2005兲
Gupta et al.
The comparison between the experimental and calculated PFM images illustrates an excellent matching for the vertical PFM and a good matching for the lateral PFM, the discrepancy being due to the complex structure of the response surfaces for the latter. The correlation between the calculated and experimental maps indicates a good match between the properties of the constrained crystallite and bulk material. In the future, the 3D PFM can be extended for mapping local crystallographic orientations in polycrystalline piezoelectrics.
FIG. 3. Theoretical and experimental piezoresponse maps, respectively, in the vertical direction 共a兲 d33 and the two lateral directions 共b兲 d34 and 共c兲 d35.
This work was supported by the Pennsylvania Department of Community and Economic Development through the Ben Franklin Technology Development Authority at Lehigh University and partially supported by the Eugene P. Wigner fellowship of one of the author 共S.V.K.兲 at ORNL. H. Jain, Ferroelectrics 111, 306 共2004兲. Y. Takahashi, Y. Benino, T. Fujiwara, and T. Komatsu, Jpn. J. Appl. Phys., Part 2 41, L1455 共2002兲. 3 N. F. Borrelli, A. Herczog, and R. D. Maurer, Appl. Phys. Lett. 7, 117 共1965兲. 4 G. S. Murugan, T. Suzuki, Y. Ohishi, Y. Takahashi, Y. Benino, T. Fujiwara, and T. Komatsu, Appl. Phys. Lett. 85, 3405 共2004兲. 5 S. P. Nukavarapu, H. Jain, J. Toulouse, B. Esembeson, I. Biaggio, and J. Wang, Proc. SPIE 5597, 140 共2004兲. 6 H. C. Zeng, K. Tanaka, K. Hirao, and N. Soga, J. Non-Cryst. Solids 209, 112 共1997兲. 7 M. V. Shankar and K. B. R. Varma, J. Non-Cryst. Solids 243, 192 共1999兲. 8 T. Komatsu, H. G. Kim, and H. Mohri, J. Mater. Sci. Lett. 15, 2026 共1996兲. 9 D. G. Grossman and J. O. Isard, J. Mater. Sci. 4, 1059 共1969兲. 10 S. M. Lynch and J. E. Shelby, J. Am. Ceram. Soc. 67, 424 共1984兲. 11 V. N. Sigaev, S. Y. Stefanovich, P. D. Sarkisov, and E. V. Lopatina, Mater. Sci. Eng., B 32, 17 共1995兲. 12 G. S. Murugan, T. Suzuki, Y. Ohishi, Y. Takahashi, Y. Benino, T. Fujiwara, and T. Komatsu, Appl. Phys. Lett. 85, 3405 共2004兲. 13 A. Gruverman, O. Auciello, and H. Tokumoto, Annu. Rev. Mater. Sci. 28, 101 共1998兲. 14 S. V. Kalinin, B. J. Rodriguez, S. Jesse, J. Shin, A. P. Baddorf, P. Gupta, H. Jain, D. B. Williams, and A. Gruverman, Microsc. Microanal. 共in press兲. 15 N. Horiuchi, E. Osakabe, Y. Uesu, and B. A. Strukov, Ferroelectrics 169, 273 共1995兲. 16 P. Gupta, H. Jain, D. B. Williams, O. Kanert, and R. Kuechler, J. NonCryst. Solids 349, 291 共2004兲. 17 R. E. Newnham, Properties of Materials: Anisotropy, Symmetry, Structure 共Oxford University Press, New York, 2005兲. 18 A. J. Schwartz, M. Kumar, and B. L. Adams, Electron Backscattered Diffraction in Materials Science 共Kluwer/Plenum, New York, 2000兲. 19 W. G. Cady, Piezoelectricity 共Dover, New York, 1964兲. 1 2
The theoretical and experimental piezoresponse maps are shown in Fig. 3. Since EBSD does not distinguish antiparallel orientations, the absolute values of the PFM signal are compared. The experimental maps are divided into several regions with uniform crystallographic orientation and the PFM responses are compared based on the majority composition of pixels of a certain signal level. Figures 3共a兲 and 3共b兲 show a close match between the experimental and calculated vertical PFM images. In the case of the lateral responses, the matching between the experimental and calculated images is only partial. The d34 images in Figs. 3共c兲 and 3共d兲 match in areas 1 and 2 but differ in areas 3 and 4. The d35 images in Figs. 3共e兲 and 3共f兲 are divided into three regions. The areas 1 and 3 match while area 2 does not match. In these cases, we have found that for these regions the matching between the experimental and calculated images can be significantly improved if the d0ij matrix is inverted, corresponding to the 180° rotation of the crystallite. Therefore, PFM can be used to determine the local crystallographic orientation by solving Eq. 共1兲 for the Euler angles. However, due to the extreme complexity of response surfaces in Fig. 2, this method can be expected to provide better results for high-symmetry materials. To summarize, PFM demonstrates the presence of piezoelectricity in constrained LBGO crystallites. Combined with the x-ray-diffraction 共XRD兲 and nonlinear optical measurements, this confirms the presence of the ferroelectric phase.
Downloaded 09 Nov 2005 to 128.180.2.41. Redistribution subject to AIP license or copyright, see http://apl.aip.org/apl/copyright.jsp