NUS-WIDE: A Real-World Web Image Database from National University of Singapore Tat-Seng Chua, Jinhui Tang, Richang Hong, Haojie Li, Zhiping Luo, Yantao Zheng National University of Singapore Computing 1, 13 Computing Drive, 117417, Singapore
{chuats, tangjh, hongrc, lihj, luozhipi, yantaozheng}@comp.nus.edu.sg ABSTRACT This paper introduces a web image dataset created by NUS’s Lab for Media Search. The dataset includes: (1) 269,648 images and the associated tags from Flickr, with a total of 5,018 unique tags; (2) six types of low-level features extracted from these images, including 64-D color histogram, 144-D color correlogram, 73-D edge direction histogram, 128-D wavelet texture, 225-D block-wise color moments extracted over 5×5 fixed grid partitions, and 500-D bag of words based on SIFT descriptions; and (3) ground-truth for 81 concepts that can be used for evaluation. Based on this dataset, we highlight characteristics of Web image collections and identify four research issues on web image annotation and retrieval. We also provide the baseline results for web image annotation by learning from the tags using the traditional k -NN algorithm. The benchmark results indicate that it is possible to learn effective models from sufficiently large image dataset to facilitate general image retrieval.
Categories and Subject Descriptors H.2.8 [Database Applications]: Image databases; H.3.1 [Information Storage and Retrieval]: Content Analysis and Indexing.
General Terms Experimentation, Performance, Standardization.
Keywords Web Image, Flickr, Retrieval, Annotation, Tag Refinement, Training Set Construction.
1.
INTRODUCTION
Digital images have become more easily accessible following the rapid advances in digital photography, networking and storage technologies. Some photo sharing websites, such
Permission to make digital or hard copies of all or part of this work for personal or classroom use is granted without fee provided that copies are not made or distributed for profit or commercial advantage and that copies bear this notice and the full citation on the first page. To copy otherwise, to republish, to post on servers or to redistribute to lists, requires prior specific permission and/or a fee. CIVR ’09, July 8-10, 2009 Santorini, GR. Copyright 2009 ACM 978-1-60558-480-5/09/07 ...$5.00.
as Flickr1 and Picasa2 , are popular in daily life. For example, there are more than 2,000 images being uploaded to Flickr every minute. During peak times, up to 12,000 images are being served per second, and the record for the number of images uploaded per day exceeds 2 million images [3]. When users share their images, they typically give several tags to describe the contents of their images. Out of these archives, several questions naturally arise for multimedia research. For example, what can we do with millions of images and their associated tags? How can general image indexing and search benefit from the community shared images and tags? In fact, how to improve the performance of existing image annotation and retrieval approaches by using machine learning and other artificial intelligent technologies has attracted much attention in multimedia research community. However, for learning based methods to be effective, a large number of balanced labeled samples is required, which typically comes from users during an interactive manual process. This is very time-consuming and labor-intensive. In order to reduce this manual effort, many semi-supervised learning or active learning approaches have been proposed. Nevertheless, there is still a need to manually annotate many images to train the learning models. On the other hand, the image sharing sites offer us great opportunity to “freely” acquire a large number of images with annotated tags. The tags for the images are collectively annotated by a large group of heterogeneous users. It is believed that although most tags are correct, there are many noisy and missing tags. Thus if we can learn the accurate models from these user-shared images together with their associated noisy tags, then much manual effort in image annotation can be eliminated. In this case, content-based image annotation and retrieval can benefit much from the community contributed images and tags. In this paper, we present four research issues on mining the community contributed images and tags for image annotation and retrieval. The issues are: (1) How to utilize the community contributed images and tags to annotate nontagged images. (2) How to leverage the models learned from these images and associated tags to improve the retrieval of web images with tags or surrounding text. (3) How to ensure tag completion which means the removal of the noise in the tag set and the enrichment of missing tags. (4) How to construct effective training set for each concept and the overall concept network from the available information sources. To 1 2
http://www.flickr.com/ http://picasa.google.com/
Table 1: The set removal nature sky blue water clouds red green bravo landscape explore
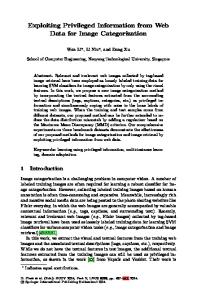
Figure 1: The frequency distribution of tags, the vertical axis indicates the tag frequency with doublelog scale.
of most frequent tags after noise 20142 18935 17822 17646 14201 13172 13169 12003 11667 11144
sunset light white people sea night art architecture yellow portrait
10962 10869 10082 9324 9016 8806 8759 8589 8191 8139
for only a small fraction of images for visual annotation and retrieval experiments. The rest of the paper is organized as follows. Section 2 introduces the crawled images and tags from Flickr and how we pre-process them, including the removal of duplicate images and useless tags. Section 3 describes the extraction of the low-level features for images. Section 4 introduces the definitions of the 81 concepts for evaluation and how we manually annotate the ground-truth. The levels of noise in different tags are analyzed in Section 5. In Section 6, we describe the definitions of four research challenges for web image annotation and retrieval, and present the benchmark results. Finally, Section 7 contains the conclusion and discussion for future work.
2. IMAGES AND TAGS
Figure 2: The number of tags per image these ends, we construct a benchmark dataset to focus research efforts on these issues. The dataset includes a set of images crawled from Flickr, together with their associated tags, as well as the ground-truth for 81 concepts for these images. We also extract six low-level visual features, including 64-D color histogram in LAB color space, 144-D color correlogram in HSV color space, 73-D edge distribution histogram, 128-D wavelet texture, 225-D block-wise LAB-based color moments extracted over 5×5 fixed grid partitions, and 500-D bag of visual words. For the image annotation task, we also provide a baseline using the k -NN algorithm. The set of low-level features for images, their associated tags, ground-truth, and the baseline results can be downloaded at http://lms.comp.nus.edu.sg/research/NUS-WIDE.htm. To our knowledge, this is the largest real-world web image dataset comprising over 269,000 images with over 5,000 user-provided tags, and ground-truth of 81 concepts for the entire dataset. The dataset is much larger than the popularly available Corel [2] and Caltech 101 [4] datasets. While some research efforts have been reported [20][19] on much large image dataset of over 3-million images, these works are largely text-based and the datasets contain ground-truth
We randomly crawled more than 300,000 images together with their tags from the image sharing site Flickr.com through its public API. The images whose sizes are too small or with inappropriate length-width ratios are removed. Also we remove many duplicate images according to feature matching. The remaining set contains 269,648 images with a total of 425,059 unique tags. Figure 1 illustrates the distribution of the frequencies of tags in the dataset; while Figure 2 shows the distribution of the number of tags per image. Among all the unique tags, there are 9,325 tags that appear more than 100 times. Many of these unique tags arise from spelling errors, while some of them are names etc., which are meaningless for general image annotation or indexing. We thus check all these 9,325 unique tags against the WordNet, and remove those tags that do not exist in the WordNet. At the end, we are left with a tag list of 5,018 unique tags, which can be found at http://lms.comp.nus.edu.sg/research/NUSWIDE.htm. Table 1 gives the top 20 most frequent tags together with their frequencies after noise removal. A key issue in image annotation and indexing is the correlations among the semantic concepts. The semantic concepts do not exist in isolation. Instead, they appear correlatively and interact naturally with each other at the semantic level. For example, the tag “sunset” often co-occurs with the tag “sea” while “airplane” and “animal” generally do not cooccur. Several research efforts have been done on how to exploit the semantic correlations to improve image and video annotation [12][17]. For our scenario, the semantic correlations can be easily obtained by computing the co-occurrence matrix among the tags. We found that the co-occurrence matrix is rather full, which indicates that there are closed correlations among the 5,081 unique tags in our dataset.
3.
LOW-LEVEL FEATURES
tion and dilation of a mother wavelet ψ(x), i.e.,
To facilitate experimentation and comparison of results, we extract a set of effective and popularly used global and local features for each image.
3.1 Global Features Four sets of global features are extracted as follows: A) 64-D color histogram (LAB) [14]: The color histogram serves as an effective representation of the color content of an image. It is defined as the distribution of the number of pixels for each quantized bin. We adopt the LAB color space to model the color image, where L is lightness and A, B are color opponents. As LAB is a linear color space, we therefore quantize each component of LAB color space uniformly into four bins. Then the color histogram is defined for each component as follows: ni N
h(i) =
i = 1, 2, . . . , K
(1)
where ni is the number of pixels with value i, N is the total number of pixels in the image, and K is the size of the quantized bins (with K=4). The resulting color histogram has a dimension of 64 (4×4×4). B) 144-D color auto-correlogram (HSV) [6]: The color auto-correlogram was proposed to characterize the color distributions and the spatial correlation of pairs of colors together. The first two dimensions of the three-dimensional histogram are the colors of any pixel pair and the third dimension is their spatial distance. Let I represent the entire set of image pixels and Ic(i) represent the subset of pixels with color c(i), then the color auto-correlogram is defined as: (k)
ri,j = P rp1 ∈Ic(i) ,p2 ∈I [p2 ∈ Ic(j) ||p1 − p2 | = d]
(2)
where i, j ∈ {1, 2, . . . , K}, d ∈ {1, 2, . . . , L} and |p1 − p2 | is the distance between pixels p1 and p2 . Color auto-correlogram only captures the spatial correlation between identical colors and thus reduces the dimension from O(N 2 d) to O(N d). We quantize the HSV color components into 36 bins and set the distance metric to four odd intervals of d = {1, 3, 5, 7}. Thus the color auto-correlogram has a dimension of 144 (36×4). C) 73-D edge direction histogram [11]: Edge direction histogram encodes the distribution of the directions of edges. It comprises a total of 73 bins, in which the first 72 bins are the count of edges with directions quantized at five degrees interval, and the last bin is the count of number of pixels that do not contribute to an edge. To compensate for different image sizes, we normalize the entries in histogram as follows:
( H(i)
Hi =
,
Me H(i) , M
if i ∈ [0, . . . , 71] i = 72
(3)
where H(i) is the count of bin i in the edge direction histogram; Me is the total number of edge points detected in the sub-block of an image; and M is the total number of pixels in the sub-block. We use Canny filter to detect edge points and Sobel operator to calculate the direction by the gradient of each edge point. D) 128-D wavelet texture [9]: The wavelet transform provides a multi-resolution approach for texture analysis. Essentially wavelet transform decomposes a signal with a family of basis functions ψmn (x) obtained through transla-
m
ψmn (x) = 2− 2 ψ(2−m x − n),
(4)
where m and n are the dilation and translation parameters. A signal f (x) can be represented as: f (x) =
X
cmn ψmn (x).
(5)
m,n
Wavelet transform performed on image involves recursive filtering and sub-sampling. At each level, the image is decomposed into four frequency sub-bands, LL, LH, HL, and HH, where L denotes the low frequency and H denotes the high frequency. Two major types of wavelet transform often used for texture analysis are the pyramid-structured wavelet transform (PWT) and the tree-structured wavelet transform (TWT). The PWT recursively decomposes the LL band. On the other hand, the TWT decomposes other bands such as LH, HL or HH for preserving the most important information appears in the middle frequency channels. After the decomposition, feature vectors can be constructed using the mean and standard deviation of the energy distribution of each sub-band at each level. For the three-level decomposition, PWT results in a feature vector of 24 (3×4×2) components. For TWT, the feature will depend on how the sub-bands at each level are decomposed. A fixed decomposition tree can be obtained by sequentially decomposing the LL, LH, and HL bands, thus resulting in a feature vector of 104(52×2) components.
3.2 Grid-based Features E) 225-D block-wise color moments (LAB) [16]: The first (mean), the second (variance) and the third order (skewness) color moments have been found to be efficient and effective in representing the color distributions of images. Mathematically, the first three moments are defined as: µi =
σi = (
si = (
1 N 1 N
1 N
N X
(6)
fij
j=1
N X
1
(fij − µi )2 ) 2
(7)
j=1 N X
1
(fij − µi )3 ) 3
(8)
j=1
where fij is the value of the i-th color component of the image pixel j, and N is the total number of pixels in the image. Color moments offer a very compact representation of image content as compared to other color features. For the use of three color moments as described above, only nine components (three color moments, each with three color components) will be used. Due to this compactness, it may not have good discrimination power. Thus for our dataset, we extract the block-wise color moments over 5×5 fixed grid partitions, giving rise to a block-wise color moments with a dimension of 225.
3.3 Bag of Visual Words F) 500-D bag of visual words [7]: The generation of bag of visual words comprises three major steps: (a) we
apply the Difference of Gaussian filter on the gray scale images to detect a set of key-points and scales respectively; (b) we compute the Scale Invariant Feature Transform (SIFT) [7] over the local region defined by the key-point and scale; and (c) we perform the vector quantization on SIFT region descriptors to construct the visual vocabulary by exploiting the k -means clustering. Here we generated 500 clusters, and thus the dimension of the bag of visual words is 500.
4.
GROUND-TRUTH FOR 81 CONCEPTS
the quality of the tag set collaboratively generated by the user community? Is the tag set of sufficient quality to automatically train the machine learning models for concept detection? Are there effective methods to “clean” the tag set by identifying the correct tags and removing those erroneous? To answer these questions, in this Section, we analyze the noise level of the dataset. We calculate the precision and recall of the tags according to the ground-truth of the manually annotated set of 81 concepts. The results are presented in Figure 5. We can see from the Figure that the average precision and average recall of the original tags are both about 0.5, that is to say, about half of the tags are noise and half of the true labels are missing. Here we simply define a noise level measure using the F1 score:
To evaluate the effectiveness of research efforts conducted on the dataset, we invited a group of students (called annotators) with different backgrounds to manually annotate the ground-truth for the 81 concepts, which are listed in Figure 3. The annotators come from several high schools and National University of Singapore. The 81 concepts are carefully chosen in such a way that: (a) they are consistent with those concepts defined in many other literatures [2][4][10][15]; (b) they mostly correspond to the frequent tags in Flickr; (c) they have both general concepts such as “animal” and specific concepts such as “dog” and “flowers”; and (d) they belong to different categories including scene, object, event, program, people and graphics. The guideline for the annotation is as follows: if the annotator sees a certain concept exist in the image, label it as positive; if the concept does not exist in the image, or if the annotator is uncertain on whether the image contains the concept, then label it as negative. Figure 4 shows the number of relevant images for the 81 concepts. As there are 269,648 images in the dataset, it is nearly impossible to manually annotate all images for the 81 concepts. We thus build a system to find the most possible relevant images of each concept to support manual annotation. The manual annotation is conducted one-by-one for all the concepts. Here we briefly introduce the procedures for annotating one concept. First, all the images that have already been tagged with the concept word are shown to the annotators for manual confirmation. After this step, we obtain the ground-truth for a small portion of the dataset for the target concept. Second, we use this portion of groundtruth as training data to perform k -NN induction on the remaining unlabeled images. The unlabeled images are ranked according to the scores obtained by k -NN. Third, we present the ranked list of images to the annotators for manual annotation until the annotators cannot find any relevant image in the consecutive 200 images. On average, the annotators manually view and annotate about a quarter of all images. However, for certain popular concepts such as “sky” and “animal”, the annotators may annotate almost the entire dataset. We believe that the ground-truth is reasonably complete as the rest of 43 ”unseen” images are very unlikely to contain the concept according to our selection criteria. We estimate that the overall effort for the semi-manual annotation of ground-truth for the 81 concepts is about 3,000 man-hours. To facilitate evaluation, we separate the dataset into two parts. The first part contains 161,789 images to be used for training and the second part contains 107,859 images to be used for testing.
2 × P recision × Recall . (10) P recision + Recall Figure 6 shows the noise levels of the original tags for the 81 concepts. To better quantify the effects of the number of positive samples and noise level for each concept, we conduct the annotation using the k -NN algorithm as the benchmark for the research issue described in Section 6.1. Since the sample size is too large, it will cost too much time to compute the k -NN. Here we adopt the approximate nearest neighbor searching method [1] to accelerate the procedure. The performances for the 81 concepts evaluated with average precision are illustrated in Figure 7. The sub-figures from top to bottom respectively correspond to the results of k -NN using the visual features of: color moments, color auto-correlogram, color histogram, edge direction histogram, wavelet texture, and the average fusion on the above five features. From the results, we can see that the annotation performance is affected by both the number of positive samples in the dataset and the noise level of the target concept. The number of positive samples offers positive influence to the results. Generally if the number of positive samples for a certain target concept is large, the corresponding average precision will be high too, such as the concepts “sky”, “water”, “grass” and “clouds”. While the noise level gives negative effects on the results. Thus even if the positive samples for the target concept is large, the performance can be degraded if the noise level of this concept is large, such as the concept “person”. Actually there is another factor affecting the result that is the degree of semantic gap of the target concept [8]. We can see that for “soccer”, the number of positive samples is small while the noise level is high, but the annotation performance is good. This is because the semantic gap of concept “soccer” is small. After the average fusion of results obtained from k -NN using five different visual features, the mean average precision (MAP) for the 81 concepts reaches 0.1569. According to the simulations in [5], this MAP is effective to help general image retrieval. Thus we can see that with a sufficiently large dataset, effective models can be learned from the user-contributed images and associated tags by using simple methods such as the k -NN.
5.
6. FOUR CHALLENGES
NOISE IN THE TAGS
We all expect the original tags associated with the images in the dataset to be noisy and incomplete. But how is
N L = 1 − F 1,
(9)
where F1 =
In this Section, we identify several challenging research issues on web image annotation, and retrieval. To facilitate
Figure 3: The concept taxonomy of NUS-WIDE
Figure 4: The number of relevant images for the 81 concepts
Figure 5: Precision and recall of the tags for the 81 concepts the evaluation of research efforts on these tasks, we divide the dataset into two parts. The first part contains 161,789 images to be used for training and the second part contains 107,859 images to be used for testing.
(2) The training samples in this set span the whole feature space covered by the original dataset [18].
6.1 Non-tagged Image Annotation
In some cases, NUS-WIDE is still too large for evaluation of visual analysis techniques for large-scale image annotation and retrieval. Thus we design and release three lite versions of NUS-WIDE. The lite versions respectively cover a general sub-set of the dataset, as well as focusing on object and scene oriented concepts. More details on these lite versions can be found at http://lms.comp.nus.edu.sg/research/NUSWIDE.htm.
This task is similar to the standard concept annotation problem except that the labels are the tags which are noisy and incomplete as discussed in Section 5. Effective supervised and semi-supervised learning algorithms need to be designed to boost the annotation performance. The key problem here is how to handle the noise in the tags. Thus incorporating user interaction with active learning [13] may be a good solution.
6.2 Web Image Retrieval The second problem is on how to retrieve the web images that have associated tags or surrounding texts. The main difference between this and the first problem is that the test images in this problem come with tags, so we can utilize the visual features and tags simultaneously to retrieve the test images, while the test images in the first problem only have visual features.
6.3 Tag Completion and Denoising The tags associated with the web images are incomplete and noisy, which will limit the usefulness of these data for training. If we can complete the tags for every image and remove the noise, the performance of the learning-based annotation will be greatly improved. Thus tag completion and denoising is very important for learning based web image indexing.
6.4 Training Set Construction from the Web Resource Actually in many cases we do not need to manually correct all the tags associated to the images in the whole dataset. Instead, we just need to construct an effective training set for each concept that we want to learn. It requires two properties for the training set of every target concept c. (1) The label of each image for concept c is reliable. This means that the label for other concepts may be incorrect or incomplete, whereas that for concept c is the most likely to be correct.
7. LITE VERSIONS OF NUS-WIDE
7.1 NUS-WIDE-LITE This lite version includes a subset of 55,615 images and their associated tags randomly selected from the full NUSWIDE dataset. It covers the full 81 concepts from NUSWIDE. We use half of the images (i.e. 27,807 images) for training and the rest (i.e. 27,808 images) for testing. Figure 8 illustrates the statistics of training and testing images.
7.2 NUS-WIDE-OBJECT This dataset is intended for several object-based tasks, such as object categorization, object based image retrieval, image annotations, etc. As a subset of NUS-WIDE, it consists of 31 object categories and 30,000 images in total. It has 17,927 images for training and 12,073 images for testing. Figure 9 shows the list of object concepts and statistics of training and testing image datasets respectively.
7.3 NUS-WIDE-SCENE Similarly, we provide another subset of NUS-WIDE covering 33 scene concepts with 34,926 images in total. We use half of the total number (i.e., 17,463 images) for training and the rest for testing. Figure 10 gives the list of scene concepts and the statistics of training and testing images.
8. CONCLUSION AND FUTURE WORK In this paper, we introduced a web image dataset associated with user tags. We extracted six types of low-level features for sharing and downloading. We also annotated the ground-truth of 81 concepts for evaluation. This dataset can
Figure 6: The noise levels of the tags for the 81 concepts be used for the evaluation of traditional image annotation and multi-label image classification, especially with the use of visual and text features. In addition, we identified four research tasks and provided the benchmark results using the traditional k -NN algorithm. To the best of our knowledge, this dataset is the largest web image set with ground-truth. However, there is still much work to be done. First, our current manual annotations on the 81 concepts though reasonably thorough, may still be incomplete. This means that some relevant images for the target concept may be missing. This, however, provides a good basis for research into the problems of tag de-noising and completion. Second, the concept set for evaluation may still be too small. However, it would be interesting to investigate what is the sufficient size of dataset to enable effective learning of concept classifiers using simple methods such as the k -NN. Third, for each image, different concepts may have different degrees of relevance. Thus the tags’ relevance degrees should be provided for the images. Fourth, the performances of the four defined tasks are still poor. This is good news as more research efforts should be paid to develop more effective methods.
9.
ACKNOWLEDGMENTS
The authors would like to thank following persons for their work or discussion on this dataset: Chong-Wah Ngo (CityU, Hongkong), Benoit Huet (Eurocom, France), Shuicheng Yan (NUS, Singapore), Xiangdong Zhou (Fudan Univ., China), Liyan Zhang (Tsinghua Univ., China), Guo-Jun Qi (USTC, China), Zheng-Jun Zha (USTC, China), Guangda Li (NUS, Singapore).
10. REFERENCES [1] S. Arya, D. M. Mount, N. S. N. R. Silverman, and A. Wu. An optimal algorithm for approximate nearest neighbor searching. Journal of ACM, 45:891–923, 1998. [2] K. Barnard, P. Duygulu, D. Forsyth, N. de Freitas, D. M. Blei, and M. I. Jordan. Matching words and pictures. Journal of Machine Learning Research, 3:1107 – 1135, 2003. [3] F. Blog. http://blog.flickr.net/en/2007/05/29/were-going-down/. [4] L. Fei-Fei, R. Fergus, and P. Perona. Learning generative visual models from few training examples: An incremental bayesian approach tested on 101 object categories. In CVPR Workshop on Generative-Model Based Vision, 2004.
[5] A. Hauptmann, R. Yan, W.-H. Lin, M. Christel, and H. Wactlar. Can high-level concepts fill the semantic gap in video retrieval? a case study with broadcast news. IEEE Transactions on Multimedia, 9(5):958–966, 2007. [6] J. Huang, S. Kumar, M. Mitra, W.-J. Zhu, and R. Zabih. Image indexing using color correlogram. In IEEE Conf. on Computer Vision and Pattern Recognition, pages 762–768, June 1997. [7] D. Lowe. Distinctive image features from scale-invariant keypoints. Int’l J. Computer Vision, 2(60):91–110, 2004. [8] Y. Lu, L. Zhang, Q. Tian, and W.-Y. Ma. What are the high-level concepts with small semantic gaps? In IEEE Conf. on Computer Vision and Pattern Recognition, 2008. [9] B. S. Manjunath and W.-Y. Ma. Texture features for browsing and retrieval of image data. IEEE Transactions on Pattern Analysis and Machine Intelligence, 18(8):837–842, August 1996. [10] M. Naphade, J. R. Smith, J. Tesic, S. Chang, W. Hsu, L. Kennedy, A. Hauptmann, and J. Curtis. A large-scale concept ontology for multimedia. IEEE MultiMedia, 13:86–91, July 2006. [11] D. K. Park, Y. S. Jeon, and C. S. Won. Efficient use of local edge histogram descriptor. In ACM Multimedia, 2000. [12] G.-J. Qi, X.-S. Hua, Y. Rui, J. Tang, T. Mei, and H.-J. Zhang. Correlative multi-label video annotation. In ACM Multimedia, 2007. [13] G.-J. Qi, X.-S. Hua, Y. Rui, J. Tang, and H.-J. Zhang. Two-dimensional multi-label active learning with an efficient online adaptation model for image classification. IEEE Transactions on Pattern Analysis and Machine Intelligence, to appear. [14] L. G. Shapiro and G. C. Stockman. Computer Vision. Prentice Hall, 2003. [15] C. G. M. Snoek, M. Worring, J. C. van Gemert, J.-M. Geusebroek, and A. W. M. Smeulders. The challenge problem for automated detection of 101 semantic concepts in multimedia. In ACM Multimedia, Oct. 2006. [16] M. Stricker and M. Orengo. Similarity of color images. In SPIE Storage and Retrieval for Image and Video Databases III, Feb. 1995. [17] J. Tang, X.-S. Hua, M. Wang, Z. Gu, G.-J. Qi, and X. Wu. Correlative linear neighborhood propagation for video annotation. IEEE Transactions on Systems, Man, and Cybernetics–Part B: Cybernetics, 39(2), April 2009. [18] J. Tang, Y. Song, X.-S. Hua, T. Mei, and X. Wu. To construct optimal training set for video annotation. In ACM Multimedia, Oct. 2006. [19] A. Torralba, R. Fergus, and W. Freeman. 80 million tiny images: A large data set for nonparametric object and scene recognition. IEEE Transactions on Pattern Analysis and Machine Intelligence, 30(11):1958–1970, November 2008. [20] X.-J. Wang, L. Zhang, X. Li, and W.-Y. Ma. Annotating images by mining image search results. IEEE Transactions on Pattern Analysis and Machine Intelligence, 30(11):1919–1932, November 2008.
Figure 7: The annotation results of k -NN using the tags with different combination of visual features for training.
Figure 8: The statistics of training and testing images for NUS-WIDE-LITE
Figure 9: The statistics of training and testing images for NUS-WIDE-OBJECT
Figure 10: The statistics of training and testing images for NUS-WIDE-SCENE