PACIFIC REGIONAL OCEANIC AND COASTAL FISHERIES DEVELOPMENT PROGRAMME (PROCFish/C / CoFish)
NAURU COUNTRY REPORT: PROFILE AND RESULTS FROM IN-COUNTRY SURVEY WORK
(October and November 2005)
by Aliti Vunisea, Silvia Pinca, Kim Friedman, Lindsay Chapman, Franck Magron, Samasoni Sauni, Kalo Pakoa, Ribanataake Awira and Ferral Lasi
This document has been produced with the financial assistance of the European Community
The views expressed herein are those of the Secretariat of the Pacific Community and do not reflect the official opinion of the European Community
© Copyright Secretariat of the Pacific Community 2008 All rights for commercial / for profit reproduction or translation, in any form, reserved. SPC authorises the partial reproduction or translation of this material for scientific, educational or research purposes, provided SPC and the source document are properly acknowledged. Permission to reproduce the document and/or translate in whole, in any form, whether for commercial / for profit or non-profit purposes, must be requested in writing. Original SPC artwork may not be altered or separately published without permission.
Original text: English
Secretariat of the Pacific Community Cataloguing-in-publication data Pacific Regional Coastal Fisheries Development Programme (CoFish) – Nauru country report: profile and results from in-country survey work (October and November 2005) / by Aliti Vunisea, Silvia Pinca, Kim Friedman, Lindsay Chapman, Franck Magron, Samasoni Sauni, Kalo Pakoa, Ribanataake Awira and Ferral Lasi. (Pacific Regional Oceanic and Coastal Fisheries (PROCFish/C/CoFish) / Secretariat of the Pacific Community) ISSN
Development
Programme
I. Vunisea, Aliti. II. Pinca, Silvia. III. Friedman, Kim. IV. Chapman, Lindsay. V. Magron, Franck. VI. Sauni, Samasoni. VII. Pakoa, Kalo. VIII. Awira, Ribanataake. IX. Lasi, Ferral. X. Title. XI. Secretariat of the Pacific Community, ReeFisheries Observatory. XII. Series. 1. Marine resources – Nauru – Statistics. 2. Fisheries – Nauru – Statistics. 3. Fisheries – Economic aspects – Nauru. 338.372 096 85
AACR2
ISBN 978-982-00-0261-6
Secretariat of the Pacific Community Coastal Fisheries Programme BP D5, 98848 Noumea Cedex, New Caledonia Tel: +687 26 00 00 Fax: +687 26 38 18 Email:
[email protected] http://www.spc.int/
Prepared for publication and printed at Secretariat of the Pacific Community headquarters Noumea, New Caledonia, 2008
ii
ACKNOWLEDGEMENTS The Secretariat of the Pacific Community (SPC) acknowledges with gratitude the funding support provided by the European Commission for the implementation of the Pacific Regional Coastal Fisheries Development Programme (CoFish).1 SPC also acknowledges the collaborative support of the staff of the Nauru Fisheries and Marine Resources Authority (NFMRA) for their in-country assistance, in particular the Chairman of the NFMRA Board, the Hon. Marcus Stephen; Ms Margo Deiye, NFMRA Coastal Fisheries Manager and attachment to the CoFish programme in Nauru; Ms Ebelina Tsiode, Community Officer; Ms Bianca Bernicke, Assistant Community Officer; Ms Lara Atto, Fisheries Officer; Mr Karlick Agir, Fisheries Officer; and NFMRA Extension Officers Mr Delvin Thoma, Mr Jake Debao, Mr Giovanni Gioura and Mr Elko-joe Agir. Other NFMRA staff who assisted the CoFish fieldwork were dive gear operators Mr Ricky Star and Mr Lucky Buramen, and boat operators Mr Camalus Reiyeti, Mr Oswin Agigo, Mr Joel Joram, Mr Gary Degia, Mr O’Brien Aboubo and Mr B’jorn Detageouwa; their assistance is acknowledged with thanks. Finally, NFMRA contracted two translators, Mr Tuisama Lauti (Tuvaluan) and Ms Bernice Jose (I-Kiribati), for conducting interviews with migrant workers. Other SPC staff who assisted with the production of this report were Ms Céline Barré, report compiling, formatting and layout; Ms Katie Purvis and Ms Sarah Langi, report editing, Youngmi Choi for the cover design, and the SPC Translation Section, who translated the executive summary; their assistance is acknowledged with thanks. In addition, thanks are provided to Dr Serge Andrefouet and his team for the provision and analysis of the satellite images used in this report for the calculation of reef-habitat surfaces. More information on this project is provided in Appendix 5. PROCFish/C and CoFish staff work (or used to work) for the Secretariat of the Pacific Community, BP D5, 98848 Noumea Cedex, New Caledonia under this EU-funded project. All PROCFish/C and CoFish staff work as a team, so even those not directly involved in fieldwork usually assist in data analysis, report writing, or reviewing drafts of site and country reports. The team is made up of: - Lindsay Chapman, Coastal Fisheries Programme Manager - Kim Friedman, Senior Reef Fisheries Scientist (invertebrates) - Mecki Kronen, Community Fisheries Scientist - Franck Magron, Reef Fisheries Information Manager - Aliti Vunisea, Community Fisheries Scientist - Silvia Pinca, Senior Reef Fisheries Scientist (finfish) - Kalo Pakoa, Reef Fisheries Officer (invertebrates) - Ribanataake Awira, Reef Fisheries Officer (finfish) - Ferral Lasi, Reef Fisheries Officer (invertebrates) - Pierre Boblin, Reef Fisheries Officer (finfish) - Emmanuel Tardy, Reef Fisheries Officer (invertebrates) - Marie-Therese Bui, Project Administrator - Samasoni Sauni, past Senior Reef Fisheries Scientist (finfish) - Laurent Vigliola, past Senior Reef Fisheries Scientist (finfish).
1
CoFish and PROCFish/C are part of the same programme, with CoFish covering the countries of Niue, Nauru, Federated States of Micronesia, Palau, Marshall Islands and Cook Islands (ACP countries covered under EDF 9 funding) and PROCFish/C countries covered under EDF 8 funding (the ACP countries: Fiji, Tonga, Papua New Guinea, Solomon Islands, Vanuatu, Samoa, Tuvalu and Kiribati, and French overseas countries and territories (OCTs): New Caledonia, French Polynesia, and Wallis and Futuna). Therefore, CoFish and PROCFish/C are used synonymously in all country reports.
iii
TABLE OF CONTENTS EXECUTIVE SUMMARY ................................................................................................................................VI RÉSUMÉ .............................................................................................................................................................. X ACRONYMS AND ABBREVIATIONS........................................................................................................XIV 1.
INTRODUCTION AND BACKGROUND ............................................................................................... 1 1.1 The PROCFish and CoFish programmes............................................................................................. 1 1.2 PROCFish/C and CoFish methodologies ............................................................................................ 2 1.2.1 Socioeconomic assessment 2 1.2.2 Finfish resource assessment 3 1.2.3 Invertebrate resource assessment 5 1.3 Nauru ................................................................................................................................................... 6 1.3.1 General 6 1.3.2 The fisheries sector 8 1.3.3 Fisheries management 11 1.4 Selection of sites in Nauru................................................................................................................. 12
2.
PROFILE AND RESULTS ...................................................................................................................... 13 2.1 Site characteristics ............................................................................................................................. 13 2.2 Socioeconomic surveys ..................................................................................................................... 14 2.2.1 The role of fisheries in the community: fishery demographics, income and seafood consumption patterns 14 2.2.2 Fishing strategies and gear 17 2.2.3 Catch composition and volume – finfish 21 2.2.4 Catch composition and volume – invertebrates 26 2.2.5 Discussion and conclusions 29 2.3 Finfish resource surveys .................................................................................................................... 30 2.3.1 Finfish assessment results 30 2.3.2 Discussion and conclusions 34 2.4 Invertebrate resource surveys ............................................................................................................ 36 2.4.1 Giant clams 38 2.4.2 Mother-of-pearl species (MOP): trochus and pearl oysters 39 2.4.3 Infaunal species and groups 40 2.4.4 Other gastropods and bivalves 40 2.4.5 Lobsters 40 2.4.6 Sea cucumbers 41 2.4.7 Other echinoderms 44 2.4.8 Discussion and conclusions 44 2.5 Overall recommendations for Nauru ................................................................................................. 45
3.
REFERENCES.......................................................................................................................................... 49
iv
APPENDICES APPENDIX 1: SURVEY METHODS............................................................................................................... 53 1.1 Socioeconomic surveys, questionnaires and average invertebrate wet weights ................................ 53 1.1.1 Socioeconomic survey methods 53 1.1.2 Socioeconomic survey questionnaires 74 1.1.3 Average wet weight applied for selected invertebrate species groups 94 1.2 Methods used to assess the status of finfish resources ...................................................................... 97 1.3 Invertebrate resource survey methods ............................................................................................. 105 1.3.1 Methods used to assess the status of invertebrate resources 105 1.3.2 General fauna invertebrate recording sheet with instructions to users 113 1.3.3 Habitat section of invertebrate recording sheet with instructions to users 114 APPENDIX 2: SOCIOECONOMIC SURVEY DATA ................................................................................. 119 2.1 Total annual weight (kg) of fish groups per habitat (includes only reported catch data by interviewed finfish fishers) - Nauru................................................................................................................................... 119 2.2 Annual finfish catch composition: percentage of total weight for each habitat - Nauru.................. 121 2.3 Invertebrate species caught by fishery with the percentage of annual wet weight caught - Nauru.. 124 2.4 Average length–frequency distribution for invertebrates, with percentage of annual total catch weight -Nauru ................................................................................................................................................ 125 2.5 Total annual catch of invertebrates (wet weight, kg/year) by species and category of use - Nauru 128 APPENDIX 3: FINFISH SURVEY DATA..................................................................................................... 129 3.1 Coordinates (WGS 84) of the 50 D-UVC transects used to assess finfish resource status in Nauru129 3.2 Weighted average density and biomass of all finfish species recorded in Nauru using distancesampling underwater visual censuses (D-UVC) ............................................................................................ 130 APPENDIX 4: INVERTEBRATE SURVEY DATA..................................................................................... 133 4.1 Invertebrate species recorded in different assessments in Nauru..................................................... 133 4.2 Nauru broad-scale assessment data review...................................................................................... 135 4.3 Nauru reef-benthos transect (RBt) assessment data review............................................................. 135 4.4 Nauru reef-front search (RFs) assessment data review.................................................................... 136 4.5 Nauru reef-front search by walking (RFs_w) assessment data review ............................................ 137 4.6 Nauru mother-of-pearl search (MOPs) assessment data review ...................................................... 138 4.7 Nauru sea cucumber day search (Ds) assessment data review ........................................................ 139 4.8 Nauru species size review – all survey methods.............................................................................. 140 APPENDIX 5: MILLENNIUM CORAL REEF MAPPING PROJECT, NAURU .................................... 141
v
EXECUTIVE SUMMARY The Pacific Regional Coastal Fisheries Development Programme (CoFish) conducted fieldwork around Nauru in October and November 2005. Nauru is one of 17 Pacific Island countries and territories being surveyed over a 5–6 year period by CoFish or its associated programme PROCFish (Pacific Regional Oceanic and Coastal Fisheries Development Programme). The aim of the survey work was to provide baseline information on the status of reef fisheries, and to help fill the massive information gap that hinders the effective management of reef fisheries. Other programme outputs include: • implementation of the first comprehensive multi-country comparative assessment of reef fisheries (finfish, invertebrates and socioeconomics) ever undertaken in the Pacific Islands region using identical methodologies at each site; • dissemination of country reports that comprise a set of ‘reef fisheries profiles’ for the sites in each country in order to provide information for coastal fisheries development and management planning; • development of a set of indicators (or fishery status reference points) to provide guidance when developing local and national reef fishery management plans and monitoring programmes; and • development of data and information management systems, including regional and national databases. Nauru is a single, raised coralline island located 41 km south of the equator. Most of the population lives around a 300 m wide coastal green fringe. Its coastal resources are restricted to a narrow 50–300 m wide coral ‘belt’ surrounding the 19 km circumference of the island. The water pools on the inner reef flat are very shallow and narrow, and most of the area dries up at low tide. Encircling the island, the fringing reef is characterised by a few coral heads (predominantly Acropora and Porites genera) growing on mineral rock that lies along the northern (ocean) side of the island. Given the small size of Nauru, it was treated as a single site, with large areas surveyed and a country profile developed. The survey covered three disciplines: finfish, invertebrate and socioeconomic, with the work undertaken by a team of five programme scientists and several local attachments from the fisheries department. The team also helped to build local capacity by training local counterparts in survey methodologies, data collection, and data entry. Socioeconomic field work was carried out in 11 of the 14 districts in Nauru, with the total resident population at the time estimated at 10,131 (1230 households). A total of 245 households were surveyed for income and expenditure, with 97% of these found to be engaged in fishing activities. In addition, a total of 405 finfishers (357 men and 48 women) and 283 invertebrate fishers (149 women and 134 men) were interviewed. Survey results indicate an average of 3.7 fishers per household; when this is extrapolated, the total number of fishers in Nauru is 4513, which includes 2947 men and 1566 women. The main source of income is from government employment (86%), with some people employed in the private sector. Fisheries do not play a significant role in income for households (For 5% it is their first income and for 17% their second income.). Annual per capita consumption of fresh fish is 46.5 kg and of canned fish is ~16kg, with fresh and canned fish consumed 3.8 and 2.4 vi
times per week respectively. The per capita consumption of invertebrates is much lower at 1.6 kg, and they are only consumed on average once in a fortnight. The overall catch of finfish is estimated at ~420 t annually; most is caught for subsistence (65%), some is distributed on a non-monetary basis (17%) and some is sold locally (17%). There is no export of fish. For invertebrates, the annual catch is estimated at 231 t with a reported annual catch of 23.3 t. All catch, with the exception of some lobster catch, is used for home consumption. Men are mainly engaged in finfishing, while women are the main invertebrate fishers. A total of 18 families, 49 genera, 129 species and 45,043 fish were recorded in the 50 transects surveyed for finfish. The assessment includes fish information that represents 42 genera, 120 species and 44,748 individuals. Of this, a mean of eight fish families, 18 fish genera, 32 fish species and 900 ±34 individual fish were observed and recorded in each transect. Nauru’s outer-reef system is characterised primarily by abiotic hard bottom (77% cover, primarily limestone slab) with trenches that cut through the pavement, which steeply drops off immediately after the surge zone. Acanthuridae and Balistidae families were predominant in density, with fish genera Acanthurus, Ctenochaetus, Naso, Zebrasoma, Melichthys, Balistapus and Sufflamen. Other large-sized families, such as Lethrinidae, Lutjanidae, Serranidae and Scaridae, were recorded in very low numbers, which indicates intense fishing pressure and targeting of these families. Invertebrate surveys were conducted through broad-scale assessments (manta-tow technique) and finer-scale assessments of specific reef and benthic habitats. Giant clams were not recorded, and it appears these were lost from Nauru as early as the 1980s. There were also no records of trochus or blacklip pearl oysters, although there was suitable habitat for trochus and it could be introduced. There is a small lobster fishery, mainly for the restaurant trade, but anecdotal information indicates that this stock is in decline. Six commercial species of sea cucumber were recorded, mainly at low densities. One species, surf redfish (Actinopyga mauritiana), was relatively common (recorded in 92% of broad-scale manta transects and 100% of reef-front searches). There is some potential for a small fishery based on this species; however, some locals are starting to eat it as other marine species become harder to find. The people of Nauru are going through difficult times with the current economic crisis, low wages and purchasing power for those with jobs, high fuel costs when fuel is available, and the need to put food on the table for themselves and their families. The increased focus on harvesting marine resources to address the food security issue has the potential to devastate inshore resources unless appropriate measures are put in place to ensure sustainable harvesting. The following recommendations are based on the CoFish survey work (socioeconomic, finfish and invertebrate) conducted in Nauru in October and November 2005, and anecdotal and published information that has been researched over the last 12 months. They are provided to assist the Government of Nauru and its people to look to the future and the sustainable harvesting of marine resources. It is recommended that: •
the Government closely monitors the level of fishing effort for both finfish and invertebrates (through in-water assessment and socioeconomic surveys) and implements
vii
management measures affecting catch (e.g. size limits, total allowable catches of heavily exploited species) and fishing practices (e.g. gear types, mesh sizes); •
specific management systems be considered essential to enable invertebrate stocks and heavily fished finfish stocks to build up, with the management regimes being controlled by communities at scales larger than the current village boundaries;
•
the Government considers establishing one or two marine protected areas (MPAs) that cover appropriate habitat (Reef ecology studies will need to be carried out to choose the best location for these MPAs. Also, there need to still be areas outside the MPAs where enough resources are available to enable people to fish for their family needs.);
•
if the Government starts to implement management arrangements, preferably through communities, an awareness programme is implemented at the same time to allow people and communities to fully understand why the management measures are necessary and the need for community support if arrangements are to work successfully;
•
the Government looks to restrain SCUBA spearfishing, as the efficiency of this gear outweighs all the more traditional means of fishing, and if it is not properly controlled it will have a drastic effect on targeted fish stocks;
•
the abundant herbivorous Acanthuridae family (surgeonfish) is sustainably targeted by local fishing activities instead of parrotfish, groupers, snappers and emperors, which are probably being impacted by fishing activities at present;
•
the Government continues to foster development of offshore resources, more specifically tuna and other pelagics, to reduce fishing pressure on inshore resources;
•
the Government looks at ways to assist local fishers to fish for pelagics, e.g: ○ encourage Nauruans to use motorised boats by improving access to fuel, and ○ put out shallow-water fish aggregating devices (FADs) that can be reached by fishers paddling non-motorised canoes, thus continuing the fishing practices of the I-Kiribati and Tuvaluan fishers who have departed from Nauru;
•
the Government considers strengthening development of the aquaculture sector (such as freshwater farming of milkfish) and looks at the possibility of mariculture of certain species, to expand options currently available from reef resources;
•
the Government has an assessment undertaken to look at the stocks of aquarium fish, with the harvesting of these encouraged through the private sector, and appropriate management measures put in place if the stocks can be sustainably harvested and viably exported;
•
any additional survey work by SPC on invertebrates focuses on the species that are of most concern for Nauruan people and that are the main focus of current harvest activity, including an assessment of the status and population dynamics of Turbo spp. and nocturnal crustacean species (especially lobsters and crabs); and
viii
•
the Government considers the introduction of Tridacna maxima, and possibly trochus adults, within an area protected from fishing and gleaning, possibly as part of an MPA as recommended above.
ix
RÉSUMÉ L’équipe du Projet de développement de la pêche côtière (CoFish) s’est rendue à Nauru en octobre et en novembre 2005 pour y mener des études et des enquêtes de terrain. Nauru est l’un des 17 États et Territoires insulaires du Pacifique visés, sur une période de 5-6 ans, par le projet CoFish ou le projet associé PROCFish (Projet régional de développement des pêches océaniques et côtières dans les PTOM français et pays ACP du Pacifique). Le but de l’étude consiste à obtenir des données de référence sur l’état des ressources récifales et à combler l'énorme manque d'informations qui entrave la gestion efficace des ressources récifales. Les autres résultats attendus du projet sont les suivants : • première évaluation exhaustive et comparative des pêcheries récifales (poissons, invertébrés et paramètres socioéconomiques de leur exploitation) de plusieurs pays de la région océanienne, suivant une méthode normalisée, appliquée sur chaque site d'étude ; • diffusion de rapports nationaux comprenant un ensemble de « descriptifs des ressources halieutiques récifales » pour les sites étudiés dans chaque pays, servant de base au développement de la pêche côtière et à la planification de sa gestion ; • élaboration d’un jeu d’indicateurs (ou points de référence pour l'évaluation de l'état des stocks), qui serviront de guide à l'élaboration de plans de gestion des ressources récifales à l'échelle locale et nationale, et de programmes de suivi ; et • élaboration de systèmes de gestion des données et de l’information, dont des bases de données régionales et nationales. Nauru est composé d’une seule île corallienne soulevée, située à 41 km au sud de l’équateur. La plupart de ses habitants résident autour d’une bande littorale verdoyante de 300 mètres de large. Les ressources côtières sont enserrées dans une étroite ceinture corallienne de 50 à 300 mètres de large bordant les 19 kilomètres de circonférence de l’île. Les flaques d’eau situées sur le platier récifal interne sont très étroites et superficielles et, pour la plupart, s’assèchent à marée basse. Ceinturant l’île, le récif frangeant se caractérise par quelques patates de corail (surtout des genres Acropora et Porites) proliférant sur des roches minérales au large de la côté septentrionale de l’île (tournée vers l’océan). Vu la faible superficie de Nauru, le pays entier a été défini comme site d’étude. De vastes étendues ont été inventoriées et un profil du pays a été établi. L’étude de Nauru s’articulait autour de trois volets (l’inventaire des poissons, l’inventaire des invertébrés et l’étude des facteurs socioéconomiques) mis en œuvre par une équipe de cinq scientifiques du Projet et plusieurs agents du Service des pêches affectés au projet. L’équipe du projet s’est également occupée du renforcement des capacités locales, en formant des homologues locaux aux méthodes d’enquête ainsi qu’à la collecte et à la saisie de données. Les enquêtes socioéconomiques de terrain ont visé onze des quatorze districts de Nauru, le nombre total de résidents à l’époque étant estimé à 10 131 personnes (1 230 ménages). Au total, 97 pour cent des 245 ménages interrogés sur leurs revenus et leurs dépenses ont déclaré pratiquer la pêche. Parallèlement, un total de 405 pêcheurs de poisson (357 hommes et 48 femmes) et de 283 pêcheurs d’invertébrés (149 femmes et 134 hommes) ont été sondés. D’après les résultats des enquêtes, on compte en moyenne 3,7 pêcheurs par ménage, ce qui nous donne par extrapolation 4 513 pêcheurs au total à Nauru, dont 2 947 hommes et 1 566 femmes. La fonction publique est la première source de revenus des ménages (86 %), à x
laquelle s’ajoutent quelques emplois dans le secteur privé. La pêche ne tient pas une place importante dans les revenus des ménages (première source de revenus pour seulement 5 %, et deuxième source de revenus pour 17 % d’entre eux). Le volume annuel de poisson consommé par habitant s’élève à 46,5 kg, contre environ 16 kg pour le poisson en conserve. Le poisson frais et le poisson en conserve sont consommés respectivement 3,8 et 2,4 fois par semaine. Les invertébrés ne sont consommés en moyenne qu’une fois tous les quinze jours, pour un maigre total annuel de 1,6 kg par habitant. Le volume total de poissons pêchés est estimé à quelque 420 tonnes par an, pour la plupart capturés à des fins de subsistance (65 %), le reste étant troqué ou donné (17 %) ou encore vendu à des acheteurs locaux (17 %). Les poissons ne sont pas exportés. Le volume total de captures d’invertébrés est, quant à lui, estimé à 231 tonnes, à partir de captures annuelles de 23,3 tonnes recensées dans les enquêtes. À l’exception d’une partie des prises de langouste, toutes les captures sont consommées par les ménages. Les hommes ciblent principalement le poisson, tandis que les femmes sont majoritaires dans la pêche d’invertébrés. Au total, 18 familles, 49 genres, 129 espèces et 45 043 poissons ont été recensés le long des 50 transects d’observation des poissons. L’inventaire a permis de recueillir des informations sur 42 genres, 120 espèces et 44 748 individus. La moyenne de poissons observés et comptés par transect est la suivante : 8 familles, 18 genres, 32 espèces et 900 ± 34 individus. Le système de récif externe de Nauru se caractérise principalement par des fonds durs abiotiques (couvert de 77 %, composé surtout de dalle calcaire) et des fossés taillés dans le pavage, qui forme un tombant abrupt juste après la zone de déferlement des vagues. Les familles Acanthuridae et Balistidae affichaient les densités les plus élevées, les genres observés étant Acanthurus, Ctenochaetus, Naso, Zebrasoma, Melichthys, Balistapus et Sufflamen. D’autres familles de grande taille, telles que les Lethrinidae, les Lutjanidae, les Serranidae et les Scaridae, étaient présents en très petits nombres, ce qui traduit une pression de pêche intense et une exploitation ciblée sur ces familles. Les invertébrés ont été inventoriés au moyen de recensements à grande échelle (technique « manta tow ») et d’évaluations ciblées à échelle réduite d’habitats récifaux et benthiques sélectionnés. Aucun bénitier n’a été observé, mais il semblerait que cette espèce ait disparu des côtes du pays déjà dans les années 80. De même, l’équipe n’a recensé ni trocas ni huîtres à lèvres noires, malgré la présence d’habitats adaptés aux trocas et la possibilité de réintroduire l’animal. La pêche commerciale de la langouste est quelque peu pratiquée, surtout pour alimenter les restaurants, mais des données empiriques donnent à penser que le stock est déclin. Six espèces commercialisées d’holothuries ont été recensées, essentiellement à de faibles densités. Une espèce, l’holothurie de brisants (Actinopyga mauritiana), était assez commune (observée sur 92 % des transects de recensement à grande échelle et dans 100 % des recherches sous-marines sur le front récifal). Une petite filière axée sur l’holothurie de brisants pourrait être développée. Toutefois, certains pêcheurs locaux commencent à consommer sa chair, car il devient de plus en plus difficile de trouver d’autres espèces marines. Les habitants de Nauru traversent une période difficile caractérisée par la crise économique, des salaires et un pouvoir d’achat en berne pour ceux qui ont trouvé un emploi, le coût élevé du carburant, quand carburant il y a, et la nécessité de nourrir toute la famille. La pression de plus en plus forte exercée sur les ressources marines pour satisfaire les besoins alimentaires de base de la population pourrait bien avoir des effets dévastateurs sur les ressources littorales, à moins que des mesures adéquates ne soient mises en place pour garantir une pêche durable.
xi
Les recommandations présentées ci-dessous reposent sur le travail de terrain réalisé dans le cadre du projet CoFish (paramètres socioéconomiques, poissons et invertébrés) à Nauru en octobre et en novembre 2005, ainsi que sur des informations empiriques et tirées de la littérature scientifique ces douze derniers mois. Ces recommandations visent à aider les pouvoirs publics et la population de Nauru à prendre en mains leur avenir en assurant l’exploitation durable des ressources marines. Il est recommandé que : •
les autorités de Nauru surveillent de près l’effort de pêche axé sur les poissons et les invertébrés (au moyen d’évaluations sous-marines et d’enquêtes socioéconomiques) et mettent en œuvre des mesures de gestion portant sur les captures (exemple : taille minimum des captures et total autorisé de captures pour les espèces soumises à une lourde pression de pêche) et sur les pratiques de pêche (réglementation des engins de pêche, des maillages, etc.) ;
•
des systèmes de gestion spécifiques jugés essentiels pour la reconstitution des stocks d’invertébrés et des stocks de poisson victimes de pêche intensive soient mis en place et gérés par les communautés à des échelles dépassant les frontières actuelles des villages ;
•
les autorités de Nauru envisagent l’aménagement d’une ou deux aires marines protégées couvrant les habitats appropriés. (Des études sur l’écologie des récifs seront nécessaires avant de sélectionner les meilleurs sites à protéger. Il faut également veiller à laisser, en dehors des aires marines protégées, des zones de pêche suffisamment riches pour que la population puisse satisfaire ses besoins alimentaires par la pêche) ;
•
dans le cas où les autorités mettent en place un régime de gestion, de préférence géré par les communautés, elles mettent simultanément en œuvre un programme de sensibilisation de sorte que les habitants et les communautés comprennent parfaitement en quoi les mesures de gestion sont nécessaires et pourquoi le soutien de communauté est indispensable à la réussite du régime de gestion ;
•
les autorités envisagent de réglementer l’usage du scaphandre autonome pour la chasse sous-marine, vu que cet engin surpasse, en termes d’efficacité, toutes les autres techniques de pêche traditionnelles, et peut avoir des effets dramatiques sur les stocks de poissons ciblés en l’absence de réglementation ;
•
les pêcheurs locaux exploitent les Acanthuridae herbivores présents en abondance de façon durable, au lieu des perroquets, des loches, des vivaneaux et des empereurs qui sont probablement victimes de l’impact des activités halieutiques actuelles ;
•
les autorités continuent de promouvoir le développement de la pêche au large, en particulier des espèces de thon et d’autres espèces pélagiques, afin de réduire la pression de pêche exercée sur les ressources du littoral ;
xii
•
les autorités examinent des moyens d’aider les pêcheurs locaux à passer à une pêche pélagique en : ○ encourageant l’emploi de bateaux motorisés et en améliorant l’accès au carburant ; et ○ mouillant des dispositifs de concentration du poisson en eaux peu profondes, accessibles aux pêcheurs par pirogue à pagaie non motorisée, perpétuant ainsi les pratiques de pêche des pêcheurs de Kiribati et de Tuvalu qui ont quitté Nauru ;
•
les autorités envisagent de donner un coup d’accélérateur au développement de la filière aquacole (comme l’élevage en eau douce de chanidés) et examinent les possibilités de mariculture de certaines espèces, afin d’élargir les possibilités offertes actuellement par les ressources récifales ;
•
les autorités demandent une évaluation des stocks de poissons intéressant l’aquariophilie et, si les possibilités d’exploitation durable des stocks et d’exportation sont viables, encouragent le développement de cette activité par le truchement du secteur privé et de mesures de gestion adéquates ;
•
toute étude de terrain complémentaire sur les invertébrés, conduite par la CPS, soit axée sur les espèces qui inquiètent le plus la population de Nauru et qui sont actuellement au centre de l’activité de pêche, et comprenne une évaluation de la santé et de la dynamique de la population de Turbo spp. et des espèces nocturnes de crustacés (surtout les langoustes et les crabes) ; et
•
les autorités envisagent l’introduction de Tridacna maxima, et peut-être de trocas adultes, au sein d’une zone protégée de la pêche et du ramassage, voire au sein d’une aire marine protégée recommandée ci-dessus.
xiii
ACRONYMS AND ABBREVIATIONS ACP ADB AIMS AUD AusAID BdM B-S CCA CoFish CPUE Ds D-UVC EDF EEZ FAD FAO FL GDP GPS GRT ha HH MCRMP MIRAB MOP MOPs MOPt MPA MSA NASA NCA NFC NFMRA Ns OCT PICTs PROCFish PROCFish/C
xiv
African, Caribbean and Pacific Group of States Asian Development Bank Australian Institute of Marine Science Australian dollar(s) Australian Agency for International Development bêche-de-mer (or sea cucumber) broad-scale crustose coralline algae Pacific Regional Coastal Fisheries Development Programme catch per unit effort day search distance-sampling underwater visual census European Development Fund exclusive economic zone fish aggregating device Food and Agricultural Organization (UN) fork length gross domestic product global positioning system gross registered tonnage hectare household Millennium Coral Reef Mapping Project Migration, Remittances, Aid and Bureaucracy (model explaining the economies of small island nations) mother-of-pearl mother-of-pearl search mother-of-pearl transect marine protected area medium-scale approach National Aeronautics and Space Administration (USA) nongeniculate coralline algae Nauru Fisheries Corporation Nauru Fisheries and Marine Resources Authority night search Overseas Countries and Territories Pacific Island countries and territories Pacific Regional Oceanic and Coastal Fisheries Development project Pacific Regional Oceanic and Coastal Fisheries Development project (coastal component)
RBt RFID RFs RFs_w SBq SBt SCUBA SE SOPAC SPC USD WHO
reef-benthos transect Reef Fisheries Integrated Database reef-front search reef-front search by walking soft-benthos quadrat soft-benthos transect self-contained underwater breathing apparatus standard error Pacific Islands Applied Geoscience Commission Secretariat of the Pacific Community United States dollar(s) World Health Organization
xv
1: Introduction and background 1.
INTRODUCTION AND BACKGROUND
Pacific Island countries and territories (PICTs) have a combined exclusive economic zone (EEZ) of about 30 million km2, with a total surface area of slightly more than 500,000 km2. Many PICTs consider fishing to be an important means of gaining economic self-sufficiency. Although the absolute volume of landings from the Pacific Islands coastal fisheries sector (estimated at 100,000 tonnes per year, including subsistence fishing) is roughly an order of magnitude less than the million-tonne catch by the industrial oceanic tuna fishery, coastal fisheries continue to underpin livelihoods and food security. SPC’s Coastal Fisheries Management Programme provides technical support and advice to Pacific Island national fisheries agencies to assist in the sustainable management of inshore fisheries in the region. 1.1
The PROCFish and CoFish programmes
Managing coral reef fisheries in the Pacific Island region in the absence of robust scientific information on the status of the fishery presents a major difficulty. In order to address this, the European Union (EU) has funded two associated programmes: 1. The Pacific Regional Oceanic and Coastal Fisheries Development project (PROCFish); and 2. The Coastal Fisheries Development Programme (CoFish) These programmes aim to provide the governments and community leaders of Pacific Island countries and territories with the basic information necessary to identify and alleviate critical problems inhibiting the better management and governance of reef fisheries and to plan appropriate future development. The PROCFish programme works with the ACP countries: Fiji, Kiribati, Papua New Guinea, Vanuatu, Samoa, Solomon Islands, Tonga, Tuvalu, and the OCT French territories: French Polynesia, Wallis and Futuna, and New Caledonia, and is funded under European Development Fund (EDF) 8. The CoFish programme works with the Cook Islands, Federated States of Micronesia, Marshall Islands, Nauru, Niue and Palau, and is funded under EDF 9. The PROCFish/C (coastal component) and CoFish programmes are implementing the first comprehensive multi-country comparative assessment of reef fisheries (including resource and human components) ever undertaken in the Pacific Islands region using identical methodologies at each site. The goal is to provide baseline information on the status of reef fisheries, and to help fill the massive information gap that hinders the effective management of reef fisheries (Figure 1.1).
1
1: Introduction and background
Figure 1.1: Synopsis of the PROCFish/C* multidisciplinary approach. PROCFish/C conducts coastal fisheries assessment through simultaneous collection of data on the three major components of fishery systems: people, the environment and the resource. This multidisciplinary information should provide the basis for taking a precautionary approach to management, with an adaptive long-term view. * PROCFish/C denotes the coastal (as opposed to the oceanic) component of the PROCFish project.
Expected outputs of the project include: •
•
•
•
• 1.2
the first-ever region-wide comparative assessment of the status of reef fisheries using standardised and scientifically rigorous methods that enable comparisons among and within countries and territories; application and dissemination of results in country reports that comprise a set of ‘reef fisheries profiles’ for the sites in each country, in order to provide information for coastal fisheries development and management planning; development of a set of indicators (or fishery status reference points) to provide guidance when developing local and national reef fishery management plans and monitoring programmes; toolkits (manuals, software and training programmes) for assessing and monitoring reef fisheries, and an increase in the capacity of fisheries departments in participating countries in the use of standardised survey methodologies; and data and information management systems, including regional and national databases. PROCFish/C and CoFish methodologies
A brief description of the survey methodologies is provided here. These methods are described in detail in Appendix 1. 1.2.1 Socioeconomic assessment Socioeconomic surveys were based on fully structured, closed questionnaires comprising: 1. a household survey incorporating demographics, selected socioeconomic parameters, and consumption patterns for reef and lagoon fish, invertebrates and canned fish; and 2. a survey of fishers (finfish and invertebrate) incorporating data by habitat and/or specific fishery. The data collected addresses the catch, fishing strategies (e.g. location, gear used), and the purpose of the fishery (e.g. for consumption, sale or gift). Socioeconomic assessments also relied on additional complementary data, including: 3. a general questionnaire targeting key informants, the purpose of which is to assess the overall characteristics of the site’s fisheries (e.g. ownership and tenure, details of fishing
2
1: Introduction and background gear used, seasonality of species targeted, and compliance with legal and community rules); and 4. finfish and invertebrate marketing questionnaires that target agents, middlemen or buyers and sellers (shops, markets, etc.). Data collected include species, quality (process level), quantity, prices and costs, and clientele. 1.2.2
Finfish resource assessment
The status of finfish resources in selected sites was assessed by distance-sampling underwater visual census (D-UVC) (Labrosse et al. 2002). Briefly, the method involves recording the species name, abundance, body length and distance to the transect line of each fish or group of fish observed; the transect consists of a 50 m line, represented on the seafloor by an underwater tape (Figure 1.2). Mathematical models were then used to infer fish density (number of fish per unit area) and biomass (weight of fish per unit area) from the counts. Species surveyed included those reef fish of interest for marketing and/or consumption, and species that could potentially act as indicators of coral reef health (See Appendix 1.2 for a list of species.). The medium-scale approach (MSA; Clua et al. 2006) was used to record habitat characteristics along transects where finfish were counted by D-UVC. The method consists of recording substrate parameters within twenty 5 m x 5 m quadrats located on both sides of the transect (Figure 1.2).
3
1: Introduction and background
Figure 1.2: Assessment of finfish resources and associated environments using distancesampling underwater visual censuses (D-UVC). Each diver recorded the number of fish, fish size, distance of fish to the transect line, and habitat quality, using pre-printed underwater paper. At each site, surveys were conducted along 24 transects, with six transects in each of the four main geomorphologic coral reef structures: sheltered coastal reefs, intermediate reefs and back-reefs (both within the grouped ‘lagoon reef’ category used in the socioeconomic assessment), and outer reefs.
Fish and associated habitat parameters were recorded along 24 transects per site, with an equal number of transects located in each of the four main coral reef geomorphologic structures (sheltered coastal reef, intermediate reef, back-reef, and outer reef). The exact position of transects was determined in advance using satellite imagery; this assisted with locating the exact positions in the field and maximised accuracy. It also facilitated replication, which is important for monitoring purposes. Maps provided by the NASA Millennium Coral Reef Mapping Project (MCRMP) were used to estimate the area of each type of geomorphologic structure present in each of the studied sites. Those areas were then used to scale (by weighted averages) the resource assessments at any spatial scale.
4
1: Introduction and background 1.2.3 Invertebrate resource assessment The status of invertebrate resources within a targeted habitat, or the status of a commercial species (or a group of species), was determined through: 1. resource measures at scales relevant to the fishing ground; 2. resource measures at scales relevant to the target species; and 3. concentrated assessments focussing on habitats and commercial species groups, with results that could be compared with other sites, in order to assess relative resource status. The diversity and abundance of invertebrate species at the site were independently determined using a range of survey techniques, including broad-scale assessment (using the manta-tow technique) and finer-scale assessment of specific reef and benthic habitats. The main objective of the broad-scale assessment was to describe the large-scale distribution pattern of invertebrates (i.e. their relative rarity and patchiness) and, importantly, to identify target areas for further fine-scale assessment. Broad-scale assessments were used to record large sedentary invertebrates; transects were 300 m long × 2 m wide, across inshore, midshore and more exposed oceanic habitats (See Figure 1.3 (1).). Fine-scale assessments were conducted in target areas (areas with naturally higher abundance and/or the most suitable habitat) to specifically describe resource status. Fine-scale assessments were conducted of both reef (hard-bottom) and sandy (soft-bottom) areas to assess the range, size, and condition of invertebrate species present and to determine the nature and condition of the habitat with greater accuracy. These assessments were conducted using 40 m transects (1 m wide swathe, six replicates per station) recording most epi-benthic resources (those living on the bottom) and potential indicator species (mainly echinoderms) (See Figure 1.3 (2) and (3).). In soft bottom areas, four 25 cm × 25 cm quadrats were dug at eight locations along a 40 m transect line to obtain a count of targeted infaunal molluscs (molluscs living in bottom sediments, which consist mainly of bivalves) (See Figure 1.3 (4).). For trochus and bêche-de-mer fisheries, searches to assess aggregations were made in the surf zone along exposed reef edges (See Figure 1.3 (5) and (6).); and using SCUBA (7). On occasion, when time and conditions allowed, dives to 25–35 m were made to determine the availability of deeper-water sea cucumber populations (Figure 1.3 (8)). Night searches were conducted on inshore reefs to assess nocturnal sea cucumber species. See Appendix 1.3 for complete methods.
5
1: Introduction and background
Figure 1.3: Assessment of invertebrate resources and associated environments. Techniques used include: broad-scale assessments to record large sedentary invertebrates (1); finescale assessments to record epi-benthic resources and potential indicator species (2) and (3); quadrats to count targeted infaunal molluscs (4); searches to determine trochus and bêche-de-mer aggregations in the surf zone (5), reef edge (6), and using SCUBA (7); and deep dives to assess deep-water sea cucumber populations (8).
1.3
Nauru
1.3.1
General
The Republic of Nauru (Figure 1.4) consists of a single raised coral atoll, 21.9 km2 in land area, with an EEZ of 320,000 km2. Located 41 km south of the equator, Nauru has no fresh water sources and limited fertile land to support subsistence or commercial agriculture; thus, future development of the country relies significantly on marine resources. Coastal resources are restricted to a narrow 50–300 m wide coral ‘belt’ surrounding the 19 km circumference of the island, although the open ocean areas are frequented by an abundance of tuna and other pelagic species. As an isolated island, Nauru is dependent on shipping and air services for the provision of food and other supplies, mostly from Australia (FAO 2002a). The economy of Nauru has been based on phosphate mining, which commenced at the start of the 20th century. To assist in export of the mined phosphate, the Pacific Phosphate Company built a small boat harbour in 1904 (Williams and MacDonald 1985); the Nauru Phosphate Company took control of the harbour in 1967. The money generated from royalties paid to local landowners supported a healthy economy through to the 1990s. Declining phosphate prices, the high cost of maintaining an international airline, and the government’s financial mismanagement combined to make the economy collapse in the late 1990s (http://geography.about.com). Referred to as a ‘resource curse’ scenario, what eventuated in the end was the failure of other economic sectors, wasteful expenditure, the existence of a ‘welfare state’, a neglected education system, and people without skills to develop an alternative economy to mining (Connell 2006). To cut costs, the government has frozen wages and reduced the size of the civil service (CIA 2007).
6
1: Introduction and background
Figure 1.4: Map of Nauru.
Nauru had a population of 10,131 people in 2002, of which 7572 were indigenous Nauruans of predominantly Micronesian origin, and the remainder mostly I-Kiribati, Tuvaluan and Chinese. Of the total, 5159 were males and 4972 were females (SPC 2006). From 2003 estimates, population density was quoted as 577, the highest in the region (SPC 2006). This high density may be attributed to the concentration of settlements along the coastal fringe of the island. From 2003 estimates, 38.9% of the population was below the age of 19, projecting a very young population, which means increased demand for land, education and health services and, more importantly, accelerated pressure on existing marine resources in future. Total population figures quoted could, however, have dropped significantly following the return of I-Kiribati and Tuvalu foreign workers to their countries at the beginning of 2006 and the gradual decrease in population in the last few years because of increasing migration to other countries following the economic crisis. There are 630 individual named pieces of land to which people in Nauru have tenure, with no publicly held land; thus, the government has no control over land for planning or development (Thaman and Hassall 1998). This has been interpreted as a challenge for any form of development or rehabilitation that may take place. Most of the parcels of land are inherited through the mother, and most areas are shared. For the purpose of dispersing of royalties from phosphate mining, the system worked well and people were affluent. However, after mining, people have no land for housing, agriculture and other uses. Through phosphate mining, natural vegetation and topsoil have been removed from over 70% of the land area, primarily at the centre of the island, thus preventing the movement of a rapidly increasing
7
1: Introduction and background population from the coastal fringe, heightening land pressures and disputes around that fringe, and possibly causing microclimate deterioration (ADB 2000). Both inland and coastal erosion are increasing problems in Nauru, and coastal erosion is regarded as of special concern owing to the possibility of global warming – induced sea-level rise. Coastal erosion has mostly been from development of reef channels, enlargement of the boat harbour at Anibare, and extension of the airport runway (Thaman and Hassall 1998). In 2000, 17 beach profiles were established around Nauru to monitor changes in the beach areas. The intention was to identify coastal erosion, collect information on countermeasures that were proposed at state level, and establish a baseline dataset (SOPAC 2005). Social issues A socioeconomic assessment report by AusAID (Government of Nauru 2004) highlighted a significant deterioration in the humanitarian situation in Nauru since the beginning of 2004. Food security has emerged as a serious issue as a consequence of policy failure and chronic economic decline, which have resulted in a total regression of development, with people resorting to basic subsistence fishing and farming for survival. Men, women and children forage on reefs and hunt birds daily for food, and families are resorting to extended family systems to barter wild food for imported food items. These activities are indicative of a situation completely opposite to the common trend of the shift from traditional to imported foods. At the same time, Nauru’s Human Development Index ranking has slipped to a medium level in recent years as GDP per capita has fallen. Education has remained a neglected sector worsened by years of welfare state governance, which led to a lifestyle of luxury and leisure (ADB 2000). Because of loss in purchasing power, people rely on their extended family and on the meagre salaries received to purchase basic necessities. The government has not established a definition of poverty, nor a poverty line, to determine the incidence of poverty. However, government policies have recognised the disadvantaged state people are in, especially with low incomes and insufficient subsistence production given the poor health and education status and the fragility of the atoll environment in which they live (ADB 2000). 1.3.2
The fisheries sector
Nauru’s fisheries comprise the offshore fishery for tuna and other pelagic species, the smallscale tuna fishery around fish aggregating devices (FADs), and reef fisheries for a range of fish and invertebrate species. Offshore tuna fishery Nauru does not have a strong history in offshore tuna fishing. Early surveys conducted from 1971 to 1974 by the Japan Marine Fishery Resources Research Centre concluded that domestic pole-and-line fishing was not feasible due to the lack of suitable baitfish around Nauru (SPC 1984). However, Japanese distant-water pole-and-line vessels carrying their own baitfish took 25,000 t of tuna between 1972 and 1978 in areas that would now be within the Nauru EEZ (SPC 1984). Foreign longline fishing activities were also undertaken in the mid1970s, with annual catches of 948–2799 t. Some exploratory purse-seining was undertaken in the waters around Nauru in the late 1970s, with 83 t of tuna caught in two sets (SPC 1984).
8
1: Introduction and background In an attempt to enter the tuna fishery, the Nauru Fishing Corporation was established in 1976 by the Nauru Government. It purchased two 948 GRT purse seiners from the Eastern Pacific in 1980. The two vessels were from Peru, with Peruvian skippers, engineers and crew. They proved to be unsuccessful at catching tuna as the nets being used were too shallow. In 1986/87, one of the vessels sank off Nauru in a storm. The second vessel was moved to the Philippines in 1987/88, where it was chartered to a local company and eventually sold (Chapman 1998; Sokimi and Chapman 2001). In 1997, the Nauru Fisheries and Marine Resources Authority (NFMRA) was established and replaced the then Fisheries Department. NFMRA in 1998 established the Nauru Fisheries Corporation (NFC) as its commercial arm, as NFMRA had no legislative power to conduct commercial operations (Sokimi 2005). NFC purchased two longline vessels, one (18.5 m) in 2000 and the other (12 m) in 2002. Both vessels have experienced extensive breakdowns that have restricted fishing activities. In addition, when the vessels have been fishing, only low catch rates have been achieved and the fishing operations have not been economically viable. Small-scale tuna fishery around FADs The ocean mooring buoys that are used to secure bulk carriers for loading phosphate have doubled as FADs for local fishers. I-Kiribati and Tuvaluan workers from the phosphate company use traditional canoes they have built to fish around these buoys, which are only 350 m from the reef (Cusack 1987; Sokimi and Chapman 2002). Fishing methods include light handlines for catching mackerel scad (used for bait for tuna), jigging using a handline with special weight and feather jig for rainbow runner, and drop-stone or midwater handlining for larger tunas and associated species using the freshly caught mackerel scad (Cusack 1987). In 1992 there were 128 canoes and 88 outboard-powered skiffs owned by the migrant workers (Chapman 2004). During the 1990s, the Nauru Fisheries Department, which became the NFMRA in 1997, commenced a FAD programme to assist local fishers. Deep-water FADs were deployed at a distance of 1.5–3.5 km off the reef in depths of 1500–2600 m (Chapman et al. 1998). These FADs were mainly to aggregate the passing schools of skipjack tuna and yellowfin tuna, so that local Nauruan fishers using outboard-powered skiffs could troll at these locations, reducing their fuel costs and increasing their chance of a good catch. In 1992 there were 130 skiffs owned by Nauruans, and these were mainly used for trolling for tuna off the coast and around FADs (Chapman 2004). Three FADs were deployed off Nauru in early 2005 to further assist local fishers as the economy of Nauru continued to decline (Sokimi 2005). However, increased fuel costs and a shortage of fuel have greatly limited the ability of Nauruans to fully utilise these FADs, adding to the increasing shortage of fish for local consumption. Reef fisheries As stated previously, coastal resources are restricted to a narrow 50–300 m wide coral ‘belt’ surrounding the 19 km circumference of the island. Despite this limitation in coral reef area, Nauru has a relatively rich marine biota. Nauru is estimated to have 300–500 finfish species alone, an estimation based on the number of species around nearby islands (Thaman and Hassall 1998). The main categories of marine resources include a wide range of finfish, as
9
1: Introduction and background mentioned, and a more limited range of turtles, crustaceans, octopus, shellfish, holothurians, other invertebrates and algae. Reef finfish fisheries in Nauru are regarded as subsistence or semi-artisanal. Fish and marine resources have traditionally constituted an important component of the Nauruan diet (Tuara 1998). In 1999, fishing contribution was about 2% of GDP. However, nearly 60% of Nauru’s domestic fisheries is derived from coastal pelagic species through the use of trolling and midwater handlining techniques as mentioned above (Jacob and Depaune 2001; ADB 2001). Bottom fishing by handline is conducted along the outer-reef slope targeting both shallow and deep demersal species; shallow-water snappers dominate the catch from this fishery (FAO 2002b; Jacob and Depaune 2001; Thaman and Hassall 1998; Dalzell 1992). Other common fishing methods practised in Nauru over the years include scoop-net fishing for flying fish, and spearfishing (using both SCUBA and the conventional method of skin diving) targeting edible species of snapper, grouper, squirrelfish/soldierfish, trevally and surgeonfish. Reef gleaning for octopus, turban shell and other invertebrates is also common. With the current fuel price and fuel availability, fishing is commonly restricted to canoe fishing, diving (snorkel and some SCUBA) and gleaning on the reeftops in the immediate outer-reef zone. Fishing and gathering food have recently re-emerged as activities that are critical for maintaining adequate nutrition, but at the same time sustainability of the reefs is a major concern. Much of the catch taken by Nauruans is shared along family lines, although catch in excess of immediate need is occasionally sold. The value of the catch of Nauru’s domestic fisheries is about USD 1.7 million (FAO 2002a). Because fish form a large part of the diet of Nauruans, it is important that the levels of fishing activity and the volume and composition of landings be determined for management purposes. Little information is available on the status of fisheries stocks in Nauru, particularly inshore resources (SPC 1994; Dalzell 1992; Lodge 1992). The need for a clear, comprehensive marine resource profile has been raised over the years (SPC 1994; Lodge 1992; FAO 2002a; ADB 2005). The only available information is on finfish abundance, which is based on data collected through coral reef monitoring work (Jacob 2000). Decline of reef fisheries resources has been documented since 1994 (Dalzell and Debao 1994), and with the recent higher dependence on reef resources, this has become a major concern (ADB 2005; Nauru Fisheries & Marine Resources Authority 2005; FAO 2002a). Overfishing, pollution, detrimental fishing methods and mining are the main threats to marine resources (Jacob 2000). An FAO report (2002a) recorded certain reef species becoming scarce, a decrease in average size of fish, and the use of SCUBA for fishing and collecting. Some inshore finfish species of cultural importance that already show evidence of overexploitation are a wide range of shallow-water snapper, rock cod, grouper and coral trout species, squirrelfish and soldierfish, lined bristletooth and large moray eels. Daily reef gleaning activities have also reportedly led to overexploitation of turban shell or emwari, lobster and octopus (Thaman and Hassall 1998). Because of the economic crisis facing Nauruans at the start of the 21st century, there has been a dramatic increase in reef fishing, gleaning and collecting and this has placed enormous pressure on the reef system. Previous reports (Thaman and Hassall 1998; FAO 2002a; ADB 2000; SOPAC 2005) have cited concerns about resource status and overexploitation. Increasing population, commercialisation, and the use of motorised fishing boats, more
10
1: Introduction and background efficient fishing techniques and some destructive fishing techniques have placed great pressure on Nauru’s limited inshore resources (Thaman and Hassall 1998). With fishing now being the only major fallback option for people, the vulnerability of marine resources has increased significantly. The challenge for Nauru will be the ability to sustain people’s livelihoods, and the need for some management measures to ensure that the resources are able to sustain populations into the future. The need to maintain fragile systems and the impact of any further environmental decline, such as the collapse of marine resources on the reef, could result in further decline in the conditions under which people currently live (Gillett and Lightfoot 2002). 1.3.3
Fisheries management
NFMRA is a statutory corporation that has the responsibility of overseeing, managing and developing the country’s natural marine resources and environment. Under the Fisheries Act 1997, the general objective of fisheries management in Nauru is ‘the sustainable utilisation of the fisheries and marine resources of Nauru to achieve economic growth, improved social standards, improved nutritional standards, human resource development, increased employment and a sound ecological balance’ (Republic of Nauru 1997). NFMRA operates under this Act, which applies to all local and foreign persons and to all foreign and local fishing vessels. Under the Act, the Minister has powers to determine allowable catch and to advise NFMRA to draw up a strategy for management of a fishery and specify limitations for licences, quotas for foreign vessels, etc. Under the Act the Minister can also prohibit fishing or a fisheries activity, which can include prohibitions by species, sub-species, class or type of fish, method, time, date, season, period and so on. Drift netting, use of explosives and poison, use of FADs, importation of live fish and sale of fish are also covered in the Act. Regulations are well covered under the Act, but the enforcement of these regulations is a challenge given the financial state of the country. Aside from fisheries development efforts, there is little government intervention in the inshore fisheries. This is an important sector, and in Nauru, as is the case in many island nations, coastal fishery commodities often go a long way towards fulfilling the immediate cash needs of the largely subsistence communities (Adams and Ledua 1997). Because of the declining state of resources coupled with the increasing overdependence of the population on reef and inshore species, there is an urgent need to strengthen management capabilities. Primary responsibility for the enforcement of the Fisheries Act 1997 is with the police force, and one of the concerns is the lack of training of officers in maritime surveillance and in regulations and their enforcement in inshore areas. Two main provisions in the Act are restrictions on certain fishing methods and the protection of certain identified vulnerable invertebrate and finfish species: ‘Traditional marine tenure systems once formed an important link to Nauruan communities but since the commencement of phosphate mining, it has generated into an open access or ‘free for all’ system, which means that there are no longer any community or traditionally managed fisheries on Nauru’ (FAO 2005). Some conservation ethics do remain known to Nauruans and could be used when implementing management. In addition to the Nauru Fisheries and Marine Resources Authority Act, fisheries legislation includes the Fisheries Act (1997), which regulates both foreign and domestic fishing activities; the Sea Boundaries Act (1997), which establishes Nauru’s claim over a 12-mile territorial waters zone, a 24-mile contiguous zone and a 200-mile EEZ; and the Fisheries Regulations (1998), which regulate foreign fishing vessels in Nauru’s zone.
11
1: Introduction and background A Micronesia sub-regional meeting on coastal legislation acknowledged that coastal fisheries legislation in the Pacific Island States of Micronesia was highly undeveloped and that there was insufficient capacity and/or resources available at the national level to effectively manage coastal fisheries in the Pacific Island States of Micronesia (FAO 2005). Also, development of fish farming could alleviate pressure on reef fishing (Nauru Fisheries & Marine Resources Authority 2005). There is definitely a need for management of marine resources, and the best way to do this is by regulation, based on a scientifically determined maximum sustainable yield catch. However, this will require better resource profiles on the population dynamics of Nauru’s fisheries resources (Thaman and Hassall 1998). 1.4
Selection of sites in Nauru
Under normal operations, the PROCFish/C and CoFish programmes select four representative sites for work in each country or territory. However, in the case of Nauru, it was possible to survey the whole country due to the small size of the island and the limited reef area. Therefore, Nauru was considered as a single site, and that is how the results are presented in this report.
12
2: Profile and results for Nauru 2.
PROFILE AND RESULTS
2.1
Site characteristics
Nauru is a single, raised coralline island located 41 km south of the equator. Coastal resources are restricted to a 50–300 m wide coral ‘belt’ surrounding the 19 km circumference of the island. Most of the population lives around a 300 m wide coastal green fringe. Reefrelated fishing concentrates mostly on the immediate surrounding outer reef. Similar to other study sites elsewhere in the Pacific region, the total area of the fishing ground (67 km2) in Nauru is calculated from maps of the island. Nauru’s fishing ground (Figure 2.1) includes a narrow fringing intertidal flat (3.4 km2) and an outer reef immediately behind the breakers (2.6 km2), and adjacent deep ocean areas over the continental shelves around the island (61 km2). The inner-reef pools are very shallow and narrow (2.15 km2 of the intertidal flat), and many of them dry up at low tide. Encircling the island, the fringing reef is characterised by a few coral heads (predominantly Acropora and Porites genera) growing on mineral rock that lies along the northern (ocean) side of Nauru (Figure 2.2). Two channels that cut into the narrow fringing reef give ready access to boats and canoes. The different location of the Gabab (west coast) and Anibare (east coast) channels permits access to the sea when prevailing winds change direction.
Figure 2.1: Main reefal structures adjoining Nauru.
13
2: Profile and results for Nauru
Figure 2.2: Aerial images of Nauru Island showing the coastline and reef area.
2.2
Socioeconomic surveys
Socioeconomic field work was carried out in 11 of the 14 districts in Nauru during October 2005. The resident population at this time was estimated at 10,131 (1230 households) and this was the figure used for extrapolation of data in the study. Household interviews focused on the collection of general demographic, socioeconomic and consumption data, with 245 households surveyed. Of the households interviewed, 97% were engaged in fishing activities. In addition, a total of 405 finfish fishers were interviewed, made up of 357 males and 48 females. For invertebrates, 283 fishers were interviewed: 134 males and 149 females. There was a higher participation of men in finfish fishing, with women more involved in invertebrate fishing. In some cases the same person may have been interviewed for both finfish fishing and invertebrate harvesting. 2.2.1 The role of fisheries in the community: fishery demographics, income and seafood consumption patterns Survey results indicate an average of 3.7 fishers per household. If this average is consistent for all households in Nauru, when extrapolated the total number of fishers in Nauru is 4513, which includes 2947 males and 1566 females. Data on income sources indicate that the main source of income is from government employment, with some people employed in the private sector. Nauru has minimal incomegeneration alternatives except through salaries from government work, which account for 86% of total income source (Figure 2.3). Those who rely on fisheries as first income account for only 5% of households interviewed, and were mainly the Kiribati and Tuvalu people who sell pelagics and offshore species; thus, income from fisheries and agriculture is negligible. There is no external export of fish in Nauru; all sales are domestic. Some people have moved 14
2: Profile and results for Nauru to small, home-based business ventures or informal selling as a first (7%) or second (7%) means of income (Figure 2.3), and this involves the selling of cooked food, cigarettes and home-brewed alcohol. The selling of seabirds for food has also increased. Very few households received any form of remittance; thus, external input into the economy was insignificant. Nauru has no commercial bank and no means of financial transactions, which restricts remittances being a possible form of income. % of all households surveyed 90 80 70 60 50 40 30 20 10 0 fisheries
agriculture
1st income source
salaries
others
2nd income source
Figure 2.3: Ranked sources of income (%) in Nauru. Total number of households = 245 = 100%. Some households have more than one income source st nd and those may be of equal importance; thus double quotations for 1 and 2 incomes are possible. ‘Others’ are mostly home-based small businesses. Sales from fisheries are mostly of pelagic and offshore species.
15
2: Profile and results for Nauru kg/capita/year 60
50
40
30
20
10
0 finfish (regional average)
finfish (FAO 2002)
finfish (PROCFish invertebrates (edible canned fish 2005) meat) (PROCFish (PROCFish 2005) 2005)
Figure 2.4: Per capita consumption (kg/year) of fresh fish in Nauru (n = 245) compared to national and regional averages (FAO 2002a), and consumption of invertebrates and canned fish. Figures are averages from all households interviewed, and take into account age, gender and nonedible parts of fish.
Per capita consumption of fresh fish was recorded at 46.5 kg/year, which is slightly higher than the previously recorded 44 kg/year (FAO 2002a) (Figure 2.4). The increasing per capita consumption directly relates to the high reliance on seafood as a source of protein given the continuing economic decline. The standardised salaries at AUD 140 a fortnight for all government workers in the country mean that the purchasing power of people is very low. This is apart from those employed in the private sector on lower salaries or inconsistent wages, and those without any form of employment. Finfish is consumed at an average of 3.8 times a week, while invertebrate consumption is much lower with a frequency of about twice a month (Table 2.1). Canned fish is also frequently consumed, at an average of 2.4 times a week for most households and per capita consumption per year at ~16 kg, which is considerable, however, only about one-third of the finfish consumption. For many families canned fish is an affordable substitute and can be cooked as soup and in many other ways to feed large families. The low consumption of invertebrates could be due to their overharvest, as supported by the missing species groups and depleted state of resources shown in the independent assessment. Interviewees talked of walking longer distances and decreases in size of species, although invertebrates may not have been important in traditional harvests. There is very high reliance on fresh fish, with many households interviewed consuming their own catches or buying fish from or being given fish by relatives and neighbours. Catches recorded show a move to species not previously targeted or commonly consumed, such as some species of the Acanthuridae family. Annual household expenditure is low (USD 3050 per household/year) with families spending within the usual and standardised salary. The limited income is used for household necessities, basic foodstuffs and electricity only. People are barely surviving financially; thus, there is not much purchasing of items apart from basic household necessities.
16
2: Profile and results for Nauru Table 2.1: Fishery demography, income and seafood consumption patterns in Nauru Nauru (n = 245 HH)
Survey coverage Demography HH involved in reef fisheries (%) Number of fishers per HH Male finfish fishers per HH (%) Female finfish fishers per HH (%)
97.1 3.7 (±0.16) 37.0 0.3
Male invertebrate fishers per HH (%) Female invertebrate fishers per HH (%) Male finfish and invertebrate fishers per HH (%) Female finfish and invertebrate fishers per HH (%)
0.1 17.6 28.1 16.8
Income st
HH with fisheries as 1 income (%) nd HH with fisheries as 2 income (%) st HH with agriculture as 1 income (%) nd HH with agriculture as 2 income (%) st HH with salary as 1 income (%) nd HH with salary as 2 income (%) st HH with other source as 1 income (%) nd
HH with other source as 2 income (%) Expenditure (USD/year/HH) (1) Remittance (USD/year/HH)
4.9 17.1 0.4 1.2 85.7 2.9 6.9 6.9 3048.88 (±86.35) 159.96 (±47.63)
Seafood consumption Quantity fresh fish consumed (kg/capita/year) Frequency fresh fish consumed (time/week) Quantity fresh invertebrate consumed (kg/capita/year) Frequency fresh invertebrate consumed (time/week) Quantity canned fish consumed (kg/capita/year) Frequency canned fish consumed (time/week) HH eat fresh fish (%) HH eat invertebrates (%)
46.45 (±2.74) 3.79 (±0.14) 1.63 (±0.19) 0.53 (±0.04) 15.86 (±1.12) 2.42 (±0.12) 100.0 75.1
HH eat canned fish (%) HH eat fresh fish they catch (%) HH eat fresh fish they buy (%) HH eat fresh fish they are given (%) HH eat fresh invertebrates they catch (%) HH eat fresh invertebrates they buy (%) HH eat fresh invertebrates they are given (%)
91.8 89.8 60.4 62.0 67.8 2.0 31.8
HH = household; (1) average sum for households that receive remittances; numbers in brackets are standard error.
2.2.2
Fishing strategies and gear
Fishing is a daily activity, with men, women and children out on the reef and tidal flats at low tide. Fishers in Nauru hardly target bêche-de-mer, trochus or giant clams: trochus and clams were not present, as confirmed by the invertebrate survey results. Bêche-de-mer had until recently never been harvested but, because of food needs, people are starting to consume some species of surf redfish and lollyfish; this was verified by the findings of the invertebrate team. Sea urchins are also being targeted more for consumption. Children actively participate in fishing and this is increasingly common when they are not at school because of lack of transportation and/or lack of food to take to school.
17
2: Profile and results for Nauru Degree of specialisation in fishing Men dominate both fisheries, with 37% of male fishers engaged in finfishing only. About half of all female fishers target either exclusively invertebrates (18%), or fish for finfish and invertebrates (~18%) (Figure 2.5). A considerable proportion of male fishers (28%) also is engaged in both finfish and invertebrate fishing. % 40 35 30 25 20 15 10 5 0 finfish fishers
male
invertebrate fishers
finfish & invertebrate fishers
female
Figure 2.5: Proportion (%) of fishers who target finfish or invertebrates exclusively, and those who target both finfish and invertebrates in Nauru. All fishers = 100%.
From all interviews recorded, ~80% of all coastal finfishing occurs within the narrow fringing intertidal flat and inner pools, or close to the breakers and harbour entrances. This habitat is referred to as ‘sheltered coastal reef’. Another 20% target the outer reef behind the breakers and the deep ocean part around the island. Catch composition reported by respondents is dominated by species that are oceanic, e.g. tunas, rather than exclusively reefbased. For invertebrates, most fishing is concentrated on the reeftops (reef platforms – Figure 2.6), with 87% of male fishers and 95% of female fishers engaging in some form of reeftop gleaning or general collecting activity along the intertidal zones.
18
2: Profile and results for Nauru
lobster 6% soft benthos 1%
reeftop 93%
Figure 2.6: Proportion (%) of fishers targeting the three primary invertebrate habitats found in Nauru. Data based on individual fisher surveys.
Fishing strategies Boat ownership in Nauru at the time of survey could not be used as an accurate indication of fishing participation because of the fuel shortage, coupled with the inability of people to purchase fuel. People mostly walked on the reefs and free-dived along reef slopes. Boat usage was confined to the use of canoes by the Kiribati and Tuvalu communities. Fishing trips were during the day except for lobster diving, which was mostly at night. Night fishing was not pursued because people could not afford torches or fuel for boat trips. Targeted stocks/habitats Most female fishers and male fishers targeted the sheltered coastal reef and the adjacent outer reef, just behind the breakers (Table 2.2). Very few fishers fished for pelagic species, mainly because they were unable to obtain or afford fuel for the necessary motorised boat transport. Women were more involved in collecting invertebrates, mainly targeting the reeftop areas, while free diving for lobsters was practised almost exclusively by men (Table 2.2). Lobster diving was not a regular activity, as fishing was mostly by groups of fishers and mainly in response to orders received from buyers. A very limited number of species were also collected from soft-benthos or intertidal areas, but the amount was insignificant.
19
2: Profile and results for Nauru Table 2.2: Proportion (%) of interviewed male and female fishers harvesting finfish and invertebrate stocks across a range of habitats (reported catch) in Nauru Resource
% male fishers interviewed
Habitat
Finfish
Invertebrates
Sheltered coastal reef Sheltered coastal reef & outer reef Outer reef Lobster Reeftop (platform) Soft benthos (intertidal)
% female fishers interviewed 78.6 7.7 19.2 13.7 94.8 0.4
95.3 2.3 2.3 0.7 98.9 1.1
Finfish fisher interviews, males: n = 357; females: n = 48. Invertebrate fisher interviews, males: n = 134; females: n = 149. Passage fishing was limited to fishing within the boat passage at Anibare.
Gear Fishing techniques in Nauru were varied (Figure 2.7). Most fishers used more than one technique, and sometimes several methods were used on fishing trips. This applied in particular to spear diving, which was rarely reported to be performed exclusively. Castnets, handlines and spear diving were the most common techniques used, followed by gillnets and deep-bottom lines or other techniques used to target deep-bottom species. Deep-bottom line and drop-stone methods combined with another method, e.g. spear diving or handlining, were the main methods used when fishing on the outer reefs and in the deep ocean. The closer to the coastline, the more castnets were dominant, followed by spear diving and gillnetting. Spear diving was particularly common among fishers who ventured between the shallow fringing reef and the more protected outer-reef area behind boulders and in the harbour entrances. Free diving was more commonly practised than SCUBA diving. % 100 90 80 70 60 50 40 30 20 10 0 handline & others
longline & others
sheltered coastal reef
gillnet & others
deep castnet & bottom line others & others
cast rod & spear diving handheld others & others spear walking & others
sheltered coastal reef & outer reef
outer reef
Figure 2.7: Fishing methods commonly used in different habitat types in Nauru. Proportions are expressed in % of total number of trips to each habitat. One fisher may use more than one technique per habitat and target more than one habitat in one trip.
20
2: Profile and results for Nauru Fishing pressure Information on the number of fishers, the frequency of fishing trips and the average catch per trip was used to estimate the pressure on the fishing grounds (Table 2.4). Frequency and duration of fishing trips Nauru has limited coastal reef areas with shallow inner pools; thus fishing was generally conducted on the coastal reef areas, in the harbour entrances, behind breakers and along the outer-reef slopes. Both male and female fishers targeted the sheltered coastal reef once per week on average (Table 2.3). Areas further offshore were targeted much less frequently because of the lack of fuel. However, it should be noted that, while individuals fished about once a week, in an average household there were four fishers who fished to provide protein and food for the family, e.g., on average, one household fished four times a week. The same was true for invertebrate fishing. There was not much difference between men and women in hours spent finfishing (3–4 hours). Compared to collecting invertebrates, finfishing was generally conducted more frequently and was also more time consuming. Table 2.3: Average frequency and duration of fishing trips reported by male and female fishers in Nauru Resource
Habitat
Sheltered coastal reef Sheltered coastal reef & outer Finfish reef Outer reef Soft benthos Invertebrates Reeftop Lobster
Trip frequency (trips/week) Male Female fishers fishers
Trip duration (hours/trip) Male Female fishers fishers
1.29 (±0.06)
1.16 (±0.14)
3.53 (±0.09)
3.02 (±0.11)
0.89 (±0.14)
0.23 (n/a)
2.89 (±0.11)
4.00 (n/a)
0.78 (±0.09) 1.00 (n/a) 1.05 (±0.23) 0.42 (±0.06)
0.46 (n/a) 2.25 (±0.25) 1.15 (±0.13) 0.23 (n/a)
3.12 (±0.11) 3.00 (n/a) 2.76 (±0.17) 4.31 (±0.11)
4.00 (n/a) 3.25 (±0.25) 2.76 (±0.11) 4.00 (n/a)
Figures in brackets denote standard error. n/a: standard error not calculated. Finfish fisher interviews, males: n = 357; females: n = 48. Invertebrate fisher interviews, males: n = 134; females: n = 149.
2.2.3
Catch composition and volume – finfish
The reported total annual catch of finfish by survey respondents was almost 60 t/year. As shown in Figure 2.8., 92% was accounted for by male fishers, and only ~8% by female fishers. Most fishing by both men and women was conducted on the zone closest to shore, and much less on the outer-reef area, further away from the breakers and representing the open ocean. Details of recorded annual catch by vernacular and scientific names are given in Appendix 2.1. If we extrapolate our survey data to the entire population of Nauru, we obtain a total annual catch figure of 419.96 t, and a total demand of 413.66 t/year. Our calculated annual demand of Nauru’s total residential population thus accounts for 98.5% of our extrapolated annual total catch. The balance of 1.5% is considered to be well in the range of acceptable error.
21
2: Profile and results for Nauru
Subsistence: 98.5%
Export: 1.5%
Finfish: Total reported catch = 49.58 t/year = 100%
Male fishers (n = 357) 92.3%
Female fishers (n = 48) 7.7%
Sheltered coastal reef 76.5% (n = 286)
Sheltered coastal reef 7.6% (n = 46)
Sheltered coastal reef & outer reef 5.4% (n = 28)
Sheltered coastal reef & outer reef 0.1% (n = 1)
Outer reef 10.4% (n = 69)
Outer reef 0.1% (n = 1)
Figure 2.8: Total annual finfish catch (tonnes) by habitat and gender (reported catch) in Nauru. Officially there is no export of fish from Nauru. The figure of 1.5% that was extrapolated from the survey data is either an acceptable error generated by the model or possibly represents fish sent as gifts, e.g. to overseas relatives. kg/fisher/year 160 140 120 100 80 60 40 20 0 sheltered coastal reef
male fishers
sheltered coastal reef & outer reef
outer reef
female fishers
Figure 2.9: Average annual finfish catch (kg/year) per fisher by habitat and gender in Nauru. Bars represent standard error.
22
2: Profile and results for Nauru Proportion of reported annual finfish catch by habitat and gender The zone closest to shore was subject to the highest fishing pressure; this was due not only to the number of fishers, but also to the highest annual catch, i.e. ~130 kg/fisherman/year and ~90 kg/fisherwoman/year (Figure 2.9). For the outer-reef (open ocean) area, the average annual catch reported by male fishers was ~70–90 kg/fisherman/year. These annual catches correspond well to the fact that most fishers were fishing for their household’s needs; if surplus fish were caught, some were sold locally. The fact that most fishers did not use a boat explains the relatively low CPUE figures. Indeed, CPUE were lower for the sheltered coastal reef (0.7 kg/hour fished) and higher (0.9 kg/hour fished) if the areas closer to shore are combined with outer-reef slope fishing. Surprisingly, on average, fishers who targeted the outer-reef (open ocean) habitat, did not fish more efficiently (~0.7 kg/hour fished). This may be explained by the fact that these fishing trips take longer, and also by the small sample size of fishers interviewed (Figure 2.10). Generally, there was no significant difference in CPUE between men and women fishing the habitat close to shore. Female fishers’ CPUE for the other two habitats may be misleading due to the very limited sample size. Respondents indicated that most of their catch, regardless of where it came from, was intended for their family consumption. Much less was shared on a non-commercial basis, or sold locally among the Nauru population (Figure 2.11). The share of fish caught for subsistence, distribution and income-generating reasons was very much determined by the recent economic crisis. Respondents highlighted, in particular, that the more common way of sharing now was among families and neighbours. Sometimes fish was reported to be exchanged for imported goods. The small proportion of catch sold locally corresponded to the weak financial power of the Nauruan people. The survey showed that it was mainly Kiribati and Tuvalu families (who favoured pelagic fishing) who were selling catch locally, i.e. predominantly pelagic rather than reef fish. There was no international export of finfish or invertebrates. kg/hour 1.0 0.9 0.8 0.7 0.6 0.5 0.4 0.3 0.2 0.1 0.0 sheltered coastal reef
male fishers
sheltered coastal reef & outer reef
female fishers
outer reef
average
Figure 2.10: Catch per unit effort (kg/hour of total fishing trip) for male and female fishers by habitat type in Nauru. Effort includes time spent transporting, fishing and landing catch.
23
2: Profile and results for Nauru % 80
60
40
20
0 sheltered coastal reef
subsistence
sheltered coastal reef & outer reef
gift
outer reef
sale
Figure 2.11: The use of finfish catches for subsistence, gift and sale, by habitat in Nauru. Proportions are expressed in % of the total number of trips per habitat.
Catches from the sheltered coastal reefs were composed predominantly of the families Acanthuridae (38.5%), Holocentridae (12.1%), Lutjanidae (10.4%), Serranidae (7.7%) and Carangidae (5.7%). Catch composition changed slightly if the areas close to shore were combined with harbour entrances and outer-reef areas close to breakers, i.e. still mainly Acanthuridae (38%), but now followed by Lutjanidae (20.1%), Serranidae (8.1%) and Carangidae (4.8%). At the outer reef, which is pelagic fishing in Nauru, not surprisingly, Scombridae (59.2%) dominated the reported catch, followed by Carangidae (13.3%), Elagatis bipinnulata (13.6%) and Acanthuridae (6.9%). Detailed information on the distribution of fish families in reported catches and the percentage of total weight per habitat fished is provided in Appendix 2.2. Comparison of the average size of fish of various families across the different habitats where these fish were caught (Figure 2.12) reveals that, in general, fish sizes were small with an average of 20 cm fork length for catches reported from the areas close to shore. The more fishers venture out into the open ocean or outer-reef habitats, the larger are the reported average fish sizes, i.e. 30–35 cm on average.
24
2: Profile and results for Nauru cm 40 35 30 25 20 15 10 5 Ac an th ur id ae Ba lis tid ae Ca ra ng Ch id ae ae to do nt id Ho ae lo ce nt rid ae Ky ph os id ae Lu tja ni da e M ug ilid Po ae m ac en tri da e Sc ar id ae Sc om br id ae Se rra ni da Sp e hy ra en id ae
0
sheltered coastal reef
sheltered coastal reef & outer reef
outer reef
Figure 2.12: Average sizes (cm fork length) of fish caught by family and habitat in Nauru.
Estimates of fishing pressure (Table 2.4) are rather unreliable in the case of Nauru as the sheltered coastal reef is indeed a very small intertidal reef-flat area. Most of Nauru’s fishing grounds can be classified more accurately as outer-reef and oceanic conditions, including harbour entrances and areas close to breakers. It can be assumed that fish caught in the zone close to shore are closely linked to the general nature of Nauru’s fishing ground, which is open ocean. Fishers that catch on the intertidal flat areas tap into the same resource as those that venture out into harbour entrances and around breakers using canoes. However, we have tried to accommodate the known surface areas, fisher and catch numbers accordingly. Table 2.4: Parameters used in assessing fishing pressure on finfish resources in Nauru Parameters
Habitat Sheltered (1) coastal reef
Fishing ground area (km²) Average annual finfish catch (kg/fisher/year) Density of fishers (number of fishers/km² fishing ground) Population density (people/km²) Total fishing pressure of subsistence catches (t/km²) Number of fishers (per habitat) Total population Total subsistence catch (t/year)
Sheltered coastal reef & outer reef
Outer reef
Total fishing ground
(2)
5.9
n/a
61.0
127.5 (±6.23)
92.9 (±16.30)
74.3 (±10.31)
514
n/a
9
66.9
57 151 6.2
3042 10,131 413.7
251
553
3846 413.7
(1)
n/a = no size information available; includes the fringing flat (3.4 km²) and the outer reef immediately behind the breakers (2.6 km²); (2) deep ocean area over the continental shelves around the island.
25
2: Profile and results for Nauru 2.2.4
Catch composition and volume – invertebrates
All invertebrate catches are from reeftops (platforms) and intertidal flats, some of which have sandy or soft-benthos patches, with the exception of lobster, which is targeted along reef slopes. Lobster is targeted especially for commercial purposes. A total of 14 vernacular names were recorded for gleaning, two of these also applied to soft-benthos harvesting. Lobster diving is represented by two common names, however, only one refers to lobster while the second name represents a reef mollusc that is often picked up at the same time (Figure 2.13). soft-benthos invertebrate fishery, 2
lobster fishery, 2
reeftop invertebrate fishery, 14
Figure 2.13: Number of vernacular names recorded for each invertebrate fishery in Nauru.
The estimated total annual catch reported by fishers equals 23.3 t/year (Appendix 2.5). Of these, 45% are taken by men and 55% by women. According to respondents, the annual reported catch of ~23 t (wet weight) is mainly removed from reeftops (platforms) by gleaning (~95%), while the shares of lobster diving (4.5%) and soft-benthos collection (0.3%) are rather insignificant (Figure 2.14). Invertebrate: Total reported catch = 23.3 t/year = 100%
Male fishers (n = 134) 45.3%
Female fishers (n = 149) 54.7%
Reeftop 41.4% (n = 117)
Reeftop 54.3% (n = 146)
Intertidal 0.1% (n = 1)
Intertidal 0.3% (n = 5)
Lobsters 3.8% (n = 17)
Lobsters 0.1% (n = 1)
Figure 2.14: Total annual invertebrate catch (tonnes wet weight) and proportion (%) by fishery and gender (reported catch) in Nauru. n is the total number of interviews conducted per each fishery; total number of interviews may exceed total number of fishers surveyed as one fisher may target more than one fishery and thus respond to more than one fishery survey only.
26
2: Profile and results for Nauru kg/fisher/year 120
100
80
60
40
20
0 lobster
male fishers
reeftop
soft benthos
female fishers
Figure 2.15: Average annual invertebrate catch (kg wet weight/year) by fisher, gender and fishery in Nauru. Data based on individual fisher surveys. Figures refer to the proportion of all fishers that target each habitat (n = 134 for males, n = 149 for females).
Comparison of the average annual catch by fishery and by gender (Figure 2.15) reveals that reeftop gleaners had by far the highest annual catch rates by wet weight. Female fishers were more productive than male fishers, i.e. on average female reeftop gleaners collected ~11 kg more than male reeftop gleaners per year. Concerning the total annual impact per species group, Figure 2.16 shows that the highest annual catches (in terms of kg wet weight removed) occurred in seven major species groups (i.e. Etisus, Octopus, Turbo, Thais, Tripneustes and Cardisoma) with each accounting for >2 to >3 t/year of the recorded wet weight. In addition, there were four further species groups that contributed, though to a much lesser extent, 1.2–1.7 t/year wet weight each (i.e. Actinopyga, Panulirus, Grapsus, and Cypraea). Another six species accounted for a total of 0.7 t/year wet weight only. Respondents stated concerns about decline of catches and sizes of Turbo spp., Cardisoma spp. and Octopus spp. Concern about decline in certain species, especially Turbo spp., has also been mentioned in the invertebrate section of this report, with a recommendation for measures to manage the species. Details on the species distribution per habitat, and on size distribution by species, are provided in Appendices 2.3 and 2.4.
27
2: Profile and results for Nauru
kg/year 3500
3000 2500 2000 1500 1000 500 0
a a p. . ra p. illa p. tus p. us an an sp rat spp ea a sp ige riti us sp riti did s sp g n a u u i o m n l r s a a u e b m o r le r i a p e a l o b t m m p r l u o s s T ais s s Oct ga ga Panu s a Cyp rdi eu Th su py py pn Ca psu no no Eti a i i Tri r t t G Ac Ac
derom dagiga emari
degawe enor
land crab
Ibirara kunebenari
lobsters deimao egupea others
Figure 2.16: Total annual invertebrate catch (kg wet weight/year) by species (reported catch) in Nauru. ‘Others’ is made up of Nerita plicata (goigoi), Trochus spp. (trochus), Spondylus spp. (oyster), Lambis lambis (irinme), Cymatium spp. (eom) and Grapsus albolineatus (kika).
Invertebrate fishing was predominantly for home consumption. The very marginal quantity (wet weight) caught for sale mainly refers to lobsters, which were sold on the local market (Figure 2.17). With the economic crisis, food security has become a priority for the people of Nauru, and this trend also shows in the invertebrate resource use. consumption & sale combined 401 sale 795
consumption 22,129
Figure 2.17: Total annual invertebrate biomass (kg wet weight/year) used for consumption, sale, and consumption and sale combined (reported catch) in Nauru.
As indicated earlier, both men and women fished for invertebrates and the invertebrate fisheries can be classified as a common fishery for both genders, with women slightly dominating over men in reeftop gleaning. The highest fisher density and highest annual catch per fisher (in kg wet weight/fisher/year) was in fishing on the reeftop zone, which was the major fishing habitat in Nauru (Table 2.5). The overfishing of the reeftop areas resulted from this high concentration on a single habitat. Appendix 2.5 provides the total annual catch of invertebrates by species and category of use.
28
2: Profile and results for Nauru Table 2.5: Parameters used in assessing fishing pressure on invertebrate resources in Nauru Fishery Fishing ground area (km²) Number of fishers (per fishery) Density of fishers (number of fishers/km² fishing ground) Average annual invertebrate catch (kg/fisher/year)
Lobster
(1)
Reeftop
(2)
Intertidal flats
19.28 246
3.41 2807
60
12.76
823
n/a
79.96 (n/a)
85.41 (±5.99)
26.06 (n/a)
n/a = no information available or standard error not calculated; (1) distance outside reef perimeter in km; (2) reeftop partially exposed.
2.2.5 Discussion and conclusions •
There has been a steady increase in the intensity and frequency of fishing since the economic crisis in 1999, and this trend continues. Shortage of fuel and economic hardships faced by the people limit the use of improved fishing gear and powered boats, but have not lessened the fishing pressure.
•
The reported catch data indicate that almost all catches are from the coastal reef areas, with most male fishers combining reef fishing activities with deep-bottom and deep-sea fishing. Men target finfish more than do women and are the more regular fishers. Reef fishing is predominantly for home consumption, while pelagic and deep-sea fishing is both for subsistence and income generation, especially for the I-Kiribati and Tuvaluan communities. Like finfish fishing, invertebrate fishing is basically for home consumption, except that lobsters are frequently sold locally.
•
Current fishing carried out in Nauru is low cost, with people walking and the main boats used being canoes. Sharing of catches among families and within communities is common and sharing of finfish is more common than sharing of invertebrates. Gleaning activities in Nauru are dominated by species such as Etisus, Octopus, Turbo, Thais, Tripneustes and Cardisoma and to a lesser extent Actinopyga, Panulirus, Grapsus, and Cypraea. Most of these species were recorded as consumed in most of the households interviewed, with respondents acknowledging declines in catches and sizes.
•
Canned fish consumption is high, as households increasingly rely on tinned fish as a protein source. Tinned fish was affordable by most families as small quantities can be prepared as soup and in other ways to feed large families. The dietary pattern is a reversal of the common trend of increased reliance on imported foods, as people have moved back to relying on traditional food sources.
•
Local marketing of finfish is very rare and marketing of invertebrates is non-existent (apart from lobsters). The reliance on marine products for basic food needs and the lack of transportation and outlets for marketing contribute to this. Almost all finfish catch is consumed or given to relatives, and only a small proportion of catches is reported sold.
•
With increasing pressure on resources, there is an urgent need for management strategies to be put in place. These could be implemented at the district or national level, taking into account the open access nature of tenureship. There are no traditional institutions in place in Nauru, but there are district administrations that could be used to organise people and activities at the district and community level. There also exists legislation, which principally empowers the Minister of Fisheries to implement various management
29
2: Profile and results for Nauru measures, ranging from quotas to restrictions on gear and bans on fishing in certain reef areas. These wide-ranging powers allow the provision of various forms of management. •
The very high fishing pressure on coastal reef resources requires a move into pelagic and deep oceanic species. At the moment most people are prevented from doing this by fuel shortages and financial inability to engage in the fishery. District-based and communityimplemented and -monitored management mechanisms could be a starting point in the planned setting-up of MPAs (Nauru Fisheries & Marine Resources Authority 2005). Expansion of existing aquaculture initiatives is required to address needs for alternative food sources and to take the pressure off declining wild stocks. There is, however, an urgent need for public awareness work on the vulnerability of marine resources given the high fishing intensity and increased household dependence on reef fisheries. Public education and awareness work is necessary before the implementation of any form of management.
2.3
Finfish resource surveys
Finfish resources and associated habitats were assessed between 4 October and 3 November 2005, from a total of 50 transects (See Figure 2.15 for transect locations and Appendix 3.1 for transect coordinates.). With the exception of days of adverse weather and sea conditions, the surveys were planned in such a way as to enable similar numbers of dives for each working day. There was an opportunity for local fisheries officers to work and learn on the job with regard to the survey techniques, thereby enhancing their fish and habitat identification skills. 2.3.1
Finfish assessment results
A total of 18 families, 49 genera, 129 species and 45,043 fish were recorded in the 50 transects (Appendix 3.2). Data relating to the 15 most dominant families in the region (here represented by only 13) form the basis of this assessment. The assessment includes fish information that represents 42 genera, 120 species and 44,748 individuals. Of this, a mean of eight fish families, 18 fish genera, 32 fish species and 900 ±33.9 individual fish were observed and recorded in each transect in Nauru (Table 2.6). Nauru’s outer-reef system is composed primarily of abiotic hard bottom (77% cover, primarily limestone slab) with trenches that cut through the pavement; it steeply drops off immediately after the surge zone (Table 2.6). No soft coral was observed during the surveys. The structure of fish families is relatively similar to other study sites, with the dominance of Acanthuridae and Balistidae particularly similar to that found in Kiribati’s outer reef. In these families, the predominance in density of fish genera Acanthurus, Ctenochaetus, Naso, Zebrasoma, Melichthys, Balistapus and Sufflamen is noted. The two families are represented by a total of 34 species, with particularly high abundance of Acanthurus nigricans, Ctenochaetus striatus, A. lineatus, Melichthys vidua, Naso lituratus, Zebrasoma scopas, A. triostegus, Balistapus undulatus, Sufflamen bursa, Rhinecanthus rectangulus and S. chrysopterus (Tables 2.7 and 2.8).
30
2: Profile and results for Nauru
Figure 2.15: Habitat types and transect locations for finfish assessment in Nauru. Table 2.6: Primary finfish habitat and resource parameters recorded in Nauru (average values ±SE; range for depth) Parameters
Outer reef
Number of transects 2 Total habitat area (km ) Depth (m) Soft bottom (% cover) Rubble & boulders (% cover) Hard bottom (% cover) Live coral (% cover) Soft coral (% cover) Biodiversity (species/transect) 2 Density (fish/m ) 2 Biomass (g/m ) (2) Size (cm FL) Size ratio (%) (1)
50 2.52 (1)
8.5 (3-16) 0.20 ±0.08 1.37 ±0.74 77.15 ±1.96 21.19 ±1.98 0 32 1.49 ±0.06 212.85 ±9.46 16.81 ±0.20 60.07 ±0.71
Depth range; (2) FL = fork length.
Table 2.7: Finfish resource assessment in Nauru Main habitat Main substrate Main families Main species
Assessment
Outer reef Hard bottom Acanthuridae and Balistidae Acanthurus nigricans, Ctenochaetus striatus, Acanthurus lineatus, Acanthurus triostegus, Melichthys vidua, Naso lituratus, Zebrasoma scopas, Balistapus undulatus, Sufflamen bursa, Rhinecanthus rectangulus, Sufflamen chrysopterus Resources targeted relatively low Possible negative human impact on targeted populations of Lutjanidae, Lethrinidae, Scaridae and Serranidae Predominance of populations of Acanthuridae and Balistidae
31
2: Profile and results for Nauru Table 2.8: Species contributing most to main families in terms of densities and biomass in the outer-reef environment of Nauru Family
Species
Acanthurus nigricans Ctenochaetus striatus Acanthurus lineatus Acanthuridae Zebrasoma scopas Acanthurus triostegus Naso lituratus Melichthys vidua Balistapus undulatus Balistidae Sufflamen bursa Rhinecanthus rectangulus Sufflamen chrysopterus
Common name White-cheek surgeonfish Lined bristletooth Striped surgeonfish Two-tone tang Convict surgeonfish Orange-spine unicornfish Pink-tail triggerfish Orange-line triggerfish Scythe triggerfish Wedge-tail triggerfish Half-moon triggerfish
Density 2 (fish/m )
Biomass 2 (g/m ) 0.32 0.22 0.20 0.10 0.06 0.11 0.12 0.05 0.02 0.02 0.02
31.0 19.7 48.8 4.7 4.0 34.1 14.7 10.0 2.3 2.4 2.5
The dominant herbivorous surgeonfish show their typical association with hard substrate areas of clear and seaward reefs from the lower surge zone. The often mixed-species aggregations of these fish occur in fact over coral, rock, pavement or rubble substrates, where they feed on filamentous algae, blue-green algae and diatoms as well as various small invertebrates. Similarly, the dominant population of triggerfish was observed in large numbers in seaward reefs, particularly in coral-rich areas exposed to oceanic currents. Unlike surgeonfish, the triggerfish diet consists mainly of detritus with the addition of crustaceans. Therefore, the outer-reef environment provides suitable conditions and habitat characteristics for the dominance of large groups of surgeonfish and triggerfish around the island. The dominant biomass of fish genera follows the same trend as the density, with dominance of the same two families, Acanthuridae and Balistidae. It includes, in order of decreasing biomass, Acanthurus, Ctenochaetus, Melichthys, Naso, Zebrasoma, Balistapus and Sufflamen. The total biomass is not significantly influenced by other families of large-sized fish, such as Lethrinidae, Lutjanidae, Serranidae and Scaridae, which are present in very low numbers (Figure 2.16). These trends can only be explained by intense fishing pressure on reef fisheries.
32
120
80
40
Biomass Biomass (g/m²) (g/m2)
20
10
0
0
160
0 120
80
40
0
Plankton.Feeder Plankton.Feeder
Plankton.Feeder
Plankton.Feeder
Carnivore
Piscivore
0 Piscivore
50
Piscivore
100
Piscivore
0
Herbivore
10
Herbivore
20
Herbivore
30
Detritivore
40
Detritivore
Herbivore
0
Detritivore
200 Soft_Bottom
Soft_Coral
Live_Coral
Hard_Bottom
Rubble_Boulders
Density (fish/1000 m²) Density (Fish/1000m2)
400
Carnivore
30
Size (FL, cm) Size (cm FL)
Zanclidae
Siganidae
Serranidae
Scaridae
Pomacanthidae
Mullidae
Lutjanidae
Lethrinidae
Labridae
Kyphosidae
Chaetodontidae
600
Detritivore
50
Size ratio (%) Size ratio (%)
Zanclidae
Siganidae
Serranidae
Scaridae
Pomacanthidae
Mullidae
Lutjanidae
Lethrinidae
Labridae
Kyphosidae
Chaetodontidae
Balistidae
Acanthuridae
Density (fish/1000 m²) Density (fish/1000m2) 800
Carnivore
Zanclidae
Siganidae
Serranidae
Scaridae
Pomacanthidae
Mullidae
Lutjanidae
Lethrinidae
Labridae
Kyphosidae
Balistidae
Acanthuridae
Size (FL, cm) Size (cm FL) 1000
Carnivore
Zanclidae
Siganidae
Serranidae
Scaridae
Pomacanthidae
Mullidae
Lutjanidae
Lethrinidae
Labridae
Kyphosidae
160
Chaetodontidae
100
Chaetodontidae
Balistidae
Acanthuridae
Size ratio (%) Size ratio (%) 40
Balistidae
Acanthuridae
Biomass (g/m²) Biomass (g/m2)
cover Cover(%) (%)
2: Profile and results for Nauru Habitat characteristics
Mean depth 8 m (3-16 m)
80
60
40
20 0
1000 800
600
400
200 0
Figure 2.16: Profile of finfish resources in the outer-reef environment of Nauru. FL = fork length.
33
2: Profile and results for Nauru 2.3.2 Discussion and conclusions •
The finfish resource assessment indicates that Nauru has a very high population of surgeonfish and triggerfish, but alarmingly low populations of targeted and commercial species of grouper, snapper, emperor and parrotfish. The semi-pelagic species of trevally, fusilier, baitfish and tuna appear to be in relatively good numbers, perhaps only sustainable for local needs. The relatively high abundance of surgeonfish and triggerfish correlates well with the high cover of hard substrate and abundant algae; moreover, such herbivorous fish are common in an outer-reef environment–the only habitat surveyed in Nauru. However, the high abundance of surgeonfish (Acanthuridae) and triggerfish (Balistidae) in Nauru could be related to recurrent ciguatera events. Available stocks of these two fish families far exceed those of the other 11 families. Nonetheless, small-size schooling species of mullet, snapper and goatfish are still common immediately behind the breaker zone.
•
Preliminary results suggest that the relatively low populations of commercially targeted grouper, snapper and emperor signal that stock sizes are currently at, or have already exceeded sustainable and optimum levels. Similarly, stock biomass of other less targeted edible species of parrotfish, now targeted by spearfishers (free diving and SCUBA), appears to be increasingly affected as well. Surgeonfish are the highest in abundance and are therefore suitable candidates for targeting as edible species.
•
When comparing the results of the finfish and socioeconomic surveys, specifically the species composition recorded, Balistidae is not common in the socioeconomic data. Those that are recorded in the socioeconomic data are mainly of different species from those recorded in the finfish results. This would indicate that Balistidae is not a favoured food fish and as such is not targeted when fishing, which would support the larger numbers of this family recorded during finfish surveys.
•
The family Acanthuridae (surgeonfish) is well represented in the socioeconomic data, although not to the species level in most cases. Acanthurus lineatus is the one species common in both datasets, which would indicate it is a species targeted during fishing activities. For other species in the Acanthuridae family, it is difficult to determine whether the species observed in the finfish data are targeted as food fish, or whether other species in this family are targeted and thus do not show up as significant.
•
The ‘fish kill’ phenomenon experienced in Nauru in 2004 remains a mystery, with algal bloom and/or heat shock triggered by prolonged uncommon elevated water temperature or an upwelling of de-oxygenated water from depth as possible explanations. Similar cases were reported from neighbouring islands and the atolls of Kiribati. While the phenomenon is not common, the mortality rate was high; thus, there is a need to consider it with other factors affecting the current state of reef fish. Other known environmentrelated problems on the island that are considered as having detrimental effects on the coral reefs are sewerage-pipeline discharges in the surf zone, remnant bulk-metal rubbish along the continental shelf of the port area, dredging work on the new fisheries channel and jetty (Figure 2.17), and the extension of the airport runway into the intertidal reef flat.
34
2: Profile and results for Nauru
A
B
C
D
Figure 2.17: Examples of environmentally related coastal developments on Nauru. (A) Port Harbour (phosphate loading facility); (B) Metal debris on continental shelf along port reef area; (C) Fisheries jetty and man-made harbour; (D) Associated reef channel.
In looking to the future, it is essential that Nauru start to monitor catches and examine management options for inshore finfish resources. There is scope to increase the catch of surgeonfish (Acanthuridae) and triggerfish (Balistidae), as the numbers of some species are quite high. They may not be the preferred target species for food, but their numbers would support additional fishing. In saying this, SCUBA fishing should be restricted as it is a very effective method and can lead to overfishing in a short period of time. Another management measure that could be considered is the implementation of one or more marine protected areas (MPAs) to protect selected habitats and fish stocks, while ensuring adequate fishing areas are still available for local fishing activities. There may also be potential for developing a small aquarium trade, as suitable species were recorded during the finfish surveys. However, a full assessment may need to be undertaken before promoting such an activity, including an economic evaluation of the transport costs versus potential returns, and it should be managed from the start.
35
2: Profile and results for Nauru 2.4
Invertebrate resource surveys
The diversity and abundance of invertebrate species at Nauru were independently determined using a range of survey techniques (Table 2.9): broad-scale assessment (using the ‘mantatow’ technique; locations shown in Figure 2.18) and finer-scale assessment of specific reef and benthic habitats (Figures 2.19 and 2.20). The main objective of the broad-scale assessment is to describe the distribution pattern of invertebrates (rareness/commonness, patchiness) on a large scale and, importantly, to identify target areas for further, fine-scale assessment. Then fine-scale assessment is conducted in target areas to specifically describe the status of resources in those areas of naturally higher abundance and/or most suitable habitats. Table 2.9: Number of stations and replicates completed at Nauru Survey method Broad-scale transects (B-S) Reef-benthos transects (RBt) Soft-benthos transects (SBt) Soft-benthos infaunal quadrats (SBq) Mother-of-pearl transects (MOPt) Mother-of-pearl searches (MOPs) Reef-front searches Sea cucumber night searches (Ns) Sea cucumber day searches (Ds)
Stations
Replicate measures 8 3 0 0 0 7 16 RFs 20 RFs_w 0 9
Figure 2.18: Broad-scale survey stations for invertebrates in Nauru. Data from broad-scale surveys conducted using ‘manta-tow’ board; black triangles: transect start waypoints.
36
48 transects 18 transects 0 transect 0 quadrat group 0 transect 42 search periods 96 search periods 120 search periods 0 search period 54 search periods
2: Profile and results for Nauru
Figure 2.19: Fine-scale reef-benthos transect survey stations and reef-front search survey stations for invertebrates in Nauru. Black circles: reef-benthos transect stations (RBt); inverted black triangles: reef-front search stations (RFs).
Figure 2.20: Fine-scale survey stations for invertebrates in Nauru. Black triangles: reef-front search by walking stations (RFs_w); black squares: mother-of-pearl search stations (MOPs); black stars: sea cucumber day search stations (Ds).
37
2: Profile and results for Nauru Forty-one species or species groupings (groups of species within a genus) were recorded in the Nauru invertebrate surveys. These include, among others, one bivalve, 15 gastropods, five sea cucumbers, nine crustaceans, four urchins and three starfish (Appendix 4.1). Information on key families and species is detailed below. 2.4.1
Giant clams
Habitat suitable for giant clams (Tridacnidae) is present in the form of reef platform and reef slope but is not extensive in area. The reef platform area (3.4 km2) presents only a marginal habitat for giant clams, being predominantly exposed at low tide and having no large areas of pool habitat where water exchange with the ocean is regular. Reef slope provided a more suitable habitat for giant clams, but again is limited in scale (2.5 km2, lineal distance 19 km). All reef areas around Nauru are accessible to fishers (No areas are protected from fishing.), and the reef facing southeast to northeast is comparatively the most exposed to ocean swell. The partially damaged wharf infrastructure in Anibare Bay is a result of exposure to constant and powerful wave action (not cyclone activity; Deiye pers. comm. 2006). The comparatively more sheltered western side was more accessible during the survey, with less current and swell (Prevailing conditions came from the east-northeast.). Reef slope (below the low tide mark) provides a relatively complex habitat, with good areas for sedentary invertebrates such as giant clams. Live coral cover (mainly encrusting and small colonies) is not high and was measured at 22.8% for broad-scale transects and 18.9% for fine-scale reef-benthos transect stations (Figure 2.21).
Ocean Influence
Ocean Influence
Relief
Relief
Complexity
Complexity 0
1
2
3
4
5
0
1
2
Grade Scale Live Coral
Live Coral
Reef Dead Coral
Reef Dead Coral
Rubble Boulders
Rubble Boulders
Soft Sediment
Soft Sediment
Soft Coral
Soft Coral 0
10
20
30
40
50
3
4
5
Grade Scale
60
70
80
0
10
Percent Substrate
20
30
40
50
60
70
80
Percent Substrate
CCA
CCA
Coralline
Coralline
Other_Algae
Other_Algae
Bleaching
Bleaching 0
10
20
30
40
Percent Cover
50
60
70
0
10
20
30
40
50
60
70
Percent Cover
Figure 2.21: Habitat recordings from broad-scale (left) and reef-benthos transect (right) surveys in Nauru. CCA = crustose coralline algae; grade scale is a 5-point scale used to describe habitat (See Methods and Appendix 1.).
Broad-scale sampling provided an overview of potential giant clam distribution across the reefs of Nauru, as did reef-front searches (RFs) and reef-benthos transects (RBt).
38
2: Profile and results for Nauru A study conducted in the late 1990s noted anecdotally that Tridacnidae clams in Nauru had become extinct (South and Skelton 2000). In our surveys on Nauru reefs, this result was confirmed: no dead or live giant clams were found. The only bivalve of interest recorded was the encrusting, inequivalve jewel box shell (Chama spp.). There is no mention in anecdotal records of when species of giant clam became extinct on Nauru or if the larger species (Tridacna squamosa, T. gigas and Hippopus hippopus) have ever been present in living memory. Unlike in many other Pacific Island nations, aquaculture of these species has not occurred in Nauru for restocking (Adams et al. 2001), although it remains on the priority list for aquaculture development (Nauru Fisheries & Marine Resources Authority 2005). 2.4.2 Mother-of-pearl species (MOP): trochus and pearl oysters Nauru is within the geographical range of naturally distributed stocks of trochus (Trochus niloticus), but there are no reports of these commercial topshells in the literature. During the survey no commercial trochus were recorded (live or dead), and as a remote coralline island, Nauru is unlikely to receive incoming recruits from remote reefs in the future (The planktonic larval life of trochus is short: 2–3 days and normally <7 days.). This commercial species is one of only two invertebrate species considered as high priority on the list for aquaculture development in Nauru (Nauru Fisheries & Marine Resources Authority 2005). The reefs around Nauru constitute a suitable benthos for adult trochus (19 km lineal distance of reef front). However, the reef platform on the coastline of Nauru is generally uplifted, with little submerged reef or shallow-water rubble area, which are characteristic habitats for juveniles of this species. Platform areas north and south of Anibare Bay hold some areas that are an exception and in these locations reeftops are more complex (Figure 2.22), with limestone pinnacles, boulders and seawater pools.
Ocean Influence
Ocean Influence
Relief Complexity
Relief Complexity 0
1
2
3
4
5
0
1
2
Grade Scale
3
4
5
Grade Scale
Live Coral Reef dead coral Rubble Boulders Soft sediment Soft Coral
Live Coral Reef dead coral Rubble Boulders Soft sediment Soft Coral 0
10
20 30
40 50
60
70
80
90
0
10
Percent Substrate
20 30
40
50
60
70
80
90
Percent Substrate
CCA Coralline Other Algae Bleaching
CCA Coralline Other Algae Bleaching 0
10
20
30
40
Percent Cover
50
60
70
0
10
20
30
40
50
60
70
Percent Cover
Figure 2.22: Habitat recordings from reef-front searches (left) and reef-front search by walking surveys (reeftop, right) in Nauru. CCA = crustose coralline algae; grade scale is a 5-point scale used to describe habitat (See Methods and Appendix 1.3.).
39
2: Profile and results for Nauru The condition of shallow-water areas at the reef crest and on top of the reef platform is not especially suitable, as substrates are generally covered by a high degree of epiphytes (i.e. the red algae, Jania adherens, that dominate algal growth-forming carpets on reef platforms) and there is little habitat for cryptic invertebrate juveniles. In addition, there are a few other species with a similar life history to trochus, e.g. the green topshell Tectus pyramis (of low commercial value) and members of the Astralium complex. No blacklip pearl oysters, Pinctada margaritifera (live or dead shells), were found in the survey. 2.4.3 Infaunal species and groups The reef systems in Nauru do not hold shell beds of in-ground resource species such as arc shells (Anadara spp.) or venus shells (Gafrarium spp.). Therefore, no fine-scale assessments or infaunal stations (quadrat surveys) were made. 2.4.4
Other gastropods and bivalves
The smaller spider conch (Lambis lambis) was recorded once while on deep dives for sea cucumber assessments, whereas Seba’s spider conch (L. truncata) was detected in low numbers in shallow-water dives (<10 m, mother-of-pearl searches) and deeper-water assessments (sea cucumber day survey). Unusually, no Astralium or Cerithium species were recorded in surveys on reef-benthos transects, reef-front searches (snorkel) or reef-front search walks (reeftop during low tide). Turbo spp. (T. argyrostomus, T. setosus) and Conus spp. were recorded only in low numbers. Other species targeted by fishers (resource species, e.g. Cypraea, Nerita, Thais and Vasum) were also recorded during independent survey. A review of all assessment data can be found in Appendices 4.1 to 4.7. Other bivalves, such as Chama spp., which are local rock oysters prized by gleaners, were rare. 2.4.5 Lobsters No dedicated night reef-front search was conducted for lobsters in this assessment (See Methods.), nor any night search for sea cucumbers; only one single daytime observation of a lobster was made (MOPs). There is a small lobster fishery in Nauru. A small group of local dive spearfishers usually fish lobsters at night to fill orders, which generally come from the restaurant sector. Lobsters are rarely available to the public and stocks seem to have decreased over recent years (Deiye pers. comm. 2006).
40
2: Profile and results for Nauru 2.4.6 Sea cucumbers2 Nauru’s 21.9 km2 of landmass is bordered by approximately 6 km2 of reef. The landmass is relatively large. A karstified limestone cap of coral origin about 550 m thick lies over an ancient submerged volcano (Hill and Jacobson 1989). However, there is little in the way of riverine outputs to explain the significant algal and epiphytic growth on reef platforms. In general, the oceanic influence of coastal reefs is offset by nutrient inputs into the system from land. There is little in the way of sandy, protected shallow-water areas. The lack of sediment and high degree of exposure make the reefs less than ideal for most deposit-feeding sea cucumbers (which eat organic matter in the upper few mm of bottom substrates). Even the reef platforms partially protected from swell are generally exposed to sun and wind at low tides. Species presence and density were determined through broad-scale, fine-scale and dedicated survey methods (Table 2.10, Appendix 4.7; see also Methods). During in-water assessments, six commercial species of sea cucumber were recorded (Table 2.10). The small range of commercial sea cucumbers was generally found at low density. Higher-value species associated with the reef were rare: black teatfish (Holothuria nobilis), blackfish (Actinopyga miliaris) and prickly redfish (Thelenota ananas). Lower-value species, such as flowerfish (Bohadschia graeffei), were similarly uncommon. Surf redfish (Actinopyga mauritiana), which are typically found on reef platforms and reef slopes (in the dynamic conditions characteristic of Nauru), were common and present the most promising commercial option. This species has not been heavily targeted in Nauru; alternatively, the reefs are especially well suited to this species. Surf redfish were recorded in 92% of broad-scale transects and 100% of reef-front swim searches. In walking searches on the reef platform, they were at lower abundance, as would be expected for an emerged platform, but the coverage was still relatively good compared with other sites in the Pacific (45% of RFs_w stations held surf redfish in Nauru). The methods of assessment put the density of A. mauritiana at approximately 200 per ha. Although promising, this density is not exceptional (≥600 individuals/ha have been recorded in Solomon Islands and French Polynesia). Abundances of surf redfish should be allowed to build before any commercial harvest is considered. It was noted that surf redfish is now also used as a subsistence food (the lining of the internal body wall is eaten raw). This is another factor to be considered by fisheries managers if this species is to be targeted for export. More protected areas of reef and areas of soft benthos are generally not available at Nauru. Lollyfish (Holothuria (Halodeima) atra) were recorded behind reef-crest areas on the exposed platform. This low-value species was recorded at high density at these locations, which is typical for this type of reef habitat. Deep dives on SCUBA (average 23 m ±0.7SE depth) were conducted in Nauru to obtain preliminary assessments of deep-water stocks, such as the high-value white teatfish 2
There has been a recent variation to sea cucumber taxonomy that has changed the name of the black teatfish in the Pacific from Holothuria (Microthele) nobilis to H. whitmaei. There is also the possibility of a future change in the white teatfish name. This should be noted when comparing texts, as in this report the ‘original’ taxonomic names are used.
41
2: Profile and results for Nauru (Holothuria (Microthele) fuscogilva) and prickly redfish (Thelenota ananas), and the lowervalue amberfish (Thelenota anax). Only prickly redfish was found, and this was recorded at low to moderate abundance.
42
Prickly redfish
Black teatfish H
H
L
L
M/H
M/H
0.3
2
164.2
16.4
24.6
179.2
Reef-benthos stations n=3 D DwP PP
2
8
92 250.0 250.0
B-S transects Commercial n = 48 (5) value (1) (2) (3) D DwP PP 100
0.2 5362 1.1
87 1.4 370.1
100 RFs 45 RFs_w 100 MOPs
3.9 6 RFs 5362 100 RFs_w 7.6 14 MOPs
87 3.1 370.1
Other stations RFs = 16; RFs_w = 20 MOPs = 7 D DwP PP D
54.7
1.2
3.6
5.2
82.1
10.7
8
46.4
DwP
Other stations Ds = 9 PP
67
11
44
11
43
D = mean density (numbers/ha); (2) DwP = mean density (numbers/ha) for transects or stations where the species was present; (3) PP = percentage presence (units where the species was found); (4) The scientific name of the black teatfish has recently changed from Holothuria (Microthele) nobilis to H. whitmaei and the white teatfish (H. fuscogilva) may have also changed name before this report is published. (5) L = low value; M = medium value; H= high value; (6) One specimen of A. miliaris was observed during the finfish survey; B-S transects= broad-scale transects; RFs = reef-front search; RFs_w = reef-front search by walking; MOPs = mother-of-pearl search; Ds = day search.
(1)
Thelenota ananas
Holothuria nobilis
Lollyfish
Holothuria atra
(4)
Flowerfish
Bohadschia graeffei
Blackfish
Actinopyga mauritiana
(6)
Surf redfish
Species
Actinopyga miliaris
Common name
Table 2.10: Sea cucumber species records for Nauru
2: Profile and results for Nauru
2: Profile and results for Nauru 2.4.7
Other echinoderms
No edible slate urchins (Heterocentrotus mammillatus) were recorded on the reef-front searches or sub-tidally in Nauru. Echinothrix spp. (mainly E. diadema) were very common (found in >95% of broad-scale transects and reef-front searches, at a mean density of close to 1000 per ha; see Table 2.11 and Appendices 4.1 to 4.8). No collector urchins (Tripneustes gratilla) were recorded in independent surveys, despite this species being recorded as the one targeted by fishers in the socioeconomic surveys. Table 2.11: Average density (numbers/ha) and total numbers of sea urchins found by various assessment methods at Nauru Assessment type
Echinometra mathaei Average density Total (numbers/ha) numbers
Broad-scale transects (B-S) Reef-benthos transect (RBt) Reef-front search (RFs) Reef front search by walking (RFs_w) Mother-of-pearl search (MOPs) Sea cucumber day search (Ds)
4.7 0.2 4.3
19 2 4
Echinothrix spp. Average density (numbers/ha) 1029.3 2711.8 782.1 0.3 1245.7 2.4
Total numbers 3050 244 3191 3 1151 6
Although urchins are collected as a subsistence food source, the high number of them on Nauru’s reefs and the low number of other sedentary species reflect a habitat that is becoming partially dominated by urchins. This type of situation has the potential to limit further recruitment of other species, as urchins dominate the cryptic spaces in the day and feed on or dislodge newly settled invertebrates at night. Starfish such as Linckia laevigata (the blue starfish) and coralivore starfish such as the pincushion star (Culcita novaeguineae) and crown of thorns (Acanthaster planci) were rarely observed in the survey (found in 2% of broad-scale transects). 2.4.8 Discussion and conclusions •
The key issue for Nauru with respect to management of coastal fisheries resources is that the island is geographically isolated from other Pacific reef systems that could be a source of replenishment/recruitment. Nauru is small in overall size and has limited area of intertidal and reef habitats; intertidal reef habitats often emerge for extended periods and cannot support large numbers of invertebrates. Even the submerged reef supports a low diversity of coral reef habitat and commercial/subsistence species complement compared to what is normally present in Pacific Island systems.
•
The loss of giant clams around Nauru is significant, as these are generally considered a cornerstone invertebrate group of species in subsistence reef fisheries. Anecdotal evidence suggests that a viable Tridacna (probably T. maxima) population was lost from Nauru as early as the 1980s, although a single specimen (18–25 cm) was reported as being seen as late as 2002 (at Gebab Channel, southwest of the island, in about 20 m depth; Deiye pers. comm. 2006). There are reports of the presence of dead giant clam shells outside people’s homes, which suggest giant clams were once commonly used in traditional customs (Petit-Skinner 1995, quoted in Jacob 2000). Although clams have been lost from the general catches of Nauru fishers, North et al. (1903, quoted in Jacob
44
2: Profile and results for Nauru 2000) documented the existence of Tridacna maxima (as T. elongate). The existence of a local name for giant clam in the Nauru dialect, earinbawo, suggests there was a more significant presence of giant clams in the past. •
It is also unfortunate that no marine protected areas (MPAs) exist to protect remnant stocks of overfished species and habitat for future restocking ventures. Effort to protect an area of reef may be considered for the northeast corner of Nauru, where habitat is less impacted and there appears to be greater diversity of species.
•
Data collected on this mission suggest that trochus (Trochus niloticus) can be transplanted to Nauru, although the reef platform habitat is not generally suitable for juvenile stages of their life history. Therefore, any release of trochus may consider first using adults, and making initial placement of transplanted shell in protective cages within well-circulated pools, then proceeding to a more staged release to the reef slope. Staged release of trochus will acclimatise the shell to local conditions, and careful placement in areas where epiphytic growth (and potential food sources for trochus) is more developed will ensure the transplanted stock has the best chance of survival.
•
Based on the information collected, there is a very limited number of sea cucumber species available for commercial fishing in Nauru. The exposed environment of Nauru plays a large part in defining its potential. High-value species, such as black teatfish (Holothuria nobilis) and prickly redfish (Thelenota ananas), are insufficient to support commercial fishing. The medium- to high-value species surf redfish (Actinopyga mauritiana) looks to be well suited to conditions in Nauru. Occurrence across stations was high, and density was moderate. If densities were to build (to 400–600 per ha), then commercial harvests of this species could be considered. Monitoring of this stock is suggested, as in future years good recruitment could offer opportunities for periodic commercial harvests. It was noted that surf redfish and lollyfish (Holothuria atra) are presently targeted for subsistence purposes, being eaten raw or cooked by gleaning fishers. In the interests of food security, this activity may delay the development of an export fishery.
•
Present densities of urchins, particularly Echinothrix spp., are high. Although these urchins stop the build-up of algae and are therefore useful in the system, they may also have a negative influence on incoming recruitment. Densities of coralivore starfish, such as the crown of thorns starfish, are not presently a concern to Nauru.
2.5
Overall recommendations for Nauru
The people of Nauru are going through difficult times with the current economic crisis, low wages and purchasing power for those with jobs, high fuel costs when fuel is available, and the need to put food on the table for themselves and their families. The increased focus on harvesting marine resources to address the food security issue has the potential to devastate inshore resources unless appropriate measures are put in place to ensure sustainable harvesting. The following recommendations are based on the CoFish survey work (socioeconomic, finfish and invertebrate) conducted in Nauru in October and November 2005, and anecdotal and published information that has been researched over the last 12 months. They are
45
2: Profile and results for Nauru provided to assist the Government of Nauru and its people to look to the future and the sustainable harvesting of marine resources. It is recommended that: •
the Government closely monitors the level of fishing effort for both finfish and invertebrates (through in-water assessment and socioeconomic surveys) and implements management measures affecting catch (e.g. size limits, total allowable catches of heavily exploited species) and fishing practices (e.g. gear types, mesh sizes);
•
specific management systems be considered essential to enable invertebrate stocks and heavily fished finfish stocks to build up, with the management regimes being controlled by communities at scales larger than the current village boundaries;
•
the Government considers establishing one or two marine protected areas (MPAs) that cover appropriate habitat (Reef ecology studies will need to be carried out to choose the best location for these MPAs. Also, there need to still be areas outside the MPAs where enough resources are available to enable people to fish for their family needs);
•
if the Government starts to implement management arrangements, preferably through communities, an awareness programme is implemented at the same time to allow people and communities to fully understand why the management measures are necessary and the need for community support if arrangements are to work successfully;
•
the Government looks to restrain SCUBA spearfishing, as the efficiency of this gear outweighs all the more traditional means of fishing, and if it is not properly controlled it will have a drastic effect on targeted fish stocks;
•
the abundant herbivorous Acanthuridae is sustainably targeted by local fishing activities instead of parrotfish, groupers, snappers and emperors which are probably being impacted by fishing activities at present;
•
the Government continues to foster development of offshore resources, more specifically tuna and other pelagics, to reduce fishing pressure on inshore resources;
•
the Government looks at ways to assist local fishers to fish for pelagics, e.g.: ○ encourage Nauruans to use motorised boats by improving access to fuel, and ○ put out shallow-water fish aggregating devices (FADs) that can be reached by fishers paddling non-motorised canoes, thus continuing the fishing practices of the I-Kiribati and Tuvaluan fishers who have departed from Nauru;
•
the Government considers strengthening development of the aquaculture sector (such as freshwater farming of milkfish) and looks at the possibility of mariculture of certain species, to expand options currently available from reef resources;
•
the Government has an assessment undertaken to look at the stocks of aquarium fish, with the harvesting of these encouraged through the private sector and appropriate management measures put in place if the stocks can be sustainably harvested and viably exported;
46
2: Profile and results for Nauru •
any additional survey work by SPC on invertebrates focuses on the species that are of most concern for Nauruan people and that are the main focus of current harvest activity, including an assessment of the status and population dynamics of Turbo spp. and nocturnal crustacean species (especially lobsters and crabs); and
•
the Government considers the introduction of Tridacna maxima, and possibly trochus adults, within an area protected from fishing and gleaning, possibly as part of an MPA as recommended above.
47
48
3: References 3.
REFERENCES
Adams, T. and E. Ledua. 1997. Inshore resources management and conservation: Current trends and alternate strategies. Paper prepared for the Eighth Pacific Science Association Inter-Congress Meeting, 13–19 July, Suva, Fiji. Integrated Coastal Fisheries Management Project, South Pacific Commission, Noumea, New Caledonia. Adams, T., J. Bell and P. Labrosse. 2000. Current status of aquaculture in the Pacific Islands. pp. 295–305. In: R.P. Subasinghe, P. Bueno, M.J. Phillips, C. Hough, S.E. McGladdery and J.R. Arthur (eds). Report of the Conference on Aquaculture in the Third Millennium, Bangkok, Thailand, 20–25 February 2000. NACA, Bangkok and FAO, Rome. ADB. 2000. Country assistance plan 2000–2002: Republic of Nauru. Asian Development Bank, Manila. ADB. 2001. Economic benefits from Pacific Island fisheries: Contributions to GDP, employment, nutrition, and exports. Asian Development Bank, Manila. ADB. 2005. Asian Development Outlook 2005: Part 2 – Economic trends and prospects in developing Asia. Asian Development Bank, Manila. Becker, W. and E. Helsing (eds). 1991. Food and health data: Their use in nutrition policymaking. World Health Organization Regional Office for Europe, Copenhagen. Bertram, G. 1999. The MIRAB model twelve years on. Contemporary Pacific 11(1): 105– 138. Bertram, I.G. and R.F. Watters. 1985. The MIRAB economy in South Pacific microstates. Pacific Viewpoint 26(3): 497–519. Chapman, L. 1998. Feasibility study on infrastructure requirements and vessel parameters for tuna longlining in Nauru, 17–22 November 1997. Capture Section Unpublished Report No. 29. South Pacific Commission, Noumea, New Caledonia. Chapman, L. 2004. Nearshore domestic fisheries development in Pacific Island countries and territories. Secretariat of the Pacific Community, Noumea, New Caledonia. Chapman, L., P. Watt, P. Wellington and P. Mead. 1998. Capture Section report of fish aggregating device (FAD) site surveys, construction and development assistance to the Republic of Nauru (4 April – 2 May 1990; 15–26 October 1991; 6–14 March 1993; 28 April – 2 May 1993; and 14–23 November 1997). Secretariat of the Pacific Community, Noumea, New Caledonia. CIA. 2007. The world factbook 2007: Nauru. Central Intelligence Agency, Washington DC. https://www.cia.gov/library/publications/the-world-factbook/geos/nr.html (accessed 17 October 2007). Clua, E., P. Legendre, L. Vigliola, F. Magron, M. Kulbicki, S. Sarramegna, P. Labrosse and R. Galzin. 2006. Medium scale approach (MSA) for improved assessment of coral reef fish habitat. Journal of Experimental Marine Biology and Ecology 333: 219–230.
49
3: References Connell, J. 2006. Nauru: The first failed Pacific State? The Round Table 95(383): 47–63. Cusack, P. 1987. Phosphate, FADs and fish. SPC Fisheries Newsletter 43: 34–40. Dalzell, P. 1992. A catch monitoring programme for Nauru’s coastal fisheries. SPC Fisheries Newsletter 62: 25–28. Dalzell, P. and A. Debao. 1994. Coastal fisheries production on Nauru. Inshore Fisheries Research Project Country Assignment Report. South Pacific Commission, Noumea, New Caledonia. English, S., C. Wilkinson and V. Baker. 1997. Survey manual for tropical marine resources. 2nd ed. Australian Institute of Marine Science, Townsville, Queensland. Evans, M. 2001. Persistence of the gift: Tongan tradition in transnational context. Wilfrid Laurier University Press, Waterloo, Canada. FAO. 2002a. Fishery country profile: Nauru. Food and Agriculture Organization of the United Nations, Rome. http://www.fao.org/fi/fcp/en/NRU/profile.htm (accessed 17 October 2007). FAO. 2002b. Information on fisheries management in Nauru. Food and Agriculture Organization of the United Nations, Rome. http://www.fao.org/fi/fcp/en/NRU/body.htm (accessed 6 June 2008). FAO. 2005. Strengthening coastal fisheries legislation and community-based fisheries management in the Micronesian sub-region, 2003–2005: Palau, RMI, Kiribati, Nauru, FSM. FAO Project TCP/RAS/2907. Food and Agriculture Organization of the United Nations, Rome. Gillett, R.D. and C. Lightfoot. 2002. The contribution of fisheries to the economies of Pacific Island countries: A report prepared for the Asian Development Bank, the Forum Fisheries Agency, and the World Bank. Asian Development Bank, Manila. Government of Nauru. 2004. Nauru social impact assessment. Government of Nauru. Gulland, J.A. 1983. Fish stock assessment: A manual of basic methods. Vol. 1. John Wiley & Sons, Chichester, New York. Hill, P.J. and G. Jacobson. 1989. Structure and evolution of Nauru Island, Central Pacific Ocean. Australian Journal of Earth Sciences 36: 365–381. Jacob, P. 2000. The status of coral reefs and marine resources of Nauru. Paper presented at International Coral Reef Initiative Regional Symposium, 22–24 May 2000, Noumea, New Caledonia. Jacob, P. and M. Depaune. 2001. Nauru country statement. Unpublished report submitted to 2nd Heads of Fisheries Meeting, 23–27 July 2001, Secretariat of the Pacific Community, Noumea, New Caledonia.
50
3: References Kronen, M., B. McArdle and P. Labrosse. 2006. Surveying seafood consumption: A methodological approach. South Pacific Journal of Natural Science 24: 11–19. Kulbicki, M. and S. Sarramegna. 1999. Comparison of density estimates derived from strip transect and distance sampling for underwater visual censuses: A case study of Chaetodontidae and Pomacanthidae. Aquatic Living Resources 12: 315–325. Kulbicki, M., Y. Letourneur and P. Labrosse. 2000. Fish stock assessment of the northern New Caledonian lagoons: 2 – Stocks of lagoon bottom and reef-associated fishes. Aquatic Living Resources 13: 77–90. Labrosse, P., M. Kulbicki and J. Ferraris. 2002. Underwater visual fish census surveys: Proper use and implementation. Secretariat of the Pacific Community, Noumea, New Caledonia. Letourneur, Y., M. Kulbicki and P. Labrosse. 1998. Length–weight relationships of fish from coral reefs and lagoons of New Caledonia, southwestern Pacific Ocean: An update. Naga 21(4): 39–46. Lodge, M.W. 1992. Republic of Nauru: Review of the Marine Resources Act 1978 and advice on the future regulation of fisheries in Nauru: Preliminary report. Forum Fisheries Agency, Honiara. Nauru Fisheries & Marine Resources Authority. 2005. Nauru Aquaculture Development Plan, 2005–2010. Nauru Fisheries & Marine Resources Authority. Petit-Skinner, S. 1995. The Nauruans. 2nd rev. ed. MacDuff Press, San Francisco. Republic of Nauru. 1997. Republic of Nauru Fisheries and Marine Authority Act 1997. Republic of Nauru. 2005. Nauru National Sustainable Development Strategy 2005–2025: Partnerships for quality of life. Small, C.A. and L.D. Dixon. 2004. Tonga: Migration and the homeland. Migration Policy Institute, Washington DC, http://www.migrationinformation.org/Profiles/display.cfm?ID=198/ (accessed 17 October 2007). Sokimi, W. 2005. Technical assistance on tuna longlining and fish skills workshop provided to the Nauru Fisheries Corporation and the Nauru Fisheries and Marine Resources Authority. Fisheries Development Section Field Report No. 28. Secretariat of the Pacific Community, Noumea, New Caledonia. Sokimi, W and L. Chapman. 2001. Small-scale tuna longlining assistance and training for the Republic of Nauru (5–31 October 2000). Fisheries Development Section Field Report No. 8. Secretariat of the Pacific Community, Noumea, New Caledonia.
51
3: References Sokimi, W. and L. Chapman. 2002. Technical assistance to the Republic of Nauru to provide training in mid-water fishing techniques that can be used in association with fish aggregating devices (FADs) (14 February – 25 May 2002). Fisheries Development Section Field Report No. 16. Secretariat of the Pacific Community, Noumea, New Caledonia. SOPAC. 2005. Oceans and Islands Programme for Nauru 2005. Pacific Islands Applied Geoscience Commission, Suva. South, R. and P. Skelton. 2000. Status of coral reefs in the Southwest Pacific: Fiji, Nauru, New Caledonia, Samoa, Solomon Islands, Tuvalu and Vanuatu. pp. 159–180. In: Wilkinson, C. (ed.). Status of coral reefs of the world: 2000. Australian Institute for Marine Science, Townsville, Queensland. SPC. 1984. An assessment of the skipjack and baitfish resources of Nauru. Skipjack Survey and Assessment Programme Final Country Report No. 13, South Pacific Commission, Noumea, New Caledonia. SPC. 1994. The present status of coastal fisheries production in the South Pacific Islands. Working Paper 8, 25th Regional Technical Meeting on Fisheries, South Pacific Commission, Noumea, New Caledonia. SPC. 2006. Demographic statistics. Secretariat of the Pacific Community, Noumea, New Caledonia. http://www.spc.int/demog/en/index.html (accessed 17 October 2007). Thaman, R.R. and D.C. Hassall. 1998. Republic of Nauru: National Environmental Management Strategy and National Environmental Action Plan. South Pacific Regional Environment Programme, Apia, Samoa. Tuara, P. 1998. An assessment of the role of women in fisheries in the Republic of Nauru. Secretariat of the Pacific Community, Noumea, New Caledonia. Williams, M. and B. MacDonald. 1985. The phosphateers. Melbourne University Press, Carlton, Victoria, Australia. WorldFish Center et al. 2000. FishBase. http://fishbase.org/home.htm (accessed 17 October 2007).
52


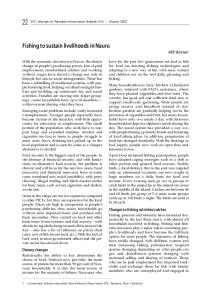


![GCSAA Energy-Profile-Report[1].pdf](https://p.pdfkul.com/img/300x300/gcsaa-energy-profile-report1pdf_5aff4b988ead0e1f258b4616.jpg)


