PHYSICAL REVIEW E 66, 021905 共2002兲
Morphological characterization of in vitro neuronal networks Orit Shefi,1,2 Ido Golding,1,* Ronen Segev,1 Eshel Ben-Jacob,1 and Amir Ayali2,† 1
School of Physics and Astronomy, Raymond & Beverly Sackler Faculty of Exact Sciences, Tel-Aviv University, Tel-Aviv 69978, Israel 2 Department of Zoology, Faculty of Life Sciences, Tel-Aviv University, Tel-Aviv 69978, Israel 共Received 25 February 2002; revised manuscript received 20 May 2002; published 14 August 2002兲 We use in vitro neuronal networks as a model system for studying self-organization processes in the nervous system. We follow the neuronal growth process, from isolated neurons to fully connected two-dimensional networks. The mature networks are mapped into connected graphs and their morphological characteristics are measured. The distributions of segment lengths, node connectivity, and path length between nodes, and the clustering coefficient of the networks are used to characterize network morphology and to demonstrate that our networks fall into the category of small-world networks. DOI: 10.1103/PhysRevE.66.021905
PACS number共s兲: 87.10.⫹e, 87.17.⫺d
I. INTRODUCTION
One of the most profound questions in science is how a collection of elements self-organize to form new and extremely complex systems 共关1兴 and references therein, 关2,3兴兲. This question becomes far more challenging when talking about biological systems, where the building blocks themselves are living entities 关4兴. In the case of the nervous system this issue translates to the open question of how a functioning neuronal network 共a small circuit as well as a complex brain兲 emerges from a collection of single entities, the individual neurons 关5–9兴. As in networks in general, there is a strong relation between the neuronal network structure, or ‘‘wiring diagram,’’ and its function, i.e. the form-function relation 关10兴. This enables determination of the dynamics and activity of a network by analyzing its morphology and topology of connectivity. An attempt in this direction has been recently made by Watts and Strogatz in introducing their ‘‘small-world networks’’ concept 关10–13兴. A small world network is one that interpolates between the two extreme cases of a regular lattice, on the one hand, and a random graph, on the other. It is characterized by a local neighborhood, which is highly clustered 共as in regular lattices兲, and by a short path length between vertices 共as in random networks兲. Watts and Strogatz state that small-world characteristics are a prevalent feature of real life biological networks. Yet, so far, only a few such systems have been examined experimentally. These include metabolic networks in various organisms 关14兴, as well as the large-scale organization of metabolic networks 关15兴, and the nervous system of the worm Caenorhabditis elegans 关11兴. We are presently studying two-dimensional in vitro neuronal networks. While these cultured networks lack some features of in vivo neuronal networks, they retain many others 共 关16兴 and references therein兲. They develop organotopic *Present address: Department of Molecular Biology, Princeton University, Princeton NJ 08544-1014. † Corresponding author. Fax: 972-3-6409403. Email address:
[email protected] 1063-651X/2002/66共2兲/021905共5兲/$20.00
synaptic connections and exhibit a rich variety of electrical properties similar to those observed in vivo. The twodimensional system enables easy access for noninvasive optical observations, allowing us to follow the dynamics of neuronal growth and network organization. In addition, our use of invertebrate 共locust兲 cells is advantageous due to the large size of the neurons and the ease with which they can be cultured under various conditions 关2,8,10,17–21兴. All the above, together with recent progress in multielectrode array technology, optical imaging, and fluorescence microscopy, make invertebrate cultured neuronal networks a favorable model system for studies of neuronal networks and the nervous system. In our culture preparations, fully differentiated adult neurons, which lose their dendrites and axon during dissociation, regenerate neurites that interconnect to form an elaborate network. During the growth process, growth cones connect to nonself, as well as self previously extended neurites, with no clear evidence for self-avoidance 共see Fig. 1兲. It appears that the cultured neurons cannot be considered as simple elements; even the single isolated cell shows spontaneous electrical activity and forms a complex morphological structure. Neuronal systems can be modeled as networks or graphs of coupled systems, where the vertices represent the elements of the system, and the edges represent the interactions between them. Once in the framework of a wired graph, one
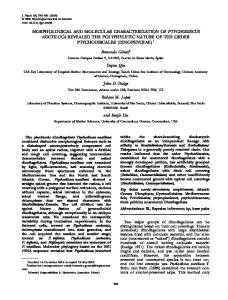
FIG. 1. A single cultured neuron, two days after plating. The neurites outgrow from the round soma, branch and connect to other neurites extending from the same cell. Scale bar ⫽ 50 .
66 021905-1
©2002 The American Physical Society
PHYSICAL REVIEW E 66, 021905 共2002兲
SHEFI, GOLDING, SEGEV, BEN-JACOB, AND AYALI
FIG. 2. A part of a mature 6-day-old network. At this stage all the neurons in the network are connected to each other. The neurites are straight segments that show high tension along the processes between junctions. The junction points appear to be more firmly attached to the substrate than are the neurites that connect them. Scale bar ⫽ 50 .
can apply the mathematical tools of graph theory to analyze the system under study and to look for universal, generic features that are common to different kinds of networks within as well as outside the nervous system. As a first step we needed to define vertices and edges in our system. According to the ‘‘neuron paradigm’’ the building blocks of the nervous system are the neurons 共vertices兲 and synapses 共edges兲. However, based on the branching and growth process of the cultured networks, we chose the neurons, the synapses, and synapselike connections between the neurites of the same neuron, to be the vertices. Our main working assumption was that these structures are essential for information processing in the network. In this work we describe the results for three different neuronal networks grown in culture under controlled conditions. These networks are characterized by a high clustering coefficient compared to random graphs, and a path length that is closer to random networks than to regular ones. We thus classify the studied neuronal networks as small-world networks. II. GROWTH OF THE NEURONAL NETWORK
Cell cultures. Neurons were dissociated from the frontal ganglion of adult locusts and maintained under controlled conditions. Culturing method followed Shefi et al. 关2兴. Plated neurons varied in size from 10 m to 50 m. The number of ganglia per dish determined the density of the culture, and thus the average distance between cells. A charge coupled device camera mounted onto a phase contrast microscope was used to acquire images of the cul-
FIG. 3. Illustration of the points considered as vertices in the networks: numbers 1 and 8 are somata of neurons and numbers 2–7 are connection points between neurites. In the adjacency matrix pairs of vertices that are connected as 1-2, 2-3, 3-4, 4-5, 5-6, 5-7, etc. obtain the value 1 while the nonconnected pairs obtain the value 0.
tured neurons and networks into a PC for image processing analysis. Growth process. Time-lapse observations on the growth process of cultured neurons revealed that the most intense stage of development was between day 1 and day 5. After this rapid growth stage there was a pronounced decrease in growth rate 关2,3兴. By day 6 in culture most of the neurons had developed interconnections and were already a part of an elaborate network 共Fig. 2兲. Hence, we analyzed the network at that point. During the growth process, growth cones connected not just to neighbor cells but also to neurites previously extended from their own cell body, with no evidence for selfavoidance. They thereby formed close loops. The junctions or interconnection points acted as anchors that seemed to be more firmly attached to the substrate than the neurites themselves. Tension was generated along the neurites as they stretched between these anchors to form straight segments, giving the close loops polygonal shapes 共Figs. 1 and 2兲. Connectivity statistics was found to change significantly with the age of the single neuronal cell in culture and the developmental stage of the network as a whole 关2兴. After the initial stage of intense neurite formation, the neuronal cell bodies started to aggregate into packed clusters. The clustering of cells was accompanied by absorption of branches and even whole neurites, together with rearrangements of neurites and what appeared to be fusion of parallel ones. The somata were observed to migrate along newly formed bundles toward one another. Thus, relatively homogenous cultures, in which single neurons were scattered, evolved into cultures organized into a few centers comprised of clusters of neurons connected by thick nervelike bundles 关2,22兴.
021905-2
PHYSICAL REVIEW E 66, 021905 共2002兲
MORPHOLOGICAL CHARACTERIZATION OF IN VITRO . . .
FIG. 4. Distribution of the physical lengths of connecting segments in network number 3 共240 nodes, 290 segments兲. Horizontal axis is log10 of segment length 共measured in micrometers兲. Vertical axis is the normalized frequency of occurrence. Note the bimodality of the distribution in log space, and the apparent symmetry of the long-segments distribution. III. MORPHOLOGY ANALYSIS
Abstraction process. We took a static snapshot of the evolving networks structure at a particular time point, day 6 in culture, on which the networks demonstrate maximum interconnections between neurites. We mapped the neuronal network into a simple graph using the following assumptions 共see Fig. 3兲. 共1兲 All vertices are identical. 共2兲 All edges are identical. That is, we ignored edge length, the possibility that different edges have different synaptic efficacies and/or edges directionality. 共3兲 We ignored edge multiplicity, i.e., we considered only whether vertices were adjacent or not. Physical properties of the networks. Our main findings obtained for three 6-day-old networks cultured and grown under the same conditions are summarized in Table I. Before taking the graph theory approach and describing the networks as simple labeled graphs 共which are devoid of any physical properties兲, we examine in further detail the statistics obtained for one network, the largest of the three 共netTABLE I. Descriptive parameters measured for three 6-day-old neuronal networks, cultured and grown under controlled conditions: n, number of nodes; ¯k , average node connectivity, ¯l , characteristic path length. Values for a regular ring graph (l reg ⫽n/2k) and a random graph are also given for comparison. c rand and l rand are calculated for ten numerically generated random graphs with the same parameters as the corresponding studied network. Net
n
¯k
l reg /l/l rand
c/c rand
1
104
2.33
22.35/11.03/4.88⫾.28
0.092/.017⫾.010
2
140
2.62
26.70/9.66/4.82⫾.12
0.129/.016⫾.010
3
240
2.38
50.53/17.58/5.90⫾.13
0.113/.009⫾.007
FIG. 5. Distribution of the node connectivity in network number 3 共240 nodes, 290 connections兲. Horizontal axis is k, the number of nodes to which each node is connected. Vertical axis is the normalized frequency of occurrence. ¯k ⫽2.38.
work number 3 in Table I, with 240 nodes and 290 edges兲. Distribution of the measured lengths between all pairs of nodes on a semilogarithmic scale is shown in Fig. 4. The bimodal distribution, with the majority of the samples at the lower end of the distribution 共short segments, r⬃10 m), and the remaining samples distributed in a symmetrical manner in the log space between ⬎101 and 102.5 m (10–300 m), is typical for networks with spatially clustered structures 关22兴. Mapping of the network into a graph. The neuronal network is described as labeled graph G. Such a graph can be described solely by its adjacency matrix A(G) 关23兴. This symmetric matrix is defined as follows: Let the nodes of G be labeled v 1 , v 2 , . . . , v n . The Adjacency Matrix A⫽a i, j of G is a binary matrix of order n, with
ai j⫽
再
1 if v i and v j are joined by an edge 共i.e., adjacent, or neighbors兲
共1兲
0 otherwise.
For each of the networks under study, A(G) is constructed by manually labeling all nodes and marking all connected pairs 共see Fig. 3兲. The properties of the adjacency matrix facilitate calculation of all of the required characteristics of the graph 共see below兲, through simple algebraic manipulations. In particular, we stress the following important property 关23兴: If G is a labeled graph with adjacency matrix A, then the (i, j) element of A l is the number of walks of length l from v i to v j . Node Connectivity. The degree k of a vertex is the number of other vertices to which it is directly connected 共⫽adjacent兲. For each vertex v i ,k is obtained by adding up the elements in row 共or column兲 i in A(G). The distribution of k values for network 3 is depicted in Fig. 5. The average connectivity is ¯k ⫽2.38. It can be seen that the network has a
021905-3
PHYSICAL REVIEW E 66, 021905 共2002兲
SHEFI, GOLDING, SEGEV, BEN-JACOB, AND AYALI
FIG. 6. Distribution of the path length values in network number 3 共240 nodes, 290 connections兲. Horizontal axis is the path length, i.e., the number of edges in the shortest path between two nodes. Vertical axis is the normalized frequency of occurrence. ¯l ⫽17.58.
pronounced scale of connectivity. That is, it is far from being ‘‘scale free,’’ a feature claimed to be common among ‘‘realworld’’ networks 关24兴. However, as Amaral et al. have shown 关25兴, the node connectivity of various networks 共real as well as manmade兲 can exhibit either scale-free, broad scale or single scale statistics. Path length. The path length l between v i and v j is defined as the number of edges included in the shortest path between v i and v j . The characteristic path length ¯l of the graph G is l averaged over all pairs of vertices. The distribution of path length values in network 3 is shown in Fig. 6. The characteristic path length of the corresponding graph is ¯l ⫽17.58. Clustering coefficient. Another important parameter in the context of small-world networks is the clustering coefficient of the graph. The clustering coefficient of vertex v , C( v ), is defined as the number of edges among the k v neighbors of v 共⫽adjacent vertices兲, divided by the maximal number of such edges, k v (k v ⫺1)/2. Thus, C( v ) 共which is in the range 关0–1兴兲 measures the ‘‘cliquishness’’ of the neighborhood of v , i.e., what fraction of the vertices adjacent to v are also adjacent to each other. By extension, the clustering coeffi¯ , is the average of C( v ) over all cient of the graph G, C ¯ ⫽0.113. vertices. For network 3 we obtain C Small-world test. Using the results presented in Table I, we can now attempt to test whether our in vitro neuronal networks fall into the category of small-world networks. For this purpose, the table contains a comparison to two benchmark cases: a random graph and a regular graph 关11兴, with the same number of nodes n and average connectivity ¯k as the network under study. The formal definition of a smallworld network requires that such a network satisfies 共1兲 ¯ ⰇC random (C random ⬃k/n), that is, a small-world netC work is much more highly clustered than the corresponding random graph and 共2兲 l regular Ⰷ¯l ⭓l random , i.e., the characteristic free path of a small-world network is close to that of a random graph, and much smaller than that of a regular graph. Specifically, ¯l should scale as
FIG. 7. 共a兲 Average path length of the neuronal networks studied 共filled dots兲, compared to the prediction of random graph theory 关 l rand ⫽ln(N)/ln(具k典, solid line兴 and regular graphs 关 l reg ⫽n/2k, open triangles兴. Data for our networks are also compared to other real networks 共open dots, data taken from Albert and Barabasi 关26兴, Table I兲. 共b兲 The network’s clustering coefficient compared to the prediction of random graph theory (c rand ⫽ 具 k 典 /N), and other real networks 关26兴 关symbols as in 共a兲兴.
ln(n)/ln(k), rather than as n/2k.1 A comparison between the average path length and clustering coefficient of our three networks and various real networks 共following Albert and Barabsi 关26兴兲, with the theoretical values for random and regular graphs, is presented in Fig. 7. It can be seen that our three networks fall within the
1 One should note that a random graph with the same n and ¯k as our networks will not, in general, be fully interconnected. The characteristic path length for such a graph corresponds only to connected subgraphs. The fact that our graphs are completely connected at these parameter values is, of course, a feature that distinguishes them from random graphs.
021905-4
PHYSICAL REVIEW E 66, 021905 共2002兲
MORPHOLOGICAL CHARACTERIZATION OF IN VITRO . . .
‘‘cloud’’ of real-world networks. As presented in Table I, the clustering coefficient is indeed much higher 共5–13 times兲 than that of the corresponding random graphs. The data do not allow us to verify that ¯l scales as ln(n)/ln(k) but the characteristic path length is closer to l random than to l regular , as in small-world networks. IV. DISCUSSION
During development of the nervous system, two opposing forces impose the morphology of the evolving neuronal networks. On the one hand, single neurons grow axons and highly branched dendritic trees in order to achieve maximum interconnected networks. This enables efficient information flow, and adds to the strength of the networks as computational units. On the other hand, developing extended and vastly branched neurites has a high energetic cost. Hence, the final structure of the neuronal network is a consequence of the interplay between these factors. One category of networks that could be the result of such competition is smallworld networks, combining fast information transmission with maximal economy in wiring length 共energetic cost兲. We studied in vitro two-dimensional neuronal networks generated by culturing neurons dissociated from locust ganglia. The in vitro networks were mapped onto graphs where the vertices represent the elements of the system and the edges represent the interactions between them. We examined our networks at the stage where they were practically fully connected. In order to determine whether the networks fall
关1兴 S.R. Quartz and T.J. Sejnowski, Behav. Brain Sci. 20, 537 共1997兲. 关2兴 O. Shefi, E. Ben-Jacob, and A. Ayali, Neurocomputing 44–46, 635 共2002兲. 关3兴 A. Ayali, O. Shefi, and E. Ben-Jacob, Experimental Chaos 共Springer-Verlag, Berlin, in press兲. 关4兴 E. Ben-Jacob, Nature 共London兲 415, 370 共2002兲. 关5兴 G.J. Goodhill, Trends Neurosci. 21, 226 共1998兲. 关6兴 R. Segev and E. Ben-Jacob, Adv. Complex Syst. 1, 67 共1998兲. 关7兴 R. Segev and E. Ben-Jacob, Phys. Lett. A 237, 307 共1998兲. 关8兴 C. Wilkinson and A. Curtis, Phys. World 12共9兲, 45 共1999兲. 关9兴 R. Segev and E. Ben-Jacob, Neural Networks 13, 185 共2000兲. 关10兴 S.H. Strogatz, Nature 共London兲 410, 268 共2001兲. 关11兴 D.J. Watts and J. Duncan, Small Worlds: The Dynamics of Networks Between Order and Randomness 共Princeton University Press, Princeton, NJ, 1999兲. 关12兴 D.J. Watts and S.H. Strogatz, Nature 共London兲 393, 440 共1998兲. 关13兴 N. Mathias and V. Gopal, Phys. Rev. E 63, 021117 共2001兲. 关14兴 A. Wagner and D.A. Fell, Proc. R. Soc. London, Ser. B 268,
within the small-world regime, we calculated the clustering coefficient and path length of each network and compared these parameters to random and regular graphs with the same n and ¯k . For the three networks tested, the clustering coefficients were indeed much higher than those of the corresponding random graphs, and the characteristic path lengths were closer to l random than to l regular . According to this test, the networks can be classified as small-world networks. Distribution of the lengths of segments connecting the nodes in our networks is typical to networks with a spatially clustered structure. This becomes very apparent as the networks mature. The culture goes through a dynamical process, starting with single entities, continues to a fully connected network, and finally develops to cultures organized into a few centers comprised of groups of neurons connected by thick nervelike bundles. The latter can be characterized by efficient information transmission together with tight and thrifty structure, the features of a small-world network. The growing process that was observed in our twodimensional cultures serves to demonstrate the selforganization process that leads to the characteristic structure of the nervous system in vivo: concentrations of neuronal cell bodies, namely, ganglia, interconnected by nerve tracts. ACKNOWLEDGMENTS
We are grateful to Paul Meakin, Daniel Rothman, and Peter Dodds for their useful advice.
1803 共2001兲. 关15兴 H. Jeong, B. Tombor, R. Albert, Z.N. Oltval, and A.L. Barabasi, Nature 共London兲 407, 651 共2000兲. 关16兴 S.M. Potter, Prog. Brain Res. 130, 49 共2001兲. 关17兴 C. Koch and G. Laurent, Science 284, 96 共1999兲. 关18兴 J.L. Leonard, Brain Behav. Evol. 55, 233 共2000兲. 关19兴 R.C. Cannon, H.V. Wheal, and D.A. Turner, J. Comp. Neurol. 413, 619 共1999兲. 关20兴 A. Kawa, M. Stahlhut, A. Berezin, E. Bock, and V. Berezin, J. Neurosci. Methods 79, 53 共1998兲. 关21兴 P. Kloppenburg and M. Horner, J. Exp. Biol. 201, 2529 共1998兲. 关22兴 R. Segev, Y. Shapira, M. Benveniste, and E. Ben-Jacob have seen similar results in rat cortical cells 共unpublished兲. 关23兴 F. Buckley and F. Harary, Distance in Graphs 共AddisonWesley, Redwood City, CA, 1990兲. 关24兴 A.L. Barabasi and R. Albert, Science 286, 509- 共1999兲. 关25兴 L.A.N. Amaral, A. Scala, M. Barthelemy, and H.E. Stanley, Proc. Natl. Acad. Sci. U.S.A. 97, 11 149 共2000兲. 关26兴 R. Albert and A.L. Barabasi, Rev. Mod. Phys. 74, 47 共2002兲.
021905-5