Journal of
MOLECULAR STRUCTURE ELSEVIER
Journal of Molecular Structure 405 (1997) 231-238
Twisted intramolecular charge transfer of dimethylaminobenzonitrile in micellar environments A way to look at the orientation of the probe within the apolar microenvironment Santi Kundu, Souvik Maity, Subhas Chandra Bera, Nitin Chattopadhyay* Department of Chemistry Jadavpur Universi~,, Calcutta-700 032, India
Received 6 June 1996; revised 16 September 1996; accepted4 October 1996
Abstract
Twisted intramolecular charge transfer (TICT) ofp-N,N-dimethylaminobenzonitrile (DMABN) in the photoexcited state has been studied in aqueous cetyl trimethylammonium bromide (CTAB, cationic) and sodium dodecyl sulphate (SDS, anionic) micellar solutions. The TICT process is found to be affected by the surface charge of the micellar aggregates. A comparative study of the enhancement of the TICT and the locally excited (LE) or non-polar (NP) emission yields in the two micellar solutions establishes that the probe (DMABN) resides within the micellar environment keeping the dimethylamino group at the micellar periphery and the other end deep in the micellar core. Multiple CMCs for both the micellar systems have been reported. © 1997 Elsevier Science B.V. Keywords: TICT; DMABN; Micelle; Microenvironment; CTAB, SDS
I. Introduction
Twisted intramolecular charge transfer (TICT) phenomenon, though discovered only in early seventies, has received immense attention due to its potential importance in diverse fields [1-21]. A major part of the recent solution phase studies of this excited state photoprocess involves fluorophores embedded within different cyclodextrin (CD) cavities [13-21]. The objective of these studies are principally: (i) to understand the microenvironment of the CD cavity
* Corresponding author.
[13] and (ii) the influence of the microenvironment of the CD on the TICT photophysics [14-21]. The latter is intended mainly to explore which of two factors, namely the polarity of the medium and the rigidity imposed by the microenvironment, actually governs the TICT process. While Lyapustina et al. have suggested that TICT state formation is restricted mainly through spacial restriction [11], other groups suggest that the process is controlled exclusively by the polarity of the microenvironment [5-7,14-19]. During the TICT studies with fluorophores, such as dimethylamino compounds, embedded within the cyclodextrin cavities it is always presumed that the probe molecule is positioned in a fashion that
0022-2860/97/$17.00 Copyright © 1997 Elsevier Science B.V. All rights reserved PH S0022-2860(96)09596-8
232
S. Kundu et al./Journal of Molecular Structure 405 (1997) 231-238
the dimethylamino (DMA) group resides at the periphery of the CD environment and the other end points towards the core of the CD cavity [5,14-19]. Because of the internal charge transfer (ICT) in the excited state the TICT species acquires a positive charge on the DMA group and a negative charge on the other end (or, to some extent, on the phenyl structure). However, since cyclodextrins are basically sugar moieties, possessing no surface charge at the periphery, one cannot take advantage of the charge separation within the probe during the excited state process and, thus, there is no way to establish whether the DMA end protrudes through the periphery or is within the CD core. Aqueous micelles can, however, serve as a deterministic tool for the purpose since they can have different surface charge characteristics depending on the specific surfactant. Cetyl trimethylammonium bromide (CTAB) and sodium dodecyl sulphate (SDS) surfactants form micelles in aqueous solutions, the former possessing a positive charge and the latter a negative charge at the micellar surface. The core environment, however, is very similar in both micelles, since the hydrophobic ends of both the surfactants are long unbranched aliphatic hydrocarbon chains. The different surface charge nature of the micelles has been shown to affect the excited state photoprocesses in typical ways. Thus, while CTAB favours the deprotonation of carbazole in the excited state proton transfer (ESPT) reaction through the stabilisation of the photoproduct; SDS inhibits the process owing to the destabilisation of the photoproduct [22]. In a similar way, the TICT state of a fluorophore is stabilised differently in the two specified micellar environments, depending on the absolute orientation of the probe in the micellar aggregates; resulting in favouring or inhibition of the excited state process. The present communication reports a comparative study of the TICT emission yield of dimethylaminobenzonitrile (DMABN) in aqueous CTAB and SDS micellar environments to explore how the fluorophore moiety resides within the micellar units. As an additional outcome of the present study we arrive at multiple critical micellar concentrations (CMCs) for the two micellar systems. Two CMCs for CTAB micelle and three for SDS have been observed. Although double CMCs for aqueous CTAB has already been reported by our group in a
recent report [23], a new CMC i for SDS system, much lower than the literature values, has been reported here, for the first time, and the two CMCs reported previously for the SDS micellar system have been ascribed to the second and third CMCs.
2. Experimental 2.1. Materials
DMABN (Aldrich) was purified by vacuum sublimation followed by recrystallisation from 90% ethanol. The purity of the compound was checked from the spectroscopic methods as well as from TLC where it gave only a single spot. Anthracene, used for the estimation of the quantum yields, was purified through the same procedure. Cetyl trimethylammonium bromide (CTAB) and sodium dodecyl sulphate (SDS) (both Aldrich) were recrystallised from water before use. Triply distilled water was used for the preparation of solutions. The solutions were prepared just before the experiments to avoid aging of micelles [24]. The experimental temperature was 26°C throughout. 2.2. Measurements
Shimadzu MPS 2000 absorption spectrophotometer and Spex fluorolog spectrofluorimeter were used for recording the absorption and emission spectra respectively. Quantum yields of the LE and the TICT emissions were estimated with respect to a standard anthracene solution in benzene. The areas under the emission bands were calculated through the provisions under the software DM3000F supplied by Spex. Lifetimes of the excited species were measured adopting the time correlated single photon counting (TCSPC) technique. The instrumentation has been described elsewhere [17,18].
3. Results and discussion 3.1. Probable orientation o f the probe in micellar units
The absorption spectrum of an aqueous DMABN solution (1 x 10 -5 M) shows a broad and unstructured
S. Kundu et al./Journal of Molecular Structure 405 (1997) 231-238
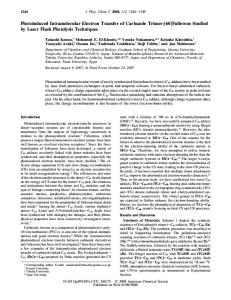
low energy band with maximum at around 300 nm. The spectrum hardly differs from the absorption spectra of the probe in aqueous CTAB and SDS micellar solutions. The emission spectrum of the aqueous DMABN solution (1 x 10 -5 M) consists of two distinct bands ascribed to the locally excited (LE) or non-polar (NP) (high energy band) and TICT (low energy band) states. The quantum yields of both the emissions are, however, extremely low [5,14,15,25]. This has been ascribed to the large stabilisation of the highly polar TICT state and consequent rapid non-radiative transitions to ground and/or low lying triplet states through this charge transfer state. Fig. 1 depicts the fluorescence spectra of DMABN in aqueous CTAB and SDS micellar solutions as a function of surfactant concentration. With the increase in the surfactant concentration, in the aqueous solution, intensities of the LE as well as the TICT bands increase with a hypsochromic shift for both the emissions. However, the shift is much greater for the low energy band than for the NP emission, reflecting a larger dipole moment associated to the TICT species. The blue shift for the emission bands is indicative of the inclusion of the fluorophore, DMABN, within the micellar environment and dictates that the microenvironment within the micellar aggregates is appreciably less polar than the bulk water. It is interesting to note that the hypsochromic shifts of each of the LE (550 cm -~) and TICT (1050cm -l) emissions are same in both CTAB and SDS solutions (Table 1) indicating that the polarity within the micellar aggregates is very similar for both the micelles, consistent with the fact that the hydrophobic ends of both CTAB and SDS are very similar, being unbranched aliphatic hydrocarbon chains. Apart from the hypsochromic shift in the micellar solutions, the fluorescence spectra show a drastic change in the emission intensities. The emission yields of both the bands increase appreciably as and
233
when the fluorophore is included in the micellar environment. This observation is true for both the micellar systems and can be rationalised from a reduction in the polarity within the micellar aggregations as compared to pure aqueous phase. A reduction in the polarity of the medium affects both the excited species, but in different ways. Because of the greater dipolar character, the TICT state gets more destabilised than the LE state in the less polar micellar environments. As a consequence, the energy of activation for the LE to TICT transition is increased [5], restricting the TICT formation and hence increasing the LE emission yield. As far as the TICT state is concerned, the polarity of the environment modifies the decay and the formation channels in quite opposite ways. In a highly polar solvent, such as water, although the formation of the TICT state is favoured, the stabilisation of the state is so great that, owing to the proximity of the stabilised TICT state and the low lying triplet/ground states, the nonradiative decay is favoured very much, resulting in a reduction in the TICT emission yield. Within the micellar environment the reduced polarity destabilises the TICT state, resulting in an increase in the energy gap between the TICT state and the triplet/ground states. According to the energy gap law this would lead to a reduction in the non-radiative decay and, hence, enhance the TICT emission. That the entire fluorophore is not buried in the non-polar core of the micellar aggregates is revealed from the increase in both the LE and TICT emissions; had it been dipped into the core, the extreme low polarity of the microenvironment would lead to an appreciable destabilisation of the TICT state and the resulting enhanced activation barrier would not permit TICT to be produced under the experimental condition. This is corroborated from the fact that TICT emission of DMABN is not found in non-polar solvents such as alkanes [5].
Table 1 Emission m a x i m a o f the LE and T I C T bands of D M A B N in aqueous C T A B and SDS micellar solutions Environment
Water C T A B micelle SDS micelle
Emission m a x i m a (nm)
Shift in emission m a x i m a (cm i)
LE
TICT
LE
TICT
360 353 353
520 493 493
550 550
1050 1050
234
S. Kundu et al./Journal of Molecular Structure 405 (1997) 231-238
"')
E+06 1
(~L~
310
(a)
t~O0
500
600
650
Wavelength (nm)
E+06 2.5 (vi~1 I
2.0 i
1.5 1.0 I
0.5 0 (b)
310
t,O0 500 Waveteng~h (nm) --"4--
I
I
650
Fig. I. Emission spectra of aqueous DMABN solution as a function of (a) CTAB and (b) SDS concentrations. Curves (i)-(vii) correspond to 0.0, 0.3, 0.5, 0.7, 1.0, 2.0 and 3.0 mM for (a), and 0.0, 4.0, 5.5, 8.0. 13.0, 17.0 and 23.0 mM for (b).
It is interesting to note the comparative enhancement of the LE and TICT emission yields of the fluorophore in CTAB and SDS micellar systems. As stated above, the intensity of both the LE and TICT bands increase with the increase in the surfactant
concentration. This is true for both CTAB and SDS micelles. It is clear from Fig. 2 that the enhancement in the LE emission yield is almost the same in both the micelles. This reflects, once again, a comparable polarity within the micellar environment.
S. Kundu et al./Journal of Molecular Structure 405 (1997) 231-238 I
I
I
I
!
15
3.5-
2.5-
t
7%
%
×
t
×uJ 1,5i.0~
T
(a)
o
I
I 0.5
I 1.0 [ C T A B ] (mM!
1 . 2,0
J,=
5#
I
I 3,0
~.0
=
•
~..5-
J
"~
3.52.5
I
I
I
,
I
I
•
•
17
~
3.'5
°
15
I1
J
2.5
%
x
9 " J 1,5 LO
(b)
8 [SDS]
12 (rnM)
16
20
T
2~
Fig. 2. (a) Enhancement of the LE and TICT emission yields of DMABNas a functionof CTABconcentration.Top portiondepicts the TICT/LEvariation. (b) Enhancementof the LE and TICTemission yields of DMABNas a function of SDS concentration. Top portion depicts the TICT/LEvariation. However, the situation is different for the TICT quantum yield and consequently for the TICT/LE ratio. As the figures indicate, the increase in the TICT emission yield of the fluorophore in SDS micelle is markedly higher than that in CTAB micelle
235
(comparison is taken at surfactant concentrations where TICT/LE becomes invariant to further addition of the surfactant). It is pertinent to mention here that both the TICT and LE band intensities, however, remain almost constant when the surfactant concentrations are below the respective C M C is. Thus, the difference in the fluorescence yield of the TICT band in the two micelles is simply a reflection of some difference in the nature of the micellar aggregates. However, it has already been established that the core environment of both the CTAB and SDS micelles are basically similar (the study could not be extended to non-ionic micellar systems since nonionic surfactants do not have hydrophobic ends similar to CTAB and SDS surfactants and because of the difference in the constitution of the surfactant, the core environment of the non-ionic micelles differs significantly from those of the micelles under study). So, the difference lies with the surface of the micellar units. Now, as we know that the nature of the surface charge is exactly opposite for the two systems studied, namely positive for CTAB and negative for SDS, this differential enhancement of the TICT emission in the two micellar solutions provides a way to establish the orientation of the fluorophore within the micellar units. That the fluorophore, DMABN, is not buried in the micellar core is reflected from the enhancement of the TICT emission (see above). A part of the probe is thus positioned at the micellar periphery protruding towards the aqueous (polar) phase. Now, there are two completely different possible orientations of the probe within the micellar environment. Either the dimethylamino (DMA) group is buried in the micellar core and the other end, i.e. -CN, is at the periphery; or the other way round. Because of the internal charge transfer (ICT) the TICT species is dipolar, the DMA group being the positive end and the - C N group (or, partly the aromatic ring) being the negative part. Had the fluorophore been oriented, within the micellar environment, in the former pattern, the negative (CN) pole would have been closer to the negatively charged surface of the SDS miceile resulting in a destabilisation of the TICT species making the situation unfavourable for the process as compared to that in CTAB micelle. A greater enhancement in the TICT emission yield in SDS system, however, opposes the situation and, thus, establishes that DMABN locates
236
S. Kundu et al./Journal of Molecular Structure 405 (1997) 231-238
itself within the micellar aggregates keeping the DMA end at the periphery and the other end within the core. The TICT state formed is stabilised by the negative charge of the SDS surface. There is, however, another possibility whereby the fluorophore, DMABN, can locate itself at the micelle-water interface in such a pattern that both its DMA and - C N ends are exposed to water. This type of alignment is ignored for the following reasons. Firstly, the polarity around the small probe, in this type of orientation, would have been marginally different from bulk aqueous phase. The large hypsochromic shift of the emission bands within the micellar solutions, however, reflects a drastic difference in the microenvironment, and thus contradicts it. Secondly, this orientation does not seem to produce a marked difference in the fluorescence yields of the low energy band in the two micelles as the TICT species is expected to be favoured comparatively by either of the surface charges for the two micellar systems. Further, the short lifetime of the species (1.8 ns for the TICT species in both the micellar environments) does not permit us to rationalise the findings from a difference in the rotational realignment of the excited species within the constrained micellar media. It is pertinent here to discuss the electrical influence of the Helmholtz layer on the probe molecule. The reasonably high electric field of the layer is expected, in principle, to orient the polar solute molecules, especially in the TICT state and to influence their energy levels. The experiment, however, does not show any appreciable influence as reflected from the very similar band positions in the two micellar solutions (CTAB and SDS). This reflects, in consistent with earlier reports, that the fluorophore is mostly buried within the micellar core and thus, the electric field of the Helmholtz layer becomes feeble to the probe and cannot exert its influence. The overall gradual blue shift of both the LE and the TICT emission bands, however, represents the net lowering of the polarity of the microenvironment around the probe taking into consideration all the electrical effects of the nearby layers together. One relevant point remains to be clarified: why does the TICT yield of DMABN increase in the CTAB micellar system where it is destabilised by the positive surface charge? As already discussed, the lowering of the polarity within the micellar
environment raises the energy level of the TICT state which, in turn, increases the energy gap between the TICT state and the low lying states through which the non-radiative transition proceeds. The accessible energy barrier for the formation of the charge transfer state and the appreciable suppression in the non-radiative decay channel for the same, together, predominate over the destabilisation of the TICT state by the CTAB micellar surface. Thus the fluorescence yield of the band in the micellar solution is increased. A lesser enhancement in the TICT fluorescence in the CTAB micelle compared with that in SDS system results from the difference in the stabilisation of the state as the other factors do not differ much in the two systems.
3.2. Estimation of CMCs The quantum yields of the individual TICT and LE emissions of DMABN as well as their ratio have been estimated with respect to a standard anthracene solution and plotted as a function of the surfactant concentrations in CTAB and SDS micellar solutions (Fig. 2). The graphical plots show several break points corresponding to the critical micellar concentrations (CMCs). The CMCs, thus obtained, are 0.25 and 1.0 mM for CTAB and 2.0, 6.0 and 15.0 mM for SDS micelles. The existence of double CMCs for CTAB and a triple CMC for SDS is, apparently, new. The former has, however, already been reported by us monitoring the ESPT reaction of carbazole [23]. The CMC values coming out of the present experiment agree with the earlier reported values [23] (Table 2). For the SDS system, however, the second and third CMCs obtained from the present experiment match with the literature values reported as the first and second CMCs of the system. A similar plot with three breaks has also been obtained for the same system from a recent excited state proton transfer (ESPT) study and the CMC values agree remarkably between the two experiments [26] (Table 2). Similar multiple breaks were also reported by Fadnavis and Engberts when they plotted the specific conductivity vs. SDS concentration [29]. The existence of a new CMCI at a much lower concentration of the SDS surfactant is closer to expectation rather than something unusual. In earlier reports [22,27], one finds that a gradual but rapid change in
S. Kundu et al./Journal of Molecular Structure 405 (1997) 231-238
237
Table 2 Estimation of CMCs for aqueous CTAB and SDS systems Surfactant
CTAB
SDS
EstimatedCMCs (mM) CMC L
CMC2
0.25
1.00
2.0
6.0
Literature CMCs (mM) CMC3
15.0
the photophysical and/or photochemical properties of the probe starts right from the beginning of the concentration axis. This is very unlikely. Unless micelles are formed (requiring attainment of the first CMC) and the fluorophore is subject to the micellar microenvironment, differing considerably from the bulk aqueous phase, the properties are expected to remain invariant (or to change extremely slowly) to the change in the surfactant concentration. Thus, a gradual but rapid change in the property of the probe, really means that the observer has actually overlooked and crossed the first CMC and searching for the higher CMCs. To our belief, this is the case with aqueous SDS system and based on the present observation and also from the ESPT study [26] we are confident to report that the existing literature CMCs of aqueous SDS system correspond to the second and third CMCs and the first CMC is 2 . 0 m M , which is considerably lower than the second CMC. We cannot, however, offer any interpretation regarding the multiple CMCs at the present stage. We believe that they reflect phase transformation, e.g. a change in the micellar shape and/or size etc, although Fadnavis [29] suggested the formation of mixed micelles. A thorough study focusing to the aggregation number, micellar size at and around the different CMCs can, hopefully, offer a better interpretation of the multiple CMCs.
4. Conclusion The experiment reveals the following points.
CMC i 0.25 0.75 0.82 0.22 0.25 0.98 1.5 5.0 5.3 3.5
CMC2 0.75 6.0 15.0 -
Reference CMC3 15.0 -
[231 [221 [271 [28] [27] [271 [261 [23] [27] [28]
1. The microenvironment within the CTAB and SDS micelles are much less polar than the bulk aqueous phase. 2. D M A B N resides within the micellar environment keeping its dimethylamino group at the micellar periphery and the other end into the core. 3. Aqueous CTAB micelle possesses two CMCs. 4. The actual CMCj for the aqueous SDS system is much below the literature CMC ~value for the system and the two existing CMCs correspond to the CMC2 and CMC3 respectively.
Acknowledgements Financial support from the Council of Scientific and Industrial Research, Government of India, is gratefully acknowledged.
References [1] K. Rotkiewicz, K.H. Grellmannand Z.R. Grabowski, Chem. Phys. Lett., 19 (1973) 315. [2] E. Lippert, W. Rettig, V. Bonacci-Koutecky,F. Heisel and J.A. Miehe, Adv. Chem. Phys., 68 (1987) 1. [3] W. Rettig, Angew.Chem., 98 (1986) 969; Angew.Chem. Int. Ed. Eng., 25 (1986) 971. [4] D. Huppert, S.D. Rand, P.M. Rentzepis, P.F. Barbara, W.S. Struve and Z.R. Grabowski,J. Chem. Phys., 91 (1981) 5714. [5] K. Bhattacharyyaand M. Chowdhury,Chem. Rev, 93 (1993) 507. [6] J.M. Hicks, M.T. Vandersall,Z. Babarozicand K.B. Eisenthal, Chem. Phys, Lett., 116 (1985) 18.
238
S. Kundu et al./Journal of Molecular Structure 405 (1997) 231-238
[7] J.M. Hicks, M.T. Vandersall, E.V. Sitzmann and K.B. Eisenthal, Chem. Phys. Lett., 135 (1987) 413. [8] J.D. Simon and S. Su, J. Phys. Chem., 92 (1988) 2395. [9] A.-D. Gorse and M. Pesquer, J. Phys. Chem., 99 (1995) 4039. [10] T. Soujanya, T.S.R. Krishna and A. Samanta, J. Photochem. Photobiol. A, 66 (1992) 185, [11] S.A. Lyapustina, A.V. Metelitsa, D.S. Bulgarevich, Y.E. Alexeev and M.I. Knyazhansky, J. Photochem. Photobiol. A, 75 (1993) 119. [12J A. Nag and K. Bhattacharyya, J. Photochem. Photobiol. A, 47 (1989) 97. [13] G.S. Cox, P.J. Hauptman and N.J. Turro, Photochem. Photobiol., 39 (1984) 597. [14] A. Nag and K. Bhattacharyya, Chem. Phys. Lett., 151 (1988) 474. [15] A. Nag, R. Dutta, N. Chattopadhyay and K. Bhattacharyya, Chem. Phys. Lett., 157 (1989) 83. [16] A. Nag and K. Bhattacharyya, J. Chem. Soc. Faraday Trans., 86 (1990) 53. [17] S. Kundu and N. Chattopadhyay, J, Mol. Struct., 344 (1995) 151,
[18] S. Kundu and N. Chattopadhyay, J. Photochem. Photobiol. A, 88 (1995) 105. [19] S. Kundu, S.C. Bera and N. Chattopadhyay, in preparation. [20] M. El Baraka, R. Garcia and E. Quinones, J. Photochem. Photobiol. A, 79 (1994) 181. [21] Yun-Bao Jiang, Spectrochim. Acta, 51A (1995) 275. [22] N. Chattopadhyay, R. Dutta and M. Chowdhury, Ind. J. Chem., 31A (1992) 512 and J. Photochem. Photobiol. A, 47 (1989) 249. [23] S. Kundu and N. Chattopadhyay, Chem. Phys. Lett, 228 (1994) 79. [24] H. Rau, J. Photochem., 39 (1987) 351. [25] E.M. Kosower and H. Dodiuk, J. Am. Chem. Soc., 98 (1976) 924. [26] (a) S. Kundu, Ph.D. Thesis, Jadavpur University, 1996; (b) S. Kundu and N. Chattopadhyay, to be published. [271 P. Mukerjee and K.J. Mysels, in Critical Micelle Concentrations of Aqueous Surfactant Systems, NBS, Washington, 1971. [28] T. Wolff, J. Colloid Interface Sci., 83 (1981) 658. [29] N. Fadnavis and J.B.J.N. Engberts, J. Am. Chem. Soc., 106 (1984) 2636.