Journal of Children and Poverty
ISSN: 1079-6126 (Print) 1469-9389 (Online) Journal homepage: http://www.tandfonline.com/loi/cjcp20
Effect of the imagination library on caregiver–child literacy interactions and school readiness: findings from two quasi-experimental propensity score studies Aaron M. Thompson, Heather Klemp & Anne E. Stinson To cite this article: Aaron M. Thompson, Heather Klemp & Anne E. Stinson (2016): Effect of the imagination library on caregiver–child literacy interactions and school readiness: findings from two quasi-experimental propensity score studies, Journal of Children and Poverty, DOI: 10.1080/10796126.2016.1187587 To link to this article: http://dx.doi.org/10.1080/10796126.2016.1187587
Published online: 16 Jun 2016.
Submit your article to this journal
View related articles
View Crossmark data
Full Terms & Conditions of access and use can be found at http://www.tandfonline.com/action/journalInformation?journalCode=cjcp20 Download by: [Aaron Thompson]
Date: 18 June 2016, At: 04:36
JOURNAL OF CHILDREN AND POVERTY, 2016 http://dx.doi.org/10.1080/10796126.2016.1187587
Effect of the imagination library on caregiver–child literacy interactions and school readiness: findings from two quasiexperimental propensity score studies Aaron M. Thompson, Heather Klemp and Anne E. Stinson School of Social Work, University of Missouri, Columbia, MO, USA
Downloaded by [Aaron Thompson] at 04:36 18 June 2016
ABSTRACT
The paper reports findings of two quasi-experimental, propensity score matched (PSM) studies on the effects of Imagination Library (IL). IL is a community book-distribution program targeting improved caregiver–child literacy interactions, which are hypothesized to lead to increased school readiness – consisting of improved emergent literacy skills and social-emotional school readiness. In Study One, interviews were used to examine proximal increases in the quality of child–caregiver literacy interactions with 112 PSM families (IL = 56; non-IL = 56). Small effects were observed in Study One favoring IL families on reading interactions (d = .043). In Study Two, 378 PSM kindergarten students (IL = 189; non-IL = 189) were compared with regard to standardized tests of emergent literacy skills and socialemotional school readiness – distal outcomes of IL. No effects were observed in Study Two. Taken together, these two studies run counter to prior reports on the effects of IL and suggest that more must be done to improve emergent literacy and school readiness beyond simply providing free books.
KEYWORDS
School readiness; emergent literacy; literacy interactions; propensity score
Literacy interactions start in the home and are predictive of school readiness – a concept that involves both emergent literacy skills and social-emotional school readiness (Webster-Stratton, Reid, and Stoolmiller 2008; Zins et al. 2007; Zins and Elias 2007). Emergent literacy readiness comprises the knowledge and skills influencing later development of formal reading and writing abilities (Dickinson and Tabors 2002; Lonigan and Whitehurst 1998). Social-emotional readiness encompasses the capacity of a child to self-manage and successfully negotiate the social interactions necessary for participation in classroom learning (Webster-Stratton, Reid, and Stoolmiller 2008). Research consistently reveals a strong positive association between high levels of early family literacy interactions and later advances in emergent literacy and social and emotional competencies (Ayoub, Vallotton, and Mastergeorge 2011; Bierman et al. 2008; Dodici, Draper, and Peterson 2003; Roggman et al. 2012). Though a child’s social-emotional development is influenced by a constellation of factors, a body of research findings consistently suggest that quality home literacy interactions have direct and significant associations with social, emotional, and behavioral CONTACT Aaron M. Thompson
[email protected]
© 2016 Informa UK Limited, trading as Taylor & Francis Group
Downloaded by [Aaron Thompson] at 04:36 18 June 2016
2
A. M. THOMPSON ET AL.
competencies in children (e.g. Dickinson and Tabors 2002; Hess and Holloway 1984; Kagan, Moore, and Bredekamp 1995). Each caregiver–child literacy interaction includes important social exchanges, whereby an adult promotes the understanding of printed text and connects the text to the child’s experiences. These didactic interactions between a child and caregiver provide opportunities for sharing, communication, listening, and formative feedback on social situations presented in the text (Doyle and Bramwell 2006). Home literacy interactions not only contribute to the child’s basic knowledge of the world and of social problem-solving strategies – but caregiver–child reading interactions facilitate increases in language development and communication skills (Payne, Whitehurst, and Angell 1994; Raz and Bryant 1990). Language and communication skills are central requirements for a child to successfully negotiate the social and emotional interactions they have at school (Zins et al. 2007). Upon arrival at school, children who are better equipped to understand and communicate their feelings are more successful at negotiating social problems, understanding their own and others’ feelings, directing their own and others’ behaviors, and regulating emotional responses to aversive events (Crick and Dodge 1996; Dodge and Godwin and Conduct Problems Prevention Research Group 2013; Kaiser et al. 2000). Despite the influence that caregiver–child reading interactions have on later emergent literacy skills and social-emotional development, national estimates suggest that twothirds of children enter US schools without the early literacy and social-emotional skills needed to be successful at school (Rampey, Dion, and Donahue 2009). Specifically, 10% of children are not socially, emotionally, and behaviorally prepared to start school (McLoyd 1998; Raver and Knitzer 2002), and approximately 27% of low-income youth demonstrate challenging behaviors at the start of school – with 6% demonstrating serious social-emotional problems (McLoyd 1998; Raver and Knitzer 2002). Research findings also suggest that children who grow up in poverty have fewer preschool literacy interactions, have less access to reading materials at home, and visit the library less often (Krashen and Shin 2004; Smith, Constantino, and Krashen 1996). Because a major emphasis of federal education policy has been to improve overall achievement and reduce the achievement gap for children of various socioeconomic groups, there has been a growing effort to improve emergent literacy skills and school readiness and to promote caregiver–child literacy interactions. One way these interactions are targeted is through book-distribution programs (Lindsay 2010). Community book-distribution programs. Book-distribution programs are based on the understanding that facilitating access to print materials can promote family–child reading interactions, which subsequently lead to improvements in emergent literacy and socialemotional development (Bracken and Fischel 2008). Reach Out and Read (ROR), Bookstart (BS), and the program of focus in this paper – the Imagination Library (IL) – are three widely disseminated community book-distribution programs. ROR (http://www.reachoutandread.org/) was established in 1991 and has a three-part strategy to (a) have trained health care providers speak with parents about the importance of reading aloud – starting at infancy, (b) disseminate free books and literacy materials, and (c) create ROR pediatrician offices that are rich in literacy materials and include volunteers who read to children waiting for appointments in pediatric offices. More than 15 peer-reviewed studies on ROR, relying on observations of parent and child literacy interactions, reveal that program participants – compared with waitlist participants –
Downloaded by [Aaron Thompson] at 04:36 18 June 2016
JOURNAL OF CHILDREN AND POVERTY
3
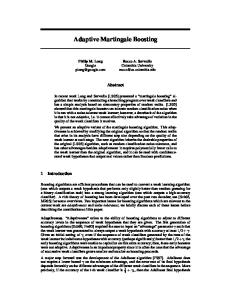
consistently demonstrate improvements in caregiver–child literacy interactions (Mendelsohn et al. 2001; Weitzman et al. 2004), advances in emergent literacy skills (Diener, Hobson-Rohrer, and Byington 2012), and improvements in social-emotional learning domains (Duursma, Augustyn, and Zuckerman 2008; Theriot et al. 2003). The Bellevue Project for Early Language, Literacy and Education Success (BELLE; http:// www.med.nyu.edu/pediatrics/developmental/research/the-belle-project) extended the findings from prior studies on ROR by conducting a three-way, blinded randomized trial with 675 low-income, urban mother–child dyads (Weisleder et al. 2016). Dyads were randomly assigned one of three conditions: Video Interaction Project (VIP; n = 176), Building Blocks (BB; n = 111), and treatment as usual (TAU; n = 176). VIP extended ROR by adding an interventionist who used video recordings to teach parents reading strategies and encourage positive caregiver–child literacy interactions. At 36 months, children randomized to the VIP condition showed significant reductions in hyperactivity (d = .27, p < .05) and externalizing problems (d = .27, p < .05) compared with control subjects. Although VIP children also tended to have lower aggression scores, this did not reach statistical significance (d = .20, p < .1) for the sample as a whole. Among higher risk families, VIP children had lower aggression scores than control dyads (d = .48, p < .05), as well as reduced hyperactivity (d = .55, p < .01) and externalizing problems (d = .57, p < .01; Weisleder et al. 2016). BS (http://www.bookstart.org.uk/) started in 1992 by providing (a) free books to participating families, (b) information and strategies for caregivers to improve child motivation to read, (c) opportunities to engage in literacy events at a library, and (d) online games and activities to connect free books to the experiences of children. Research on BS reveals proximal improvements in the quantity and quality of caregiver and child reading interactions (Moore and Wade 2003), emergent literacy skills (Goldfeld et al. 2011), and socialemotional skills of dysregulated children (van den Berg and Bus 2014). When comparing 462 families randomized to BS (n = 235) or a waitlist (n = 227), researchers observed increases in parent-reported reading interactions; however, no distal improvements in literacy or social-emotional outcomes were observed (O’Hare and Connolly 2010). Lastly, the IL (https://imaginationlibrary.com/) program was started in 1996 and seeks community partners to promote early access to reading materials. To join in IL, an entity within a community (e.g. library, school district, United Way, etc.) pays an annual fee that allows any family with a child under the age of five living in the community to receive one IL book per month at no cost to the family. As shown in Figure 1, the IL program aims to: (a) increase the number of books in the homes of preschool children; (b) increase literacy activities between caregivers and preschool children; (c) increase the quality of caregiverchild literacy interactions; (d) increase child interest in reading; and (e) increase school readiness (i.e. emergent literacy and social-emotional skills) (Lelle 2011). The number of communities accessing the IL program has steadily increased since its inception, and at the time of this study the IL website reported that the program was being used in 700 communities around the world, distributing books to 806,458 children. Despite the growing number of communities adopting IL, little rigorous research exists on the impact of the program. In contrast to the many quasi-experimental and even randomized experimental studies examining the effects of ROR and BS, nearly all IL studies are pre-experimental or case studies, in that these studies lack a control or an evenly balanced comparison group. This limitation biases findings in favor of the IL program and threatens the external study validity of the findings in this body of research (Shadish,
Downloaded by [Aaron Thompson] at 04:36 18 June 2016
4
A. M. THOMPSON ET AL.
Figure 1. Logic model of the IL.
Cook, and Campbell 2002). For example, an evaluation of Hawaii’s IL program suggested modest increases in parent and child reading interactions, but the study did not have a comparison group (Fong 2007). A second evaluation, conducted in Tennessee in 2008 – one of the few that used a comparison group – suggested that teachers rated 48% of IL kindergarten students as performing better academically and behaviorally than expected, compared with only 10% of non-IL students (Tennessee Board of Regents 2008a). However, the study selected the comparison group post hoc and did not use any methods to match IL to non-IL students with regard to demographics or other factors that might have explained the post hoc differences. Thus these studies introduce a great deal of bias into the estimates summarizing the impact of IL. Furthermore, existing evaluations of IL rely heavily on parents’ reports of reading with their children and caregiver acceptance of IL. Though an increase in reading interaction is an important proximal outcome, parents are not always reliable reporters of their reading behaviors with children, and studies should rely on more distal sources of data to test the effects of the program on child outcomes (i.e. emergent literacy, social-emotional development). To be sure, the IL website hosts a plethora of research reports suggesting that participation in IL promotes positive caregiver–child reading interactions, emergent literacy skills, and social-emotional and behavioral skills; Ebert, 2014. Lastly, in contrast to reports published on ROR or BS, a review of the evaluation reports on the IL website (http://usa.imaginationlibrary.com/ resources.php) reveals that most evaluations of IL are not independent but are generally conducted by one of three sources directly connected to the IL program: (a) public organizations funding IL (Governor’s Books from Birth Foundation 2008; Tennessee Board of Regents 2008a, 2008b), (b) private organizations using government or private funds to administer IL (Thomason 2008), and (c) the Dolly Parton Foundation (Conyers 2012). Despite these barriers – and because of the growing spread of IL – a few rigorous studies have emerged. For example, Ridzi, Sylvia, and Singh (2014) surveyed 170 families participating in the IL program in Syracuse, New York, and analyzed data at the program’s tenth month of implementation. Although the authors found that families participating for four
Downloaded by [Aaron Thompson] at 04:36 18 June 2016
JOURNAL OF CHILDREN AND POVERTY
5
months (i.e. receiving only four books) reported significant increases in child-directed reading and improved quality of caregiver–child reading interactions, the findings are limited by several design and measurement issues. First, the study relied solely on caregiver report of program acceptability and reading interactions with children. Although program acceptability is a key process measure, participant acceptance and satisfaction with a program are not an outcome of a program’s impact (Kaplan and Garrett 2005; Kellogg 2004). Further, parents are not always reliable reporters of their reading behavior with children. Second, the study did not examine reliable measures of emergent literacy skills or social-emotional school readiness. Third, the results were based on data from families with an average program enrollment of only five months (M = 5.66 months, SD = 2.88) and a maximum of 10 months. Thus, the study results did not include participants exposed to a full 60 months of the program. And, most noteworthy among these limitations, the study did not compare IL participants with a balanced comparison group. In sum, the impact of IL on family processes and child-level outcomes is largely correlational – yet, communities around the globe continue to invest in the IL program. The current report summarizes two of the most rigorous studies to date on IL and adds to the literature by (a) using propensity score match (PSM) methods to create statistically balanced IL and non-IL groups, (b) using reliable measures and adequate sample sizes, and (c) collecting data on both proximal home processes and distal child school readiness outcomes. In Study One, we report the effect of IL on the quality and quantity of caregiver– child home reading interactions. In Study Two, we report the effects of IL on school readiness by assessing emergent literacy skills and social-emotional competencies. The two studies seek to answer the following questions: (1) Study One: Do IL families – compared with matched non-IL families – report increased (a) access to reading materials, (b) use of literacy spaces, (c) quality of caregiver–child literacy interactions, (d) child interest in, and (e) parent orientation toward reading? (2) Study Two: Do IL students – compared with matched non-IL students – have improved (a) social-emotional school readiness and (b) emergent literacy scores?
General method General design Studies One and Two both used a two-group, quasi-experimental design. Because assigning children to IL and comparison groups was not possible via random or other generally accepted assignment practices, we used a PSM method to match IL and non-IL participants (Rosenbaum and Rubin 1983) – a feature of the current study which increases both the rigor of the study design and the trustworthiness of the estimates derived from the data collected in both studies. Why PSM to select IL and non-IL participants The use of PSM for matching has seen an increase over the past decade in the evaluation of social programs (Fraser et al. 2011; Guo and Fraser 2009) and in educational research
Downloaded by [Aaron Thompson] at 04:36 18 June 2016
6
A. M. THOMPSON ET AL.
(Hong and Raudenbush 2005). PSM includes a family of procedures to match program participants with non-program participants where it is not feasible or ethical to conduct randomized trials (Guo and Fraser 2009). As first proposed by Rubin (1974), the estimation of causal effects in intervention research is intended to compare similarly situated individuals or groups of individuals at specific points in time. Though the accuracy of effect parameters as estimates of the true causal impact of a program is a function of a host of related factors, the degree to which group assignment confounds contribute to post-test group differences is of paramount concern (Shadish, Cook, and Campbell 2002). Randomization to experimental and control conditions is widely regarded as the best assignment process to reduce the effect of observed and unobserved differences between study participants. However, many community policies and programs – for reasons related to ethics or feasibility – do not lend themselves to random assignment. A key assumption in observational studies is that treatment assignment is ignorable. However, in a program such as IL – in which families opt to participate – there is a strong likelihood that the decision to participate is related to both the outcomes and individual differences that may confound comparisons between IL and non-IL participants (Rosenbaum and Rubin 1983; Rubin 1991, 2008). Thus matching methods reduce the confounds and generate statistically balanced groups. Among the many matching methods, PSM matching is the most robust strategy to produce trustworthy estimates comparable to randomized experiments (Guo and Fraser 2009). In short, PSM defines the probability of participating in IL based on observed covariates e(x) = P(Tx = 1|X), where the propensity score (e(x)) is equal to the probability (P) of being in the treatment (Tx = where 1 = IL and 0 = non-IL) given (|) a set of observed covariates (X ). The propensity score is a singlepoint estimate that communicates the likelihood of a family’s participating in IL. Using the propensity scores, we can compare similarly situated IL families to non-IL families with the same covariates – effectively reducing the effect of confounding variables that may explain the differences between program participants and non-program participants. More specifically, in both Studies One and Two, we used a greedy matching procedure with a narrow caliper to identify the nearest and most similar neighbor to each IL program participant. Greedy matching is a common matching algorithm, and nearest neighbor is a greedy matching method considered the best option for these studies because it allowed us to adjust the size of the caliper – ultimately improving the match and the trustworthiness of the estimates derived from analytical models, because the differences between IL and non-IL families is reduced to its smallest allowable size (Guo and Fraser 2009). Regarding the selection of variables for the greedy matching procedure, we relied on prior research and theory to select variables that would explain differences between children in social-emotional functioning and emergent literacy skills. Furthermore, because this evaluation was a post hoc analysis, we were constrained by the data collected from families during kindergarten enrollment. When examining prior studies of book-distribution programs in which analysts relied on covariance control models (Kaplan and Garrett 2005; Kellogg 2004; Ridzi, Sylvia, and Singh 2014; Tennessee Board of Regents 2008a, 2008b), we included a batch of variables that would, theoretically speaking, explain differences in children’s school readiness. That is, we selected a batch of variables from an existing dataset that were most likely to predict performance on the outcomes of interest (i.e. social-emotional and emergent literacy skills). We used time-invariant characteristics of participants (i.e. child sex, race, preschool participation) as well as
Downloaded by [Aaron Thompson] at 04:36 18 June 2016
JOURNAL OF CHILDREN AND POVERTY
7
time-variant predictors (i.e. free reduced lunch (FRL), occupation type, education level, individualized education program (IEP), employment, single-parent home, English as a second language, occupation of parent, education level of parent, and participation in parents as teachers (PAT)). The last matching variable listed here, PAT (http://www. parentsasteachers.org/), refers to a home-visiting program that many low-income and single-parent families participating in this study accessed. PAT participation was a relevant variable to include, as we matched families who had participated in the program to reduce the effect of participation on the outcomes. In short, the variables selected for PSM here, as in other studies, are social determinants that are observable and readily available for a post hoc study in a PSM framework, and prior studies such as the High Scope/Perry preschool project and others suggest that these indicators are related to the outcomes of interest (Bradley and Corwyn 2002; Schweinhart 1993, 2003; White 1982). Just as in covariance control models commonly used to assess outcomes in quasi-experimental designs, these variables are relevant for PSM models (Fraser et al. 2011; Guo and Fraser 2009). A stepwise PSM procedure was used in both studies to match IL and non-IL participants. In step one, we compared IL and non-IL participants on a host of variables. In step two, IL and non-IL participants were randomly ordered. In step three, logistic regression models estimated predicted values of each person’s likelihood of participating in the IL program based upon the observed covariates. In step four, the standard deviation of the predicted values was used to calculate the size of the caliper or the size of the space within which IL participants were matched with non-IL participants. In step five, the PSM model selected the closest non-IL comparison match to each IL participant. Once a match was achieved, each matched pair was removed from the pool before the next matched pair was selected. In step six, we analyzed the differences between matched IL and non-IL groups using models that were appropriate for the data structure in each of the studies. All PSM procedures and analyses were conducted using Stata, 13.0 (StataCorp 2015). Specific study method procedures (i.e. recruitment, data collection, and PSM matching), characteristics of final analytical samples, analytical models, and results for Study One and Study Two follow here.
Study One method Study One: recruitment procedures Participants in Study One were identified by school district officials, who cross-referenced the school district’s kindergarten enrollment list with the local library IL mailing list. Families of enrolled kindergarten students participating in the IL program (n = 231) were identified from the entire IL community participant list (n = 2178). Next, families of enrolled kindergarten students were assigned random numbers and sorted in ascending order by those numbers. Starting at the top of the list, families were contacted until an adequately powered sample size was achieved. Study One: power analysis ‘Power’ refers to the sample size needed for a study to reject the null hypothesis that no association exists between an outcome and program participation (Shadish, Cook, and
8
A. M. THOMPSON ET AL.
Campbell 2002). A priori power analysis using Optimal Design 2.01 (Raudenbush et al. 2011) was conducted with a statistical power of 0.80, and alpha was set at 0.05. Using the parameters listed here, Optimal Design suggested that a total of 108 families – 54 in each condition – were necessary to adequately power the study. In total, 85 IL families were contacted, and a final sample of 56 IL families (65% response rate) agreed to participate in the study. We then matched those 56 IL families to 56 non-IL families using demographic data available to the schools.
Downloaded by [Aaron Thompson] at 04:36 18 June 2016
Study One: data collection procedures Data were collected by eight graduate-level interviewers using a structured interview format. Interviewers participated in one hour-long training session, in which the interview protocol was reviewed. Interviewers then observed and coded an interview with high consistency (k = .97). Interviewers worked in teams of two to contact each of the 56 IL families to carry out the interview protocol. Once the 56 IL families were interviewed, the kindergarten enrollment list was again cross-referenced with libraries’ IL mailing lists to identify children of non-IL families enrolled for kindergarten (n = 870). Next, using a batch of relevant demographic variables collected from kindergarten enrollment forms, PSM procedures were applied to identify 56 non-IL families matched to the 56 IL families. Comparison families were then contacted, and the interview protocol was repeated. All families consented to participate in the study, and each was provided with a $20 gift certificate for their time. Study One: PSM matching procedures To select the participants for the analytical sample in Study One, we used a batch of covariates (see Table 1) describing 56 IL families to select 56 matched non-IL families using a PSM greedy matching procedure with a narrow caliper (.29). The 56 non-IL families were derived from the kindergarten enrollment lists, which contained 870 non-IL families (see Table 1). As shown in Table 1, the 56 IL families were significantly different from the 870 non-IL families with regard to child sex, free and reduced-price lunch status (FRL), and whether the child had an IEP. Following PSM procedures, the analytical sample for Study One consisted of 112 families with children entering kindergarten (see Table 2; IL = 56; non-IL = 56). Shown in Table 2, the 56 IL families and non-IL families did not significantly differ on covariates – suggesting that the PSM procedure was a success. Study One: analytical sample characteristics Study One took place in a moderate-sized midwestern community participating in the IL program for five years. The 56 IL families and their children (ranging in age from five to six years) participated in the program for an average of 47.35 (s.d. = 14.86) out of 60 possible months. Among the 112 Study One participants, 95 were mothers (84.5%), 16 were fathers (14.3%), and one was a grandmother. Study One included 12 single parents (10.7%) and 103 (92%) identified as being European-American or white, whereas others identified as African-American. Three caregivers (2.7%) reported their level of education as some high school, 6 (5.4%) reported being high school graduates, 13 (11.6%) had some
JOURNAL OF CHILDREN AND POVERTY
9
Table 1. Unmatched sample summary statistics for IL versus non-IL participants. Study One
Downloaded by [Aaron Thompson] at 04:36 18 June 2016
Variable Child sex (m = 1) FRL (yes = 1) Preschool (yes = 1) Race (EuAm = 1) IEP (yes = 1) Employed (yes = 1) Single parent (yes = 1) ESL (yes = 1) PAT (yes = 1) Caregiver occupation Caregiver education Study Two Variable Student sex (m = 1) FRL (yes = 1) Preschool (yes = 1) Race (EuAm = 1) IEP (yes = 1) ESL (yes = 1) PAT (yes = 1) Class size Sch% at grade level Sch% FRL
IL (n = 56)
non-IL (n = 870)
Overall
Statistica
df
p-Value
41.10% 87.50% 89.30% 94.60% 8.90% 98.20% 12.50% 0% 71.40% 3.23 6.73
54.24% 74.90% 87.30% 88.23% 2.40% 96.40% 8.90% 2.80% 66.60% 2.36 6.71
53.24% 75.27% 87.04% 91.21% 2.81% 97.30% 9.10% 2.59% 71.12% 2.79 6.72
χ = 3.041 χ = 4.491 χ = 0.01 χ = 2.141 χ = 5.97 χ = 0.484 χ = 0.461 χ = 0.681 χ = 0.371 t = 0.106 t = 0.951
1 1 1 1 1 1 1 1 1 924 924
0.041 0.042 0.594 0.686 0.015 0.526 0.512 0.094 0.681 0.927 0.165
IL (n = 189) 42.80% 37.03% 26.46% 66.14% 7.87% 9.52% 52.38% 17.98 84.26 39.21
non-IL (n = 704) 43.20% 37.40% 26.80% 65.80% 6.90% 9.50% 28.70% 17.8 69.71 43.13
Overall 51.80% 43.80% 26.00% 62.80% 7.30% 11.10% 33.70% 18 69.87% 42.34%
Statistica χ = 7.30 χ = 4.037 χ = 0.093 χ = 0.91 χ = 0.062 χ = 0.637 χ = 36.563 t = 0.108 t = −0.656 t = 2.180
df 1 1 1 1 1 1 1 17 891 891
p-Value 0.009 0.048 0.781 0.743 0.474 0.256 0.001 0.456 0.512 0.037
Note: df = degrees of freedom; values which are in bold p < .05; m = male; FRL = free and reduced lunch status; IEP = individualized education plan; EuAm = European American (white); ESL = English as a second language; PAT = parents as teachers; Sch% = School level percentage of students performing at grade level and participating in the free and reduced lunch program. a Differences between samples for categorical variables were evaluated using a chi-square test for equal variances. Differences in means between samples for numerical variables were evaluated using an independent studentized t-test statistic.
college, 52 (46.6%) reported college degrees, and 39 (34.8%) had graduate degrees. Regarding employment, three study participants (2.7%) were unemployed and one family reported that English was its second language. All families (n = 100; 89%) reported that their children had had at least one year of preschool.
Study One: measures The independent variable in Study One was modeled using an intent-to-treat approach, where program participation was coded as a dichotomous variable (1 = IL, 0 = non-IL). However, we also tested several dosage models based upon the work of Ridzi, Sylvia, and Singh (2013), which suggested that four months of participation produced effects (Ridzi, Sylvia, and Singh 2014). Theriot et al. (2003) also found similar dose effects with the ROR program. All outcomes were tested using a treatment of the treated model where participation was coded as four months or more (1 = IL) compared with those who had participated less than four months (0 = non-IL). Dependent variables included social exchanges and materials surrounding literacy interactions in the home (Bus, van IJzendoorn, and Pellegrini 1995; Sénéchal et al. 1998; Sénéchal and LeFevre 2003) and were assessed using a modified version of the Family Reading Survey (FRS) (Bracken and Fischel 2008; Payne, Whitehurst, and Angell 1994). Items in the FRS were rated on a 5-point Likert-type response set (1 =
10
A. M. THOMPSON ET AL.
Table 2. Matched sample summary statistics for IL and non-IL participants. Study One
Downloaded by [Aaron Thompson] at 04:36 18 June 2016
Variable Child sex (m = 1) FRL (yes = 1) Preschool (yes = 1) Race (EuAm = 1) IEP (yes = 1) Employed (yes = 1) Single parent (yes = 1) ESL (yes = 1) PAT (yes = 1) Caregiver occupation Caregiver education Study Two Variable Student sex (m = 1) FRL (yes = 1) Preschool (yes = 1) Race (EuAm = 1) IEP (yes = 1) ESL (yes = 1) PAT (yes = 1) Class size Sch% at grade level Sch% FRL
IL (n = 56)
non-IL (n = 56)
Overall
Statistica
df
p-Value
41.10% 87.50% 89.30% 94.60% 8.90% 98.20% 12.50% 0% 71.40% 3.23 6.73
52.10% 85.90% 89.30% 89.30% 8.40% 96.40% 8.90% 1.80% 69.60% 2.36 6.71
49.20% 86.81% 89.30% 92.11% 8.60% 97.30% 10.70% 0.90% 71.12% 2.79 6.72
χ = 0.531 χ = 0.531 χ=1 χ = 0.489 χ = 0.683 χ = 0.484 χ = 0.541 χ = 0.314 χ = 0.641 t = 0.106 t = 0.951
1 1 1 1 1 1 1 1 1 110 110
0.931 0.929 0.951 0.484 0.269 0.489 0.761 0.561 0.243 0.951 0.107
IL (n = 189) 42.80% 37.03% 26.46% 66.14% 7.87% 9.52% 52.38% 17.98 84.26 39.21
non-IL (n = 189) 45.50% 36.51% 28.57% 69.31% 5.82% 5.82% 52.38% 17.98 84.18 41.78
Overall 44.20% 36.71% 27.51% 67.73% 6.35% 7.67% 52.38% 18 84.22% 41.54%
Statistica χ = 0.268 χ = 0.011 χ = 0.212 χ = 0.436 χ = 0.178 χ = 1.831 χ = 0.001 t = 0.763 t = 0.938 t = 1.181
df 1 1 1 1 1 1 1 376 376 376
p-Value 0.456 0.531 0.326 0.931 0.646 0.273 0.473 0.563 0.552 0.442
Note: df = degrees of freedom; p < .05; m = male; FRL = free and reduced lunch status; IEP = individualized education plan; EuAm = European American (white); ESL = English as a second language; PAT = parents as teachers; Sch% = School level percentage of students performing at grade level and participating in the free and reduced lunch program. a Differences between samples for categorical variables were evaluated using a chi-square test for equal variances. Differences in means between samples for numerical variables were evaluated using an independent studentized t-test statistic.
never to 5 = always) and were reworded to include others beyond parents (i.e. caregivers). The FRS has an average correlation of .22 between items, and factor analysis suggested that the items subdivided into five distinctly different factors with eigenvalues greater than 1. Prior studies have suggested that the FRS is predictive of children’s performance on the Peabody Picture Vocabulary Test-III (Dunn and Dunn 1997) and the Woodcock Johnson-Revised (Bracken and Fischel 2008; Woodcock 1989). FRS items were combined into 5 mean-centered composites representing access to home literacy materials (10 items; α = .89), use of home literacy spaces (10 items; α = .84), quality of home literacy interactions (10 items; α = .78), child’s interest and motivation in literacy activities (8 items; α = .85), and caregiver’s orientation to literacy (8 items; α = .91). Before analysis, negatively worded items were reverse-coded so that higher scores represented more desirable behaviors (i.e. never reading = 5 was recoded as 1 to indicate a child always reads). After recoding, mean-centered subscale scores were computed for each family. Demographic, educational, and occupational information was collected from caregivers. Preschool and library experiences of the child were also collected. Study One: analysis Following PSM procedures, IL-participants and non-IL participants were compared using chi-square tests to examine the effects of selection bias. Next, a single-level regression model was used to obtain parsimonious estimates of the effect of IL on five outcomes
JOURNAL OF CHILDREN AND POVERTY
11
(i.e. access to literacy materials, use of literacy spaces, quality of literacy interactions, child’s literacy interest, and caregiver literacy orientation). All models included covariates to reduce unexplained variance in the outcomes.
Downloaded by [Aaron Thompson] at 04:36 18 June 2016
Study One: results No effects were observed in the current study for any of the dosage models; we report only the main effects models here. Model estimates, standard errors, and amount of variance explained (i.e. R 2 and R 2adj) are shown in Table 3. As shown in Table 3, the treatment variable (IL = 1; non-IL = 0) significantly favored the IL condition with regard to increased quality of literacy interactions between children and caregivers (t = 1.862, p = .046; 95% CI = .012–.394). When Cohen’s (1988) standardized metric was used for effect size, the effect of IL participation on the quality of caregiver-child reading interactions was extremely small (d = .043). IL participation did not predict improvements in the other four outcomes of literacy materials, spaces, child interest, or caregiver orientation to reading. There were no significant interaction effects between family characteristics and program exposure.
Study Two method Study Two: recruitment procedures Following the start of the school year, all kindergarten teachers (n = 71) from one district with 19 elementary sites were contacted by school administrators and asked to participate in the study. A majority of teachers (n = 51; 72%) in 18 of the 19 school buildings consented to participate. Administrative records revealed that 98% of teacher participants were female, with the majority having master’s degrees (64.7%) and all others having bachelor’s or educational specialist’s degree, and that the average age was 36 (SD = 5.6). The average length of time teacher participants had taught was 10.2 years (SD = 4.78). Lastly, 98% of teachers identified as European-American or white. Teachers were blinded to study conditions in that they did not know which students participated in IL and which students did not. For their effort and time, each teacher was paid a $40 stipend. Study Two: power analysis A power analysis was conducted prior to data collection to determine the minimal sample size needed to safely detect effects. Using Optimal Design (Raudenbush et al. 2011) with statistical parameters of .80, an alpha of .05 for a two-tailed test, and intraclass correlations at the classroom and school levels set at .19 and .04, the results, respectively, suggested that a minimal sample size of 112 students – 56 per condition – was necessary to detect effects in the study. In total, 189 IL students were compared with 189 non-IL students. Study Two: data collection procedures Teachers administered the Phonological Awareness Literacy Screening for Kindergarteners (PALS-K) (Huang, Ford, and Invernizzi 2011; Huang and Invernizzi 2012; Huang, Invernizzi, and Drake 2012) to every kindergarten student. All teachers were trained in
Literacy materials Variables
Est
SE
Literacy spaces Est
Literacy interactions SE
Est
SE
Child literacy int. Est
SE
Caregiver orientation Est
SE
Intercept 3.66*** 0.257 3.765*** 1.264 4.988*** 0.765 3.81*** 0.84 3.847*** 1.081 Tx (IL = 1) 0.512 0.348 −0.128 0.169 0.191* 0.102 0.033 0.112 0.154 0.145 PSM number 0.001 0.051 −0.006 0.004 0.001 0.003 0.003 0.003 0.002 0.004 Child sex (m = 1) 0.031 0.422 0.023 0.003 0.003 0.023 0.042 0.034 0.001 0.005 FRL (yes = 1) 0.042 0.036 0.032 0.043 0.026 0.028 0.042 0.075 −1.621 0.918 Preschool (yes = 1) 0.065 0.517 0.239 0.281 0.062 0.171 0.307 0.187 −0.159 0.24 Race (EuAm = 1) 0.087 0.835 0.688 0.331 −0.185 0.201 0.374* 0.221 0.095 0.284 IEP (yes = 1) 0.036 0.048 0.046 0.028 0.024 0.024 0.023 −0.001 0.085 0.323 Employed (yes = 1) 0.926 0.842 0.047 0.032 −0.006 0.019 −0.016 0.021 0.068 0.027 Single parent (yes = 1) 0.164 0.584 0.39 0.28 −0.066 0.169 0.005 0.186 0.083 0.239 ESL (yes = 1) −0.147 0.193 1.726* 0.953 0.062 0.171 −0.101 0.633 −1.767 0.815 PAT (yes = 1) 0.034 0.023 0.036 0.044 0.043 0.163 −0.093 0.465 −0.043 0.054 Caregiver education 0.183 0.151 −0.101 0.128 −0.014 0.043 −0.016 0.021 0.168 0.061 0.303 0.363 0.064 0.263 0.438 R2 0.092 0.132 0.018 0.069 0.191 R 2 adj Note: Tx = treatment variable-IL; IEP = individualized education plan; ESL = English as a second language; PAT = parents as teachers; FRL = free and reduced lunch. Bolded* estimates appraised at p<.***.001, **.01, *.05.
A. M. THOMPSON ET AL.
Downloaded by [Aaron Thompson] at 04:36 18 June 2016
12
Table 3. Study One: multiple regression model estimates for IL (n = 56) versus non-IL families (n = 56).
JOURNAL OF CHILDREN AND POVERTY
13
and administered the PALS-K biannually to track literacy progress of all students. Teachers also completed a 15-item school-readiness measure in early October on 893 students. Cross-referencing the list of 893 students with the library IL mailing lists revealed that 189 students (21.3%) participated in IL and 704 students did not. Following data collection on the PALS-K and school readiness measures, a batch of student demographic variables were used in a PSM model to match IL students with non-IL students.
Downloaded by [Aaron Thompson] at 04:36 18 June 2016
Study Two: PSM matching procedures In Study Two, we used a PSM greedy matching procedure with a narrow caliper (.14) to identify the nearest neighbor to each IL participant. To select the analytical sample in Study Two, we applied PSM to a batch of covariates (see Table 1) describing 189 students whose families participated in IL to select 189 matched non-IL students. As shown in Table 1, the 189 IL students were significantly different from the 704 non-IL students with regard to sex, student- and school-level FRL status, and participation in PAT – an early home-visiting program predating PSM procedures. Following PSM procedures, 189 IL students were then compared with the 189 matched non-IL students. As shown in Table 2, the PSM-matched IL and non-IL students were similar on all observed variables – suggesting that the PSM was a success. Study Two: participant characteristics Study Two took place in the same moderate-sized midwestern community as the first study. Students (ranging in age from five to six years) in Study Two participated in IL for an average of 49.73 (s.d. = 12.92) out of 60 possible months. Among the 378 students in Study Two, 167 (44.2%) were female, 438 (93.3%) spoke English as their first language, 140 (36.7%) accessed the subsidized lunch program, 354 (93.7%) were regular education students, and 8 (2.1%) identified their racial/ethnic descent as Asian-, 69 as African(18.3%), 256 as European- or white (67.7%), 18 as Hispanic- (4.8%), and 27 as Multiracial-American (7.1%).
Study Two: measures The independent variable in Study Two was modeled using an intent-to-treat approach, in which program participation was coded as a dichotomous variable (1 = IL, 0 = non-IL). Again, with the work of others (Theriot et al. 2003) suggesting dosage effects of participating in book-distribution programs, all outcomes were tested using a treatment of the treated model, where program participation was coded as four months or more as treated (1 = IL) and participation of less than four months as nontreated (0 = non-IL). Dependent variables in Study Two included emergent literacy skills – measured using the PALS-K – and social-emotional school readiness. The PALS-K measures phonological awareness (i.e. rhyme awareness, α = .81; beginning sound awareness; α = .78) and emergent literacy tasks (i.e. alphabet knowledge, α = .92; knowledge of letter sounds, α = .88; spelling, α = .89; word concept, α = .92). Total scores for the PALS-K were computed from subscales and then summed, with children rated as above, at, or below benchmark.
Downloaded by [Aaron Thompson] at 04:36 18 June 2016
14
A. M. THOMPSON ET AL.
Social-emotional school readiness was assessed using 15 items from the Teacher Adaptation of Classroom Adaptation-Revised (TOCA-R) (Werthamer-Larsson, Kellam, and Oveson-McGregor 1990). To assess school readiness, three subscales of the TOCA-R were used to assess teacher perceptions of authority problems (α = .85), social competence (α = .84), and emotional regulation (α = .84) using a 6-point Likert-type scale (0 = never, 5 = always). Together, the subscale items assessed student propensities to attend to tasks, work alone/with others, manage responses to adverse events, think before acting, be socially or physically aggressive, follow directions, and disrupt instruction. The TOCA is one of the most widely used school-based assessments of children 7–18 and has been used in prior studies to screen elementary students at the start of school for at-risk behaviors (Thompson 2013). For example, in a sample of 2145 third- through fifth-grade students, screening scores of the most at-risk students (i.e. 20% of students) were predictive of below-grade level performance on standardized math (F[2,143] = 202.095, p < .001) and reading achievement tests (F[2,143] = 184.014, p < .001; Thompson 2013). Before analysis, negatively worded items were reverse-coded so that higher scores represented positive behaviors (i.e. fighting = 5 indicated that a child never fights). After recoding, mean-centered subscale scores were computed for each student. Student demographic information was collected using administrative records.
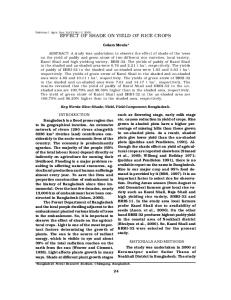
Study Two: analysis The data in Study Two were nested – that is, data were from 378 students nested in 51 classrooms situated in 18 schools. This nesting structure violates the independence assumption of single-level regression models, increasing the likelihood of a Type I error. Data for Study Two were modeled using a multilevel modeling approach (Raudenbush and Bryk 2002). Figure 2 is a base multilevel model, where Yijk represents the average score on a dependent variable (i.e. PALS-K score, school readiness score) for the ith student in the jth classroom situated in the kth school. The outcome score is a product of the intercept, exposure to the independent variable (β1jk*ILijk), and relevant student level covariates (B2j*StCovsijk; race, sex, and free and reduced-price lunch status). Moderation models between student level covariates and the independent variables were also tested using interaction terms (β3jk[IVijk*StCovsjk]). All models accounted for the violation of the independence assumption by modeling the correlated observations at the classroom (β0jk = π00jk + r0jk) and school levels (π00k = λ000 + (SchP)u00). Lastly, likelihood chi square ratio tests judged school level random effects models of school level poverty (SchP*u00) – but these were dropped if no variance was explained by the terms.
Figure 2. Basic multilevel model equation.
JOURNAL OF CHILDREN AND POVERTY
15
Table 4. Study two multilevel model estimates for PSM IL (n = 189) versus non-IL (n = 189) students. PALS-K Level & variable
Downloaded by [Aaron Thompson] at 04:36 18 June 2016
Student (i = 378) Intercept Tx (IL = 1) Child sex (m = 1) FRL (yes = 1) Preschool (yes = 1) Race (EuAm = 1) IEP (yes = 1) ESL (yes = 1) PAT (yes = 1) Classroom (j = 51) Class size School (k = 18) Sch % at grade level Sch % FRL
Soc. Comp.
Auth. Accept.
Emot. Reg.
Est
SE
Est
SE
Est
SE
Est
SE
1.88* −0.043 0.011 −0.364 −0.099 0.149 0.266* 0.254* 0.084
0.133 0.076 0.076 0.102 0.095 0.097 0.153 0.143 0.078
6.07* 0.133 0.415* −0.319* −0.191* 0.241* −0.622* 0.067 −0.012
0.149 0.088 0.088 0.118 0.111 0.112 0.177 0.167 0.089
6.594* 0.109 −0.261* −0.287* −0.138 0.102 −0.349* 0.193 −0.028
0.125 0.075 0.075 0.100 0.095 0.096 0.151 0.142 0.078
6.200* −0.024 −0.517* −0.409* −0.151 0.254* −0.841* 0.241 −0.044
0.149 0.086 0.087 0.117 0.109 0.111 0.175 0.164 0.088
0.001
0.053
0.006
0.008
0.001
0.004
0.108
0.010
0.016 0.004
0.078 0.005
0.004 0.001
0.001 0.001
0.013 0.001
0.001 0.032
0.001 0.001
0.004 0.003
Notes: Soc. Comp. = social competence; Auth. Accept. = authority acceptance; Emot. Reg. = emotion regulation; Tx = treatment variable-IL; IEP = individualized education plan; ESL = English as a second language; PAT = parents as teachers; FRL = free and reduced lunch. Bolded* estimates appraised at p < .05.
Study Two: results No treatment effects were observed in Study Two for the dosage models. The multilevel main effects models are shown in Table 4. In addition, no effects were found for the main effects models, suggesting that students participating in IL did not differ from non-IL matched students on PALS-K emergent literacy scores. Students exposed to IL also did not differ from non-IL students on teacher-rated social-emotional school readiness constructs (i.e. social competence, authority problems, and emotion regulation). Likelihood ratio tests of random effects models did not suggest any significant school or classroom effects. It should also be noted that intraclass correlations were small at the classroom (ICC = .07–.22) and school levels (.03–.07).
General discussion This report summarized the findings of two studies designed to test the effects of the IL program. Study One examined five indicators of family–child reading interactions with 112 families – 56 IL families and 56 non-IL families who were matched on an array of variables via a PSM approach. Study Two examined emergent literacy skills and social emotional school readiness outcomes with 189 IL students matched to 189 non-IL students through a PSM approach. Small effects were observed in Study One that favored program participants on quality of family–child reading interactions (d = .043) – however, no effects were observed for literacy materials, spaces, child interest, or caregiver orientation to reading. In Study Two, no effects were observed for child emergent literacy skills, or blinded teacher ratings of social-emotional school readiness. Though prior research strongly suggests that high-quality family and child reading interactions improve emergent literacy skills and school readiness (Bus and van IJzendoorn 1999; Bus, van IJzendoorn, and Pellegrini 1995), the effects of the current study indicate that simply distributing books to families is not enough to produce positive effects in family reading interactions or child-level emergent literacy and school-readiness
Downloaded by [Aaron Thompson] at 04:36 18 June 2016
16
A. M. THOMPSON ET AL.
outcomes. Indeed, the findings here echo prior studies of book distribution efforts suggesting that programs that actually do more than just distribute books (i.e. provide direct support and care-giver instruction on reading to children) produce substantially larger effects than programs that merely provide books (Lindsay 2010; McGill-Franzen et al. 1999; McGill-Franzen, Lanford, and Adams 2002; Weisleder et al. 2016). That is, an investment beyond simply providing books must be made if we are to improve family and child literacy interactions. For example, in a family where a caregiver may struggle with reading skills him- or herself, that caregiver may benefit from instructional strategies on using picture books to tell stories to his or her child (Auerbach 1989). Efforts such as these are ensconced in rigorously evaluated programs like PAT (http://www. parentsasteachers.org/), in which trained members of a community work with their neighbors to help prepare children for school. Several requirements for communities participating in IL limit the capacity of those communities to evaluate the investment. First, programs like IL produce a ‘black box’ effect. That is, no one can ever be certain that families receive literacy materials, take the books out of the packaging, read the books, and interact with the materials together, or that children have access to or interact with the materials on their own. Such conditions make it impossible to measure dosage or even ensure that participation translates into program exposure. Indeed, prior evaluations have observed dosage effects using the total number of months of participation in IL, revealing that four or more months of participation is correlated with increases in child-directed reading and improved quality of caregiver-child reading interactions (Ridzi, Sylvia, and Singh 2014). However, a dosage model assumes that families actually do interact with the materials – though self-report measures of families receiving access to a free program are subject to biased attitudes favoring the program. Nonetheless, the data in the current study were examined using a similar dosage approach to test the claim that length of participation in the IL program translates into differential effects on child-directed reading and improved quality of caregiver–child reading interactions. However, even when participants in the current study with full exposure are compared with those with less exposure (i.e. 33% of participants in Study One received the full 60 months of IL), no effects were observed on child orientation to reading or child-caregiver reading interactions. Using a dosage or treatment of the treated approach (Fraser et al. 2011) with a ‘black box’ program like IL will produce untrustworthy results, as we can never accurately measure exposure. The second barrier to designing a trustworthy community evaluation of IL is embodied in its program policies. IL does not permit a community to randomly assign families. Regardless of IL’s intent to provide all families in a community with access to books – irrespective of income level – clearly not all families need access to free books. That is, a community should retain the right to offer targeted supports to low-income families who truly need these types of supports. Furthermore, a community should evaluate any program or investment using a rigorous design – even randomly assigning families to program and comparison conditions if appropriate. Such approaches allow a community to appraise the impact of costly investments. However, under the current IL policies, families self-select to participate in IL or to not – and these conditions create unobserved factors that bias the estimates of nearly all program evaluations to date. It should be noted that the current evaluation used methods to create balanced groups; however, these groups
Downloaded by [Aaron Thompson] at 04:36 18 June 2016
JOURNAL OF CHILDREN AND POVERTY
17
consisted of consenting program participants, a factor that should favor the program. But, as we showed, there were weak to no effects detected in the current study. It should also be highlighted that sending books to more than 800,000 children in 710 communities worldwide relies on a large network of donors and communities to pay for the service, shipping costs, and the books. Such a large framework of participating communities should allow for some variance in implementation, such that select communities might participate in a randomized experiment with multiple conditions, such as with ROR and the BELLE project (Weisleder et al. 2016). Such flexibility might allow communities to engage in rigorous evaluations of such programs so that we can open the black box and better ascertain the dismantled impact of each of these practices. Despite the above limitations, the current study strengthens existing research on bookdistribution programs. First, the two studies reported here used PSM procedures, producing estimates similar to those of randomized studies (Guo and Fraser 2009). Second, both studies used reliable measures to model true program outcomes – namely, measures tapping family–child reading interactions and blinded teacher reports of emergent literacy skills and school readiness. Third, the current studies produce estimates based upon adequate sample sizes randomly drawn from a community sample – further minimizing the effects of selection bias. Lastly, the current studies applied appropriate statistical models to increase the rigor of the estimates. Predictably, both studies suffer from important limitations. Both are cross-sectional; future research should seek to examine long-term outcomes (e.g. literacy by third grade, social emotional outcomes). In addition, Study One relied solely on parent report of reading interactions with children, whereas future studies might also rely on observational data such as prior studies of ROR (Weitzman et al. 2004). However, the current study did make some modest advances in addressing these measurement issues by examining child performance on standardized tests of emergent literacy and blinded teacher report of social-emotional functioning. Next, though these studies did rely on PSM procedures to balance IL and non-IL groups, communities seeking to invest in such programs are not prohibited from applying treatment-assignment strategies to appraise the effects of such programs. For example, using a pilot study format and a small number of community volunteers, communities can implement a small book program to determine if the program makes a difference in caregiver reading interactions or distally related child outcomes. In an environment of shrinking resources, communities need to ensure that they use rigorous research-based findings to identify effective programs and target important outcomes for needy families. Similarly, when adopting such programs, communities should also consider strategies to evaluate the impact of the program. For example, Figure 1 in this paper provides a logic model for IL, according to the claims made by research reports on the IL website. Communities where members are considering investing in a program such as IL should take the time to examine existing studies, consider the validity of those findings, and then develop a logic model to help them determine if the resources are present to evaluate the program. Such a process is time-consuming but will assist communities in avoiding the adoption of programs that require significant investment but are difficult or even impossible to evaluate. In summary, quality literacy experiences start at home, and these experiences are highly predictive of short-term emergent literacy (Dickinson et al. 2006) and social-emotional school readiness (Bierman et al. 2008). Early investments in children’s education
Downloaded by [Aaron Thompson] at 04:36 18 June 2016
18
A. M. THOMPSON ET AL.
produce distal effects rippling throughout the lives of those children and are conferred on communities in terms of increased involvement and participation in the labor market as well as lower participation in welfare programs and crime (Heckman and Kautz 2012). Serious community investments in early childhood programs can produce promising effects; however, communities must also examine the impact of these investments using reliable and rigorous methods. Adopting programs for which it is impossible to appraise the effects only increases skepticism among community members about the wisdom of making such investments. Much of this skepticism is well-placed when we lack a cohesive framework for defining the criteria for calling a program ‘evidence-based’, and when individual organizations are allowed to tout their own costly intervention strategies via poorly designed evaluation outcomes (Hoagwood et al. 2014). In short, consulting with researchers regarding the quality of evidence underlying programs such as IL can help communities make wise investment decisions. Consultations with researchers can also build a community’s capacity to design the evaluation of a program beforehand and can lead to collaborations between researchers and community leaders to select and evaluate effective programs and avoid potentially ineffective programs. The bulk of scientific literature on the topic of school readiness aligns with the practice of promoting early access to literacy materials. However, care can be taken to avoid programs that require implementation and access for all members of a community – that is, communities should select programs that allow efforts to be targeted at struggling and low-income families. In addition, the research here suggests that just providing families with free books makes little impact. Families with economic stressors do require access to reading materials. However, they may also benefit from accurate information about the importance of reading with a child. For example, ROR’s model of providing free books alongside direct consultation in strategies for how to best read with children – strategies provided by a trained health care provider – appears to be effective. Furthermore, the ROR approach is supported by independent evaluators using valid and reliable research methods with effects on caregiver–child reading interactions (Mendelsohn et al. 2001; Weitzman et al. 2004), emergent literacy skills (Diener, Hobson-Rohrer, and Byington 2012), and social, emotional, and behavioral child outcomes (Duursma, Augustyn, and Zuckerman 2008; Theriot et al. 2003). ROR extends to family strategies on how to establish literacy routines at home, develop quiet spaces, monitor and reduce screen time, access age-appropriate literacy materials, and use behavioral strategies for improving reading interactions between caregivers and children (e.g. asking questions, pointing to words, helping children sound out letters, etc.). In addition, in a home with a parent who may struggle with reading, strategies are also available to increase the likelihood that the child will read (i.e. using wordless picture books, connecting pictures in stories to child’s own experiences, using books and audio read-along sets). In the end, the strategies used by programs such as ROR are more intensive and costly; however, when communities carefully target families in need, rather than requiring that communities allow everyone to have access to the program, the strategies are more feasible.
Acknowledgments The authors wish to thank the families, students, and teachers who participated in both studies.
JOURNAL OF CHILDREN AND POVERTY
19
Disclosure statement No potential conflict of interest was reported by the authors.
Funding The studies reported here were supported with funding from the University of Missouri Research Council and the Heart of Missouri United Way.
Notes on contributors
Downloaded by [Aaron Thompson] at 04:36 18 June 2016
Aaron M. Thompson is an assistant professor in the University of Missouri (MU) School of Social Work, where he studies the impact of community and school-based prevention and intervention efforts to improve social, emotional, and behavioral outcomes. Heather Klemp, MSW, is a graduate of the MU School of Social Work. Anne Stinson is currently a doctoral student in the MU School of Social Work focusing on the impact of early childhood prevention programs.
References Auerbach, E. R. 1989. “Toward a Social-contextual Approach to Family Literacy.” Harvard Educational Review 59 (2): 165–182. Ayoub, C., C. D. Vallotton, and A. M. Mastergeorge. 2011. “Developmental Pathways to Integrated Social Skills: The Roles of Parenting and Early Intervention.” Child Development 82 (2): 583–600. van den Berg, H., and A. G. Bus. 2014. “Beneficial Effects of BookStart in Temperamentally Highly Reactive Infants.” Learning and Individual Differences 36: 69–75. Bierman, K. L., C. E. Domitrovich, R. L. Nix, S. D. Gest, J. A. Welsh, M. T. Greenberg, and S. Gill. 2008. “Promoting Academic and Social-Emotional School Readiness: The Head Start REDI Program.” Child Development 79 (6): 1802–1817. Bracken, S. S., and J. E. Fischel. 2008. “Family Reading Behavior and Early Literacy Skills in Preschool Children from Low-income Backgrounds.” Early Education and Development 19 (1): 45–67. Bradley, R. H., and R. F. Corwyn. 2002. “Socioeconomic Status and Child Development.” AnnualReview of Psychology 53 (1): 371–399. Bus, A. G., and M. H. van IJzendoorn. 1999. “Phonological Awareness and Early Reading: A Metaanalysis of Experimental Training Studies.” Journal of Educational Psychology 91 (3): 403–414. Bus, A. G., M. H. van IJzendoorn, and A. D. Pellegrini. 1995. “Joint Book Reading Makes for Success in Learning to Read: A Meta-analysis on Intergenerational Transmission of Literacy.” Review of Educational Research 65 (1): 1–21. Cohen, J. 1988. Statistical Power Analysis for the Social Sciences. Hillsdale, NJ: Erlbaum. Conyers, J. 2012. “My Very Own Imagination Library.” Childhood Education 88 (4): 221–225. Crick, N. R., and K. A. Dodge. 1996. “Social Information-Processing Mechanisms in Reactive and Proactive Aggression.” Child Development 67 (3): 993–1002. Dickinson, D. K., A. McCabe, M. J. Essex, D. Dickinson, and S. Neuman. 2006. “A Window of Opportunity We Must Open to All: The Case for Preschool with High-quality Support for Language and Literacy.” Handbook of Early Literacy Research 2: 11–28. Dickinson, D. K., and P. O. Tabors. 2002. “Fostering Language and Literacy in Classrooms and Homes.” Young Children 57 (2): 10–19. Diener, M., W. Hobson-Rohrer, and C. Byington. 2012. “Kindergarten Readiness and Performance of Latino Children Participating in Reach Out and Read.” Journal of Community Medicine & Health Education 2 (133): 2–7.
Downloaded by [Aaron Thompson] at 04:36 18 June 2016
20
A. M. THOMPSON ET AL.
Dodge, K. A., J. Godwin, and Conduct Problems Prevention Research Group. 2013. “SocialInformation-Processing Patterns Mediate the Impact of Preventive Intervention on Adolescent Antisocial Behavior.” Psychological Science 24 (4): 456–465. Dodici, B. J., D. C. Draper, and C. A. Peterson. 2003. “Early Parent Child Interactions and Early Literacy Development.” Topics in Early Childhood Special Education 23 (3): 124–136. Doyle, B. G., and W. Bramwell. 2006. “Promoting Emergent Literacy and Social–Emotional Learning through Dialogic Reading.” The Reading Teacher 59 (6): 554–564. Dunn, L. M., and D. M. Dunn. 1997. Examiner’s Manual for the PPVT-III Peabody Picture Vocabulary Test: Form IIIA and Form IIIB. Circle Pines, MN: AGS. Duursma, E. V., M. Augustyn, and B. Zuckerman. 2008. “Reading Aloud to Children: The Evidence.” Archives of Disease in Childhood 93 (7): 554–557. Ebert, O. D. 2014. An Impact Analysis: Dolly Parton’s Imagination Library in Tennessee, 2004–2014. Nashville, TN. http://www.governorsfoundation.org/documents/gbbf-impact-report-final_digitalversion-2015.pdf. Fong, G. 2007. “A Report on Hawaii’s Imagination Library Program.” Evaluation Report. University of Hawai’i Center on the Family. Hoholulu, HI. http://usa.imaginationlibrary.com/ medias/file/Hawaii%20Research%20Survey.pdf. Fraser, M. W., S. Guo, A. R. Ellis, A. M. Thompson, T. L. Wike, and J. Li. 2011. “Outcome Studies of Social, Behavioral, and Educational Interventions: Emerging Issues and Challenges.” Research on Social Work Practice 21 (6): 619–635. Goldfeld, S., N. Napiza, J. Quach, S. Reilly, O. C. Ukoumunne, and M. Wake. 2011. “Outcomes of a Universal Shared Reading Intervention by 2 Years of Age: the Let’s Read Trial.” Pediatrics 127 (3): 445–453. Governor’s Books from Birth Foundation. 2008. Tennessee’s Imagination Library Improves School Preparedness. http://uwcentralcoast.org/PDF/BooksFromBirthResearch.pdf. Guo, S., and M. W. Fraser. 2009. Propensity Score Analysis: Statistical Methods and Applications (Vol. 12). Thousand Oaks, CA: Sage. Heckman, J. J., and T. Kautz. 2012. “Hard Evidence on Soft Skills.” Labour Economics 19: 451–464. Hess, R. D., and S. D. Holloway. 1984. “Family and School as Educational-Institutions.” Review of child development research 7: 179–222. Hoagwood, K., B. J. Burns, L. Kiser, H. Ringeisen, and S. K. Schoenwald. 2014. “Evidence-based Practice in Child and Adolescent Mental Health Services.” Psychiatric Services 52 (9): 1179–1189. Hong, G., and S. W. Raudenbush. 2005. “Effects of Kindergarten Retention Policy on Children’s Cognitive Growth in Reading and Mathematics.” Educational Evaluation and Policy Analysis 27 (3): 205–224. Huang, F., K. Ford, and M. Invernizzi. 2011. “Using Early Literacy Profiles of Hispanic English Language Learners to Predict Later Reading Achievement.” Paper presented at the annual meeting of the Society for Research on Education Effectiveness, Evanston, IL Paper. http:// eric.ed.gov/?id=ED518953. Huang, F. L., and M. A. Invernizzi. 2012. “The Association of Kindergarten Entry Age with Early Literacy Outcomes.” The Journal of EducationalRresearch 105 (6): 431–441. Huang, F. L., M. A. Invernizzi, and E. A. Drake. 2012. “The Differential Effects of Preschool: Evidence from Virginia.” Early Childhood Research Quarterly 27 (1): 33–45. Kagan, S., E. Moore, and S. Bredekamp. 1995. Reconsidering Children’s Early Learning and Development: Toward Shared Beliefs and Vocabulary. Washington, DC: National Education Goals Panel. Kaiser, A. P., T. B. Hancock, X. Cai, E. M. Foster, and P. P. Hester. 2000. “Parent-Reported Behavioral Problems and Language Delays in Boys and Girls Enrolled in Head Start classrooms.” Behavioral Disorders 26 (1): 26–41. Kaplan, S. A., and K. E. Garrett. 2005. “The Use of Logic Models by Community-based Initiatives.” Evaluation and Program Planning 28 (2): 167–172. Kellogg, W. 2004. Logic Model Development Guide. Battle Creek, MI: W. K. Kellogg Foundation.
Downloaded by [Aaron Thompson] at 04:36 18 June 2016
JOURNAL OF CHILDREN AND POVERTY
21
Krashen, S., and F. Shin. 2004. “Summer Reading and the Potential Contribution of the Public Library in Improving Reading for Children of Poverty.” Public Library Quarterly 23 (3–4): 99–109. Lelle, M. A. 2011. Imagination Library: Annual Evaluation Report. Battle Creek, MI: W.K. Kellogg Foundation. Lindsay, J. 2010. Children’s Access to Print Material and Education-related Outcomes: Findings from a Meta-analytic Review. Naperville, IL: Learning Point Associates. Lonigan, C. J., and G. J. Whitehurst. 1998. “Relative Efficacy of Parent and Teacher Involvement in a Shared-reading Intervention for Preschool Children from Low-income Backgrounds.” Early Childhood Research Quarterly 13 (2): 263–290. McGill-Franzen, A., R. L. Allington, L. Yokoi, and G. Brooks. 1999. “Putting Books in the Classroom Seems Necessary but not Sufficient.” The Journal of EducationalResearch 93 (2): 67–74. McGill-Franzen, A., C. Lanford, and E. Adams. 2002. “Learning to be Literate: A Comparison of Five Urban Early Childhood Programs.” Journal of Educational Psychology 94 (3): 443–464. McLoyd, V. C. 1998. “Socioeconomic Disadvantage and Child Development.” American Psychologist 53 (2): 185–204. Mendelsohn, A. L., L. N. Mogilner, B. P. Dreyer, J. A. Forman, S. C. Weinstein, M. Broderick, C. Napier, et al. 2001. “The Impact of a Clinic-based Literacy Intervention on Language Development in Inner-city Preschool Children.” Pediatrics 107 (1): 130–134. Moore, M., and B. Wade. 2003. “Bookstart: A Qualitative Evaluation.” Educational Review 55 (1): 3–13. O’Hare, L., and P. Connolly. 2010. A Randomised Controlled Trial Evaluation of Bookstart +: A Book Gifting Intervention for Two-Year-Old Children. Belfast: Centre for Effective Education, Queen’s University Belfast. http://www.qub.ac.uk/cee. Payne, A. C., G. J. Whitehurst, and A. L. Angell. 1994. “The Role of Home Literacy Environment in the Development of Language Ability in Preschool Children from Low-income Families.” Early Childhood Research Quarterly 9 (3): 427–440. Rampey, B. D., G. S. Dion, and P. L. Donahue. 2009. “NAEP 2008: Trends in Academic Progress. NCES 2009-479.” National Center for Education Statistics. Raudenbush, S. W., and A. S. Bryk. 2002. Hierarchical Linear Models: Applications and Data Analysis Methods, Vol. 1. Thousand Oaks, CA: Sage. Raudenbush, S., J. Spybrook, R. Congdon, X. Liu, and A. Martinez. 2011. “Optimal Design Software for Multi-level and Longitudinal Research.” http://www.wtgrantfoundation.org or from sitemaker.umich.edu/group-based. Raver, C. C., and J. Knitzer. 2002. Ready to Enter: What Research Tells Policymakers about Strategies to Promote Social and Emotional School Readiness among Three- and Four-year-old Children. New York: National Center for Children in Poverty. Raz, I. S., and P. Bryant. 1990. “Social Background, Phonological Awareness and Children’s Reading.” British Journal of Developmental Psychology 8 (3): 209–225. Ridzi, F., M. R. Sylvia, and S. Singh. 2013. “Imagination Library: Do More Books in Hand Mean More Shared Book Reading?” Center for Urban and Regional Applied Research. https://usa. imaginationlibrary.com/medias/Onondaga%20Co_%20Executive%20Summary%20July%205% 202011-1.pdf. Ridzi, F., M. R. Sylvia, and S. Singh. 2014. “The Imagination Library program: Increasing Parental Reading through Book Distribution.” Reading Psychology 35 (6): 548–576. Roggman, L. A., G. A. Cook, M. S. Innocenti, V. K. Jump, K. Christiansen, and L. K. Boyce. 2012. “Home Visit Rating Scales-Adapted & Extended: HOVRS-A.” http://www.isbe.state.il.us/ earlychi/pdf/prevention-intiative/HOVRS-A-info.pdf. Rosenbaum, P. R., and D. B. Rubin. 1983. “The Central Role of the Propensity Score in Observational Studies for Causal Effects.” Biometrika 70 (1): 41–55. Rubin, D. B. 1974. “Estimating Causal Effects of Treatments in Randomized and Nonrandomized Studies.” Journal of Educational Psychology 66 (5): 688–701.
Downloaded by [Aaron Thompson] at 04:36 18 June 2016
22
A. M. THOMPSON ET AL.
Rubin, D. B. 1991. “Practical Implications of Modes of Statistical Inference for Causal Effects and the Critical Role of the Assignment Mechanism.” Biometrics 47 (4): 1213–1234. Rubin, D. B. 2008. “For Objective Causal Inference, Design Trumps Analysis.” The Annals of Applied Statistics 2 (3): 808–840. Schweinhart, L. J. 1993. Significant Benefits: The High/Scope Perry Preschool Study through Age 27. Ypsilanti, MI: Monographs of the High/Scope Educational Research Foundation. Schweinhart, L. J. 2003. Benefits, Costs, and Explanation of the High/Scope Perry Preschool Program. Ypsilanti, MI: High/Scope Educational Research Foundation. Sénéchal, M., and J. A. LeFevre. 2003. “Parental Involvement in the Development of Children’s Reading skill: A Five-year Longitudinal Study.” Child Development 73 (2) 445–460. Sénéchal, M., J. A. Lefevre, E. M. Thomas, and K. E. Daley. 1998. “Differential Effects of Home Literacy Experiences on the Development of Oral and Written Language.” Reading Research Quarterly 33 (1): 96–116. Shadish, W. R., T. D. Cook, and D. T. Campbell. 2002. Experimental and Quasi-experimental Designs for Generalized Causal Inference. Independence, KY: Wadsworth/Cengage Learning. Smith, C., R. Constantino, and S. Krashen. 1996. “Differences in Print Environment for Children in Beverly Hills, Compton and Watts.” Emergency Librarian 24 (4): 4–5. StataCorp, L. P. 2015. Stata Statistical Software: Release 14. College Station, TX: StataCorp LP. Tennessee Board of Regents. 2008a. “Tennessee’s Imagination Library Improves School Preparedness.” http://usa.imaginationlibrary.com/medias/file/books_from_birth.pdf. Tennessee Board of Regents. 2008b. “Imagination Library Program fall 2007 Survey of PreKindergarten Teachers: Report of Findings.” http://www.governorsfoundation.org/pdf/ PreKindergartenResultsFall07final.pdf. Theriot, J. A., S. M. Franco, B. A. Sisson, S. C. Metcalf, M. A. Kennedy, and H. S. Bada. 2003. “The Impact of Early Literacy Guidance on Language Skills of 3-Year-Olds.” Clinical Pediatrics 42 (2): 165–172. Thomason, G. B. 2008. “The Impact of the Ferst Foundation for Childhood Literacy on the Home Literacy Environment.” Unpublished doctoral dissertation, Liberty University, Lynchburg, VA. Thompson, A. M. 2013. “A Randomized Trial of the Self-Management Training and Regulation Strategy for Disruptive Students.” Research on Social Work Practice. doi:1049731513509691. Webster-Stratton, C., J. M. Reid, and M. Stoolmiller. 2008. “Preventing Conduct Problems and Improving School Readiness: Evaluation of the Incredible Years Teacher and Child Training Programs in High-risk Schools.” Journal of Child Psychology and Psychiatry 49 (5): 471–488. Weisleder, A., C. B. Cates, B. P. Dreyer, S. B. Johnson, H. S. Huberman, A. M. Seery, A. L. Mendelsohn, et al. 2016. “Promotion of Positive Parenting and Prevention of Socioemotional Disparities.” Pediatrics 137 (2): 1–9. Weitzman, C. C., L. Roy, T. Walls, and R. Tomlin. 2004. “More Evidence for Reach Out and Read: A Home-based Study.” Pediatrics 113 (5): 1248–1253. Werthamer-Larsson, L., S. Kellam, and K. Oveson-McGregor. 1990. “Teacher Interview: Teacher Observation of Classroom Adaptation – Revised (TOCA-R).” Johns Hopkins Prevention Center Training Manual. Baltimore, MD: Johns Hopkins University. White, K. R. 1982. “The Relation Between Socioeconomic Status and Academic Achievement.” Psychological Bulletin 91 (3): 461–481. Woodcock, R. W. 1989. Woodcock-Johnson Revised Tests of Achievement. Itasca, IL: Riverside. Zins, J. E., and M. J. Elias. 2007. “Social and Emotional Learning: Promoting the Development of All Students.” Journal of Educational and Psychological Consultation 17 (2–3): 233–255. Zins, J. E., J. W. Payton, R. P. Weissberg, and M. U. O’Brien. 2007. “Social and Emotional Learning for Successful School Performance.” In The Science of Emotional Intelligences: Knowns and Unknowns, edited by G. Matthews, M. Zeidner, and R. D. Roberts, 376–395. New York, NY: Oxford University Press.