MMSE Noise Power and SNR Estimation for OFDM Systems Tevfik Y¨ucek and H¨useyin Arslan Department of Electrical Engineering, University of South Florida 4202 E. Fowler Avenue, ENB-118, Tampa, FL, 33620 Abstract— This paper proposes a minimum mean-square error (MMSE) filtering technique to estimate the noise power that takes into account the variation of the noise statistics across the orthogonal frequency division multiplexing (OFDM) sub-carrier index as well as across OFDM symbols. The proposed method provides many local estimates that allow tracking of the variation of the noise statistics in frequency and time. The MMSE filter coefficients are obtained from the mean-squared-error (MSE) expression, which can be calculated using the noise statistics. Evaluation of the performance with computer simulations shows that the proposed method tracks the local statistics of the noise more efficiently than conventional methods.
I. I NTRODUCTION Orthogonal Frequency Division Multiplexing (OFDM) is a multi-carrier modulation scheme in which the wide transmission spectrum is divided into narrower bands and data is transmitted in parallel on these narrow bands. Parallel with the possible data rates, the transmission bandwidth of OFDM systems is also large. Because of these large bandwidths, noise can not be assumed to be white with flat spectrum across subcarriers. The signal-to-noise ratio (SNR) is broadly defined as the ratio of the desired signal power to the noise power and has been accepted as a standard measure of signal quality for communication systems. Adaptive system design requires the estimate of SNR in order to modify the transmission parameters to make efficient use of system resources. Poor channel conditions, reflected by low SNR values, require that the transmitter modifies transmission parameters such as coding rate, modulation mode etc. to compensate channel and to satisfy certain application dependent constraints such as constant bit-error-rate (BER) and throughput. Dynamic system parameter adaptation requires a real-time noise power estimator for continuous channel quality monitoring and corresponding compensation in order to maximize resource utilization. Bit loading in DMT system is performed using the knowledge of SNR information in each subcarrier position in [1], and adaptive bit-loading is applied to OFDM systems in [2]. The knowledge of SNR also provides information about the channel quality which can be used by hand-off algorithms, power control, channel estimation through interpolation, and optimal soft information generation for high performance decoding algorithms. The SNR can be estimated using regularly transmitted training sequences, pilot data or data symbols (blind estimation). In this paper, we restrict ourselves to data aided estimation. In
conventional SNR estimation techniques for OFDM , the noise is usually assumed to be white and an SNR value is calculated for all subcarriers [3]–[5]. This assumption is removed in [6], [7] by calculating SNR values for each subcarrier. However, the correlation of the noise variance across subcarriers is not used in both papers as noise variance is calculated for each subcarrier separately. In [6], blind (expectation maximization (EM)) and decision-directed noise variance estimation algorithms are given. The noise variances are calculated separately for each subcarrier by assuming they are constant over time. SNR estimation for a 2×2 MIMO-OFDM system is presented in [7]. SNR is estimated using the preambles without the need for channel estimation. Two SNRs are defined, SNR per subcarrier and overall SNR. SNR per subcarrier is calculated by averaging four neighboring subcarriers. In this paper, the white noise assumption is removed and variation of the noise power across OFDM sub-carriers as well as across OFDM symbols is allowed. The noise variances at each subcarrier is estimated using a two dimensional MMSE filter whose coefficients are calculated using statistics of the noise. The paper focuses more on estimation of noise power, and assumes that the signal power, and hence SNR, can be estimated from the channel estimates. This paper is organized as follows. In next section, our system model is described. Section III explains the details of the proposed algorithms. Then, numerical results are presented in Section IV and the conclusions are given in Section V. II. S YSTEM M ODEL OFDM converts serial data stream into parallel blocks of size N and modulates these blocks using inverse fast Fourier transform (IFFT). Time domain samples of an OFDM symbol can be obtained from frequency domain symbols as xn (m)
=
N −1 �
Sn,k ej2πmk/N
0 ≤ m ≤ N − 1, (1)
k=0
where Sn,k is the transmitted data symbol at the kth subcarrier of the nth OFDM symbol and N is the number of subcarriers. After the addition of cyclic prefix and D/A conversion, the signal is passed through the mobile radio channel. At the receiver, the signal is received along with noise and interference. After synchronization and removal of the cyclic prefix1 , fast Fourier transform (FFT) is applied to the received 1 The length of the cyclic prefix is assumed to be larger than the maximum excess delay of the channel.
Time
signal to go back to the frequency-domain. The received signal at the kth subcarrier of nth OFDM symbol can then be written as 0 ≤ k ≤ N − 1, (2)
Zn,k
where Hn,k is the value of the channel frequency response (CFR), In,k is the colored noise caused by interferers or primary users, and Wn,k is the white Gaussian noise samples. We assume that the impairments due to imperfect synchronization, transceiver non-linearities etc. are folded into Wn,k and the CFR is not changing within the observation time. The white noise is modeled as a zero-mean Gaussian random variable with variance σ02 , i.e. Wn,k = N (0, σ02 ). The interference term is also modeled as a zero-mean Gaussian variable whose variance is a function of the symbol and 2 ), where σn,k is the subcarrier indices, i.e. In,k = N (0, σn,k local standard deviation. Note that although the time-domain samples of the interference signal is correlated (colored), the frequency-domain samples (In,k ) are not correlated, but their variances are correlated [8]. Assuming that the interference and white noise terms are uncorrelated, the overall noise � 2 ), where term Zn,k can be modeled as Zn,k = N (0, σn,k 2 � 2 2 σn,k = σn,k + σ0 is the effective noise variance. The goal � 2 of this paper is to estimate σn,k which can be used to find SNR or to measure the spectrum that the OFDM system is currently using. Note that if σ0 � σn,k , the overall noise can be assumed to be white and it is colored otherwise. The autocorrelation of the effective noise power is defined as � � 2 � 2 � (3) σn+τ,k+∆ , Rσ0� 2 (τ, ∆) = En,k σn,k where En,k {·} represents expectation over OFDM symbols and subcarriers. When the time dependency is dropped, the correlation of variance in the frequency dimension can be expressed as � � 2 � 2 . (4) Rσ0� 2 (∆) = Ek σk� σk+∆ III. D ETAILS OF THE P ROPOSED A LGORITHM In this paper, three different scenarios for the noise process Zn,k are considered: white noise, stationary colored noise, and non-stationary colored noise. The first one is the commonly assumed case, where the frequency spectrum of the noise is uniform. In the second scenario, we assume to have a strong interferer which has larger bandwidth than the desired OFDM signal. A strong co-channel interferer is a good example for this case. In the third one, an interferer whose statistics are not stationary with respect to time and/or frequency is assumed to be present. Adjacent channel interference or a cochannel interference with smaller bandwidth than the desired signal (narrowband interference) are examples of this type of interference. A scenario where the interference is not stationary in both time and frequency is illustrated in Fig. 1. Here, the statistics of noise components change as we move along the time or the frequency axis.
1111111 0000000 0000000 1111111 0000000 1111111 0000000 1111111 0000000 1111111
Fc Frequency
Yn,k = Sn,k Hn,k + In,k + Wn,k � �� �
Desired Signal
Interferer
Fig. 1.
Illustration of non-stationary interference.
The commonly used approach for noise power estimation in OFDM systems is based on finding the difference between the noisy received sample in frequency domain and the best hypothesis of the noiseless received sample [3]. It can be formulated as ˆ n,k Zˆn,k = Yn,k − Sˆn,k H
(5)
where Sˆn,k is the noiseless sample of the received symbol ˆ n,k is the channel estimate for the kth sub-carrier of and H nth OFDM symbol. The bias caused by incorrect hypothesis of data symbols Sˆn,k can be removed by using a look-up table or statistical relation between the true and estimated SNR values [6]. We propose to filter the noise variance estimates calculated at each subcarrier |Zˆn,k |2 using a 2D filter. Filtering will remove the common assumption of having the noise to be white and it will take the colored interference (both in time and frequency) into account. Let us represent the weighting factor at each subcarrier with wu,l . In this case, the estimate of the noise power at kth subcarrier of nth OFDM symbol can be written as 2 σ ˆn,k =
U L � �
wu,l |Zˆn+u,k+l |2 .
(6)
u=−U l=−L
where 2U + 1 and 2L + 1 are the dimensions of the filter in time and frequency directions respectively. � weighting � The coefficients should have a unity power, i.e. u l wu,l = 1. The two dimensional filter given by (6) can be very complex for practical implementation. To reduce the complexity, two cascaded 1D estimators in time and frequency may be used instead. This approach is valid when the variation of the noise variance in time and frequency dimensions are independent. For the rest of the paper, filtering in frequency direction will be considered and symbol index will be dropped for notational clarity. In this case, the estimator can be represented as σ ˆk2
=
L �
wl |Zˆk+l |2 .
(7)
l=−L
�L where wl satisfies l=−L wl = 1. The filter coefficients wl can be calculated using the statistics of the interference plus noise Zk . In this paper, we use a minimum mean-square error (MMSE) approach for finding these coefficients.
Estimation error at the kth subcarrier can be written as E(k) = =
σ ˆk2 − L �
where I is (2L + 1) × (2L + 1) identity matrix. The variance of the proposed estimator can be found by plugging (14) into (12) as
2 σk� 2 wl |Zˆk+l |2 − σk� .
(8)
l=−L
Note that the instantaneous errors (8) will be a function of the filter coefficients wl , the interference statistics, average interference power, and average noise power. Hence, ideally the optimum values for weighting coefficients will be different for each subcarrier. However, this requires knowledge of local statistics and has a large complexity. Hence, we use the same coefficients for whole subcarrier range. The filter coefficients can be calculated by minimizing the mean-squared-error (MSE), i.e by minimizing the expected value of the square of (8). The MSE can be formulated as
ρ = Ek [E(k)]2 � �2 L � 2 wl |Zˆk+l |2 − σk� (9) = Ek l=−L � L L � � = Ek wl wu |Zˆk+l |2 |Zˆk+u |2 l=−L u=−L
− 2σk�
2
L �
� wl |Zˆk+l |2 + σk�
4
(10)
l=−L
where Ek {·} represents expectation over subcarriers. By further simplification, (10) can be written in terms of the autocorrelation of the variance of the noise component Rσ�2 (τ, ∆) and the filter coefficients as � � L L � � 2 wl Rσ�2 (0) − 2 wl Rσ�2 (l) ρ= 1+ l=−L
+
L L � �
l=−L
wl wu Rσ�2 (l − u) .
(11)
l=−L u=−L
The weighting coefficients that minimizes (11) yield the MMSE solution. In order to find this solution, the derivative of MSE ρ with respect to filter coefficients can be set to zero. We can write (11) in matrix form for simplifying the calculations. Let w = [w−L · · · w0 · · · wL ]T be the coefficient vector, R = [Rσ�2 (−L) · · · Rσ�2 (0) · · · Rσ�2 (L)]T be the correlation vector, and Cσ�2 be the covariance matrix of size (2L+1)×(2L+1) with coefficients Cσ�2 (i, j) = Rσ�2 (i−j). Using these definitions, the MSE equation given in (11) can be represented in matrix form as ρ = Rσ�2 (0)(1 + wT w) − 2wT R + wT Cσ� 2 w .
(12)
The derivative of (12) with respect to the filter coefficients is ∂ ρ = 2Rσ�2 (0)w − 2R + 2Cσ� 2 w . (13) ∂w ∂ By setting the derivative to zero, i.e. ∂w ρ = 0, and arranging the terms, the coefficient vector might be calculated as w = (Cσ� 2 + Rσ�2 (0)I)−1 R.
(14)
ρ = Rσ�2 (0) − RT (Cσ� 2 + Rσ�2 (0)I)−1 R .
(15)
Note that the weighting coefficients depend on the statistics of interference and white noise. These statistics can be obtained by averaging since the processes are assumed to be stationary. A. Rectangular Window In order to decrease the computational complexity of the filtering algorithm, we propose an approximate method. Instead of using the weighting factor w for filtering, a simple rectangular window, i.e. a moving average window, is used. The dimensions of this filter (as OFDM symbol and subcarrier number) can be calculated using the statistics of the received signal. The filter coefficients in rectangular windowing case can be written as � 1/Lw −Lw ≤ l ≤ Lw � (16) wl = 0 otherwise where 2Lw + 1 is the length of rectangular window. For calculating the optimum window size, the MSE given in (11) can be minimized by excessive searching [9]. Moreover, the window size can also be calculated using the weight wl given in (14) by minimizing the error squared between the two coefficients as L �
Lw = arg min Lw
(wl − wl� )2 .
(17)
l=−L
Our results show that both methods for calculating Lw gave very close results, and the second method, i.e. calculation using (17), is used in this paper for finding the length of rectangular window. For calculating the noise variance at one subcarrier, 2L multiplications and additions are required in the MMSE filtering algorithm. On the other hand, only 2Lw additions and 1 division is required in the rectangular windowing algorithm. Although, the reduction in the computational complexity is large, the performance loss due to the rectangular windowing is not very big as will be discussed lated. B. Edges and Time averaging The filtering method given by (7) requires the noise estimates at L-many left and right subcarriers for estimating the variance at current subcarrier. This might be a problem at the edges of the spectrum as the weights are calculated by assuming that averaging can be done on both sides of the current subcarrier. In order to find the weighing values at the edges, (7) is modified and (14) is derived again. In order to find the noise variance at the right edge of the spectrum, for example, (7) can be updated as σ ˆk2 =
0 � l=−L
wl |Zˆk+l |2 .
(18)
0
10
0
10 −1
Normalized MSE
Normalized MSE
10
−2
10
−1
10
−2
10
−3
10
−3
Conventional MMSE Filtering Rectangular Window −20
−15
−10
−5 0 5 10 White <−− INR −−> Colored
15
Conventional MMSE Filtering Rectangular Window
10
20
−20
−15
−10
−5 0 5 10 Interference−to−noise ratio (dB)
15
20
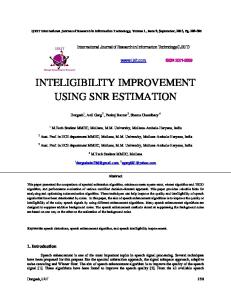
Fig. 2. Mean squared error for different algorithms as a function of the stationary interference to white noise power ratios.
Fig. 3. Mean squared error for different algorithms as a function of the non-stationary interference to white noise power ratios.
In this case, the formula for w given in (14) may be used for calculating the weighting coefficients. However, the definition of w and R should be updated as w = [w−L · · · w0 ]T and R = [Rσ�2 (−L) · · · Rσ�2 (0)]T .
V. C ONCLUSION
IV. N UMERICAL R ESULTS An OFDM system with 512 subcarriers and 20MHz bandwidth is considered for testing proposed algorithms. The stationary interference is assumed to be caused by a co-channel user transmitting in the same band with the desired user, and a co-channel signal with 3MHz bandwidth is used to simulate the non-stationary interference. We use averaging over 20 OFDM symbols and consider estimation over subcarriers only, i.e. wn,k = wk , but the results can be generalized to two dimensional case as mentioned earlier. The length of the MMSE filter is set to 120, i.e. L = 60. The MSE performances of the conventional, MMSE filtering, and rectangular window algorithms are given in Figs. 2 and 3. Note that the MSE performances are given in logarithmic scale. Fig. 2 gives the MSEs as a function of the stationary interference to white noise power ratio and Fig. 3 gives the MSEs as a function of the non-stationary interference to white noise power ratio. The total noise plus interference power is kept constant for both figures. When the ratio is very small (e.g. -20dB), the total noise can be considered as white noise, and conventional algorithm performs best because its inherent white noise assumption is true, and the estimation error increases as the total noise becomes more colored for all three methods. The proposed filtering algorithms has considerable performance gain over conventional one. The rectangular window based algorithm has very close performance to the MSE filtering, and it may be preferable in practical applications because of its lower complexity.
In this paper, a new noise variance estimation algorithm for OFDM systems is proposed. The proposed method removes the common assumption of white Gaussian noise and considers colored noise. Noise variance, and hence SNR, is calculated by using two cascaded filters in time and frequency directions whose coefficients are calculated using the statistics of noise/interference variance. Simulation results show that the proposed algorithm out-performs conventional algorithm under colored noise cases. R EFERENCES [1] P. Chow, J. Cioffi, and J. Bingham, “A practical discrete multitone transceiver loading algorithm for data transmission over spectrally shaped channels,” IEEE Trans. Commun., vol. 43, no. 234, pp. 773–775, Feb./Mar./Apr. 1995. [2] S. Thoen, L. Van der Perre, M. Engels, and H. De Man, “Adaptive loading for OFDM/SDMA-based wireless networks,” IEEE Trans. Commun., vol. 50, no. 11, pp. 1798–1810, Nov. 2002. [3] S. He and M. Torkelson, “Effective SNR estimation in OFDM system simulation,” in Proc. IEEE Global Telecommunications Conf. (Globecom), vol. 2, Sydney, NSW, Australia, Nov. 1998, pp. 945–950. [4] X. Xu, Y. Jing, and X. Yu, “Subspace-based noise variance and SNR estimation for OFDM systems,” in Proc. IEEE Wireless Commun. and Networking Conf., vol. 1, New Orleans, LA, Mar. 2005, pp. 23–26. [5] D. Athanasios and K. Grigorios, “SNR estimation algorithms in AWGN for HiperLAN/2 transceiver,” in Proc. International Conf. on Mobile and Wireless Comm. Networks, Marrakech, Morocco, Sept. 2005. [6] C. Aldana, A. Salvekar, J. Tallado, and J. Cioffi, “Accurate noise estimates in multicarrier systems,” in Proc. IEEE Veh. Technol. Conf., vol. 1, Boston, MA, Sept. 2000, pp. 434–438. [7] S. Boumard, “Novel noise variance and SNR estimation algorithm for wireless MIMO OFDM systems,” in Proc. IEEE Global Telecommunications Conf. (Globecom), vol. 3, Dec. 2003, pp. 1330–1334. [8] M. Ghosh and V. Gadam, “Bluetooth interference cancellation for 802.11g WLAN receivers,” in Proc. IEEE Int. Conf. Commun., vol. 2, May 2003, pp. 1169–1173. [9] T. Y¨ucek and H. Arslan, “Noise plus interference power estimation in adaptive OFDM systems,” in Proc. IEEE Veh. Technol. Conf., Stockholm, Sweden, May 2005.