Journal of Mining Science, Vol. 46, No. 4, 2010
MINERAL MINING TECHNOLOGY DYNAMIC OPTIMIZATION MODEL FOR MINING EQUIPMENT REPAIR BY USING THE SPARE-PARTS INVENTORY
Darko Louit, Rodrigo Pascual*, and Andrew Jardine**
UDC 622.831:550.32
We present the dynamic control system for the service rate in an M/M/1 queuing system, to optimize the inventory of critical repairable spare components for a fleet of mobile equipment in presence of an adjustable single server repair facility, namely, the repair rate can be expedited or slowed down. We consider the normal and expedited rates, when the faster repair rate implies higher repair costs. The repair rate selection depends on the number of units in operational condition; actual operating units plus stock on hand is generated at the moment of demand for a spare. The resulting optimal policy is to minimize the expected cost per unit time for the inventory system in the long run. Stochastic processes, dynamic control, spare parts, expedited repair, inventory, queueing INTRODUCTION
It is common of critical repairable components, when a component fails or is preventively removed from operation, a spare unit takes its place to reduce downtime. The removed component is repaired or reconditioned at a repair facility and is placed in stock until it is needed. The use of flexible labor (i), subcontracting (ii), or proactive use of overtime (iii) can expedite the repair rate [1]. These alternatives and their impact on the repair rate are briefed on in [2]. The decision to recur to additional resources for expediting repair of a particular component in emergency situations is similar to the decision of issuing an expedited replenishment order for a spare part in the case of disposable parts. Obviously, emergency situations are less likely to occur if a larger inventory is kept at hand. A trade-off exists between emergency repair and inventory size, viz., capital invested in inventory. Under assumption that a single server repair facility is available and the demand for spare parts is represented by a Poisson process or exponentially distributed times between demands, then the inventory system can be represented by a simple M/M/1 queue. It is important that if there are several components in operation, we are only interested in the pooled demand for spares. The pooled output of several independent processes tends to be or at least well approximated by Poisson process. The theoretical foundation of this statement is given by Palm’s Theorem [3], which states that under mild assumptions the distribution of the total number of events or demands, coming from different independent renewal processes in a fixed time interval tends to a Poisson distribution when the number of processes increases. In that case inter-demand intervals for the superposed process are exponentially distributed. Complex critical repairable components used to fail in various ways. Time to any failure of an individual component can usually be represented by an exponential distribution [4], so the Poisson demand assumption is in point even for a small number of identical components in operation. When Centro de Mineria, Pontificia Universidad Catόlica de Chile, Santiago, Chile. *University of Chile, E-mail:
[email protected], Santiago, Chile. **University of Toronto, Toronto, Chile. Translated from Fiziko-Tekhnicheskie Problemy Razrabotki Poleznykh Iskopaemykh, No. 4, pp. 41-49, July-August, 2010. Original article submitted February 12, 2009. 394
1062-7391/10/4604-0394 ©2010 Springer Science + Business Media, Inc.
analyzing at the component level, it is unreasonable to assume a single repair server, since it is uncommon that the repair shop can be specified for a single component type at the same time, moreover, the shop can concurrently repair different types of components. The similar assumption can be valid for limited resources, namely, specialized tools, adequately trained trades, available to fulfill special jobs in the repair facility. A higher repair rate involves the increase in these resources by one of the above alternatives with inevitable additional costs. Selection of the repair frequency, its kind or rate can then be approached by a dynamic control model, which considers costs of a service rate. Here we use a dynamic model to control a service rate in a single-server queuing system and an enumeration routine to find an optimal stockholding policy in a single-echelon spare parts inventory with two options of repair types: normal and expedited, and exponentially distributed repair times. The model is designed to find the stock size and expedited repair trigger level, that optimizes performance of the inventory system. The optimization criterion is minimization of cost. The trigger level, being the number of operational units below which expedited repair is chosen, happens to be not only positive. The choice of an expedited repair is obvious at low values of parameters, the urgency level is not always a positive magnitude. Dynamic control of an M/M/1 queuing system is addressed by several authors. In all the cases the optimal policy is one that minimizes costs by selecting optimal service rates. Service rates might be state-dependent. In [5] the author analyzes a dual-source production inventory model, where items can be produced at primary or contingency facilities to fulfill demand spikes. In [6] researchers develop a method for computing the optimal policy in a single server queue with Poisson arrivals, viz., the arrival rate is constant at an infinite calling population. As a result of their calculations, they prove the existence of a monotonic optimal policy. In fact, monotonicity of the optimal policy when a service rate increases with repair queue length, is proved by several researchers. Publication [7] provides rigorous proofs for the monotonicity of the optimal policies, even in the case of a state-dependent arrival rate. But it was Crabill, who was the first to prove this statement although under stronger assumptions [8]. Furthermore, researchers [7] also prove rigorously the existence of a stationary policy, which can be optimal. Note, a policy is considered a stationary one if the same service rate µi is chosen whenever the system enters i -state. Necessary conditions for an optimal policy to be stationary are also described in [8]. Moreover, the author stated conditions for a stationary policy to be simple: the service rate is non-increasing with the number of components in good condition, i.e. the optimal policy is monotonic and stationary. We extend his model to a different cost structure in order to consider four cost sources: costs of capital invested in spare components, inventory holding costs, stock-out or shortage costs, and repair costs. Additionally, we consider the case where some costs are incurred when the system undergoes a state transition. Solving the dynamic control model allows for the determination of the optimal repair rate selection policy for a given stock size S . Enumeration over the decision variable S will allow for the determination of the optimal stockholding policy of form S$ , χ , where S$ is the optimal stock size and χ is the optimal expedited repair trigger level.
( )
MODEL FORMULATION
Queuing model Let group of m identical components be in operation. This group is supported by an inventory of spare components of maximum size S . The total number of components in the system is obviously m + S.
395
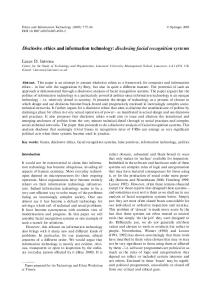
Fig. 1. The modified system consisting of operation and repair subsystems [8]
The complete system can then be divided into two subsystems: operation and repair (Fig. 1). The operation subsystem is composed of m operating components and the spares stock, which can be interpreted as a queue of components waiting to enter production. The repair subsystem is simply the repair facility; where there is a queue of items waiting for repair and one server with two possible service rates; extension to multiple service rates is straightforward. It is assumed that once a component is repaired, it is recovered into an as-good-as-new condition. Therefore, the number of components in good condition at any instant is given by the number of operating units plus units held in stock. Failure of individual components can be expressed as a general time to failure distribution, F (t ) . Since we are interested in the superposed demand process for the whole population, it is not necessary for F ( t ) to be the exponential distribution in order to use an M/M/1 model. Recall that if the
population size is relatively large, superposed demand can be approximated by a Poisson process; even if individual components fail according to a different underlying time to failure distribution by Palm’s theorem. Under this assumption, and if no preventive replacement policy is applied, a replacement rate for an individual component, λ , can be calculated as 1 MTBF , where MTBF is the mean time between failures obtained from the failure time distribution F ( t ) . When an age-based preventive replacement policy is underway, with preventive replacement time t p , then λ is calculated as 1 MTBR , where MTBR is the mean time interval between replacements, that is: tp
∫
MTBR = [1 − F ( x)] dx .
(1)
0
Let i be the state of the system, 0 ≤ i ≤ m + S indicating the number of units in good condition; then the number of units in operation, n , is given by:
n = min{i, m} .
(2)
The pooled demand rate is nλ (arrival rate of demand is dependent on the number of units in operation). Note that in the case of repairable components, if a preventive replacement policy is being enforced and we assume that both failed and preventively removed items undergo a reconditioning or repair process before being sent back to stock; we will have a “pool” of spare components, from where both preventive and corrective replacements will be satisfied. We define the available pool, or stock at hand, s , as:
s = (i − m) + , where x + = max{0, x} . 396
(3)
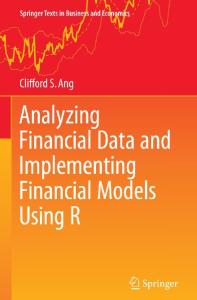
Fig. 2. Markov process
The service rate at the repair facility (repair rate) is either µ1 or µ2 , depending on whether repair is normal or expedited, respectively. It is assumed that µ1 < µ2 . The maintenance system can therefore be described using Markov process, presented in Fig. 2. For this Markov process, transition rates depend on the action k employed. Possible actions are selection of normal or expedited repair, that is k = 1, 2. Transition rates a(i, j, k) are given by:
a(i, i + 1, k ) = µ k , i = 0, 1, ..., m + S − 1 ,
a(i, i − 1, k ) = λ n , i = 1, 2, ..., m + S , a(i, j , k ) = 0 ,
(4)
j ≠ i + 1, i, i − 1 .
COST MODEL
We consider the following cost rates: cost of capital, operational holding cost, which depends on the stock at hand; shortage cost; and repair cost. All costs are expressed as rates (that is, on a per unit per unit time basis) to facilitate calculation of the optimal rate selection policy. The cost of capital is: K = c× S , (5) where c is the cost of capital expressed as a percentage of the price of one spare item per unit time. Note that the cost of capital K is independent on the state of the system, as we assume capital costs are incurred by all spare components, all the time, thus the cost of capital only depends on the initial stock size. The operational holding cost H (i ) depends on the state of the system and is given by:
H (i ) = h × s = h × (i − m) + ,
(6)
where h is operational holding cost per unit per unit time. The shortage cost SC (i ) also depends on the state of the system as it is incurred only when no spears are available, in other words, when there is downtime due to the lack of spare parts. It is given by: SC (i ) = c S × (m − i ) + ,
(7)
where cS is the shortage cost per unit per unit time. Repair costs are nr and er for normal and expedited repair, respectively, at nr < er . The operational holding cost and the shortage cost for state i can be interpreted as the amount of money spent per unit time, the system is in state i due to availability and shortage of spares, respectively. We assume that the repair cost, on the other hand, is incurred whenever the system performs a transition from state (i – 1) to state i , no matter, whenever a repair is completed. However, 397
we need to express all costs as rates in order to facilitate calculation of the optimal policies. A total spending rate of the system for every possible state i , i = 0,1,K , m + S , including capital cost, operational holding cost, repair costs and shortage costs can be obtained for every possible action. Spending rates are normally referred to as earning rates in the literature, though here we make the distinction as the model at hand deals with costs, not positive rewards. The quantity qik is defined as the spending rate of the system, when it is in state i and action k is chosen [9]: qik = rii +
∑ a(i, j, k )r
k ij
,
(8)
j ≠i
where rii is the sum of costs incurred per unit time the system remains in state i ; and rijk is the cost associated to a transition from state i into state j , if action k is taken. Note that in our case rijk = 0 when j ≠ i + 1 . Therefore, we can rewrite Eq. (8) as: qik = rii + a (i, i + 1, k )rik,i +1 .
(9)
For the inventory system analyzed, rii = K + H ( i ) + SC ( i ) ; and ri k,i +1 = nr , if normal repair is selected ( k = 1 ), or ri k,i +1 = er , if expedited repair is selected ( k = 2 ), for 0 ≤ i ≤ m + S − 1 . Obviously rijk = 0 when i = m + S , for all k .
A repair rate selection policy f is a vector with elements f ( i ) = k , indicating that the action k is to be taken when the system is in state i . A repair rate selection policy will be optimal if it minimizes the expected cost per unit time of the system. CHARACTERIZATION OF THE OPTIMAL POLICY
As it was mentioned earlier in the paper, the calculation of the optimal stockholding policy can be viewed as a two-dimensional problem. The first, say, inner dimension is dedicated to finding the optimal repair rate selection policy for a given stock size, termed as a stock-specific optimal policy, f * . The outer dimension is dedicated to finding the optimal stock size S$ , bounded above by S * , where S * is the optimal stock size for the case in which only a single normal repair rate is available. In [8] authors state for the repair rate selection problem that a stationary policy f * will minimize the expected cost per unit time if the following necessary and sufficient condition is held: there exist g and Vi , with i = 0,1,K , m + S , such that for each i , if f * ( i ) = k , then: m+ S
m+ S
j =0
j =0
g = qik + ∑ a (i, j , k )V j ≤qin + ∑ a (i, j , n)V j ,
for all n ≠ k .
(10)
In Eq. (10), g is the minimum expected cost rate and {V j } are relative values (determined through a value determination operation – details can be found in most texts on Markov decision processes, see e.g. [9, 10]). Algorithms (9, 10) involving operations of value determination and a policy improvement routine, will yield the optimal repair rate selection policy f * as a vector of the type: f * = (k0 , k1,..., km + S −1 ) ,
where ki is the optimal repair rate when the system is in i-state. 398
(11)
Policy f * is a stock-specific optimal policy for a given stock size S . By applying the procedure for different levels of S , S ∈ 0, S * , we can obtain the overall S$ optimal policy fˆ along with optimal
[
]
stock size S$ , that yields the minimum cost. Note that when the resulting optimal policy is of the type: fˆ = (2,...2, 1,...1) , (12) the state iˆ at which the decision changes, will be an indication of the stock trigger level for expedited ∧ repair s = i − m = χ at i = $i . This quantity can take negative values, indicating that it is optimal to select an expedited repair rate when a certain number of backorders has occurred. Adopting definitions provided by [5] for a production inventory system, we will say that a policy is preventive if the trigger level is χ > 0 ; or reactive if χ ≤ 0 (note, that at χ = 0 the expedited repair option is adopted when the first backorder occurs). In [8] the researcher defines a policy of the type represented in Eq. (12) as a simple policy (monotonic and stationary, note that a policy where all f * ( i ) = c , with c constant, is also simple). In our context, a simple policy is one where the repair rate is non-increasing with the number of components in good condition and the same rate of repair µ ( i ) is chosen every time the system is in state i . As it was mentioned in the introduction, sufficient conditions for obtaining a simple optimal policy in a multiple service rate system were first stated in [8]. Similarly, the authors [7] also give a set of sufficient conditions for monotonicity in the general case of state-dependent arrival rates. In these references, cost is a non-decreasing function of the repair queue length. In other words, total cost is composed of two components: the first one depends on the number of units in good condition (and is non-increasing in i , the number of units in good condition, or equivalently non-decreasing in the repair queue length) and the second depends on the service rate selected. In our model the component of cost depending on the number of units in good condition increases in i (when i > m ) due to increases in the operational holding cost of the spare parts inventory as the number of units in stock grows. This means that the repair rate selection is non-increasing in i when i > m . The optimal policy will therefore be simple if the subset f * ( i ) , i ≤ m is in turn simple and f * (m + 1) ≥ f * (m) . For systems with two repair rates like the one studied here, if 0 < µ1 < µ2 < ∞ and 0 < ri1 < ri 2 ,
where ri k is the repair cost per unit time incurred in state i if action k is selected, the optimal policy being simple if: SC (i ) − SC (i + 1) > λ
or equivalently: cS > λ
ri2 − ri1 µ2 − µ1
for 0 ≤ i < m ,
er µ2 − nr µ1 . µ2 − µ1
(13)
Conditions 0 < µ1 < µ2 < ∞ and 0 < ri1 < ri 2 are satisfied by the problem definition, as the emergency repair rate is assumed greater than the normal repair rate, and the cost of the emergency repair is higher than that of normal repair. If the condition in Eq. (13) is not fulfilled, then the optimal repair rate selection policy gets complicated. 399
It is essential that the optimal stockholding policy will be defined by the optimal stock size S$ and a unique trigger level χ only when the stock-specific optimal policy for S$ is simple. In the case of a simple repair rate selection policy, the trigger level indicates the inventory level below which an expedited repair rate is selected. If the policy is not simple, then the optimal stockholding policy will consist of more than one “trigger level” (some of them indicating a shift to an expedited repair rate, and others indicating a shift back to a slower repair rate in an alternating order). In this case, the optimal stockholding policy will be of the general form S$ , χ , χ ,K , χ at 2 ≤ n ≤ m + S . Note that in an
(
1
2
n
)
industrial setting for critical repairable components which are usually slow-moving, relatively expensive parts, with high associated stock-out penalties, the condition in Eq. (13) will be likely met, thus the stock-specific optimal policy will be simple, and the optimal stockholding policy will be of the form S$ , χ . That is, only one trigger level is identified, with the trigger level indicating the stock level
( )
below which the expedited repair rate will be selected. APPLICATION OF THE APPROACH PROPOSED
An open pit coal mining company operates the fleet of 25 Caterpillar D9L dozers. The diesel engine is obviously a critical power train component for these dozers. Whenever a diesel engine fails, or is preventively removed from a dozer, it is sent to a repair shop for repair/reconditioning. Once repaired, the diesel engine is sent back to stock, i.e. the company supports the operation of the fleet using a pool of spare diesel engines. Currently the size of the pool at the mine is 6 dozer diesel engines. Failure data for this engine type was available for a period of 17 months (sample contained 20 failures). Time to failure was modeled using a two-parameter Weibull distribution with estimated shape parameter β = 1.46 and scale parameter η = 18,952 operational hours. At the time of the data collection a preventive replacement policy was in place for the diesel engines, at age t = 12, 000 operational hours. Since the number of units in operation is relatively large ( m = 25 ) it is assumed that superposition of demand for spares coming from the fleet of dozers can be approximated by a Poisson process. The arrival rate of demands per an operating hour for an individual component calculated from Eq. (1) is λ = 0.000104 , with MTBR = 9, 635 operating hours. The engines are repaired by two technicians, the only people to work on repairs of this engine type, one engine at a time, both technicians working on the same engine. On the average, it demands 280 man-hours for a repair to be completed. Taking into account the technicians’ days off, the mean time to repair/reconditioning for the diesel engines was estimated by maintenance engineers at the mine to be 15 days. Expressing this value in operating hours (for consistency, using the average fleet availability and utilization) yields a normal mean time to repair of MTTRN = 226 operation hours. This gives a normal repair rate µ1 = 0.0044 repair/operation hour. Maintenance engineers at the mine believe that the time to repair an engine can be reduced to 4 days, with additional allocation of technicians to the task and working overtime and nights at an increased fee. With this, the expedited mean time to repair is MTTRE = 60 operational hours and the expedited repair rate is µ2 = 0.0167 repairs/op. hour. We assume that the materials needed for a repair under normal or expedited conditions remain the same. 400
TABLE. Stock-Specific Repair-Rate Selection Policies Policy
S 0 1 2 3 ( S* )
i* 25 25 25 25
Cost ($/oper. h) 112.76 84.32 81.43 82.51
6
Current policy 0 (none of expedited repair)
86.76
Sˆ = 2
Overall optimal stockholding policy iˆ = 25 , χ = 0
Min cost = 81.43
The direct cost of a normal repair is estimated by the company at nr = $26.000 : 40 % labor and 60 % materials. When the repair is carried out under expedited conditions and due to the use of overtime, a 35 % increase in labor costs is observed. Thus the expedited repair cost is estimated at er = $29.6400 . The purchase price of a diesel engine is $50,000. We assume that the cost of capital rate c is 12 % of the component value per annum; and that the operating holding cost per unit h is 8 % of the component value per annum. Average utilization of the dozers is 459 operating hours per a month. Since a dozer can not operate without the diesel engine, shortage of spare components implies equipment downtime. The mining company values the downtime of a dozer at $200 per operating hour, thus, cs = 200 . We can verify that the condition (13) is satisfied, so that stock-specific optimal policies will be simple. The stock size, minimizing cost per unit time for this inventory system, when only the normal repair alternative is available, is S * = 3 (calculation of this upper bound for S was performed using a simpler spare parts inventory optimization model, when demand and repair follow a Poisson process [11]. Note, that the stock level used by the company is twice as large as S * . Stock-specific optimal policies for stock levels S ≤ S * = 3 were calculated using the dynamic control model discussed in the present paper (see the Table). It can be observed that the overall minimum average cost in the long-run is achieved when the stock size is S$ = 2 , at $81.43 per unit time. The respective optimal repair rate selection policy is indeed simple and $i = 25 . Therefore, the optimal stockholding policy for this example is S$ , χ = ( 2, 0 ) . That is, the optimal stockholding policy is
( )
reactive in this case (trigger stock level for expedited repair is χ = 0 ). Note that in the Table the current policy is also included, where no expedited repair decision is in place and S = 6 . Using the optimal policy can also provide reduction in attractive inventory cost in addition to the reduction of the size of the component pool (the cost per unit time includes the expected repair cost, along with shortage, capital and inventory holding costs). In this case every stock-specific rate selection policy resulted in the expedited repair option selected because of the stock depletion, viz., corresponding policies are reactive. The optimal rate selection policies tend to be preventive ( χ > 0 ) for the cost-intensive spare-part shortage. For example, changing the shortage cost from cs = 200 to cs* = 2000 yields a stock size S = 2 and a trigger level 401
χ = 1 (or equivalently i* = 26 ). This means that a higher shortage cost might imply selection of the expedited repair rate when the stock at hand is positive. On the contrary, lower shortage costs can generate negative trigger levels. Higher expedited repair costs have the similar effect. In the extreme case when the cost of expediting repair is large and the benefit due to it is small (small expedited to normal repair ratio), then the trigger level moves toward its lower bound χ = 0 , which indicates that the expedited option is never selected. The optimal policy in our model minimizes the expected cost per unit time, thus, the reduction in the capital invested in the stock is not considered directly (size of stock is indirectly accounted for through the cost of capital and holding costs). In view of the above, the model presented can be specifically implemented to elaborate the policy that minimizes the present value of costs (including investment) over a determined period of time. The model is applicable to find the optimal repair-rate selection policy for different stock levels, to estimate the expected cost per a unit time in each case, and to compare the new determined policies through the use of a discounted cash flow analysis (assuming annual utilization of the equipment) that incorporates investment into the calculations. Alternatively, reductions in current spare-part inventory might generate positive cash flows for the company that should also be considered in a net present value analysis. In the case of mobile mining equipment fleets (haul trucks, shovels, drills and auxiliary equipment) one can find numerous different components with unitary prices in excess of tens of thousands (and even hundreds of thousands) dollars, with high associated inventory carrying costs. Therefore, the expected benefits of a model under consideration in the present paper can be higher, when the alternative to expedite repair is available. CONCLUSIONS
An extension of the dynamic control model for a single-server queuing system with adjustable service rate [8] is presented to accommodate the determination of the optimal stockholding policy for a repairable spare parts inventory system with two repair rates: normal and expedited. The model uses a distinct cost structure that considers four sources of cost for the system: capital cost of the complete stock, operational holding cost for the stock at hand, shortage or stock-out cost, and repair cost, which is influenced by the inventory policy. In addition, we present an example to illustrate the application of the model, which uses a policy iteration algorithm to work out the optimal control policy for the repair rate, the stock level; and an enumeration procedure for the stock size decision variable, and to find the optimal stockholding policy. Conditions required for the optimal control policies to be monotonic are identified. The industrial study case confirms our expectations in attractive benefits which be achieved by the use of the optimal control policy for the rate of component repair. The authors would like to acknowledge the collaboration of the company that made the data for the application study available, which for confidentiality reasons will remain anonymous. We are particularly grateful of the insights provided by a senior reliability engineer at the mine, who was very familiar with the maintenance of the fleet analyzed. REFERENCES
1. G. D. Sccuder, “An evaluation of overtime policies for a repair shop,” J. Oper. Manag., No. 6 (1985). 2. A. Sleptchenko, M. C. van der Heijden, and A. van Harten, “Trade-off between inventory and repair capacity in spare parts networks,” J. Oper. Res. Soc., 54 (2003). 402
3. M. J. Carrillo, “Extensions of Palm’s theorem: a review,” Manag. Sci., 37 (1991). 4. A. K. S. Jardine and A. H. C. Tsang, Maintenance, Replacement and Reliability: Theory and Applications, CRC Press, Boca Raton (2006). 5. J. R. Bradley, “Optimal control of a dual service rate M/M/1 production-inventory model,” Eur. J. Oper. Res., 161 (2005). 6. J. M. George and J. M. Harrison, “Dynamic control of a queue with adjustable service rate,” Oper. Res., 49 (2001). 7. S. Stidham and R. R. Weber, “Monotonic and insensitive optimal policies for control queues with undiscounted costs,” Oper. Res., 37 (1989). 8. T. B. Crabill, “Optimal control of a maintenance system with variable service rates,” Oper. Res., 22 (1974). 9. R. A. Howard, Dynamic Programming and Markov Processes, M. I. T. Press, Cambridge (1960). 10. M. L. Puterman, Markov Decision Processes: Discrete Stochastic Dynamic Programming, Wiley, New York (1994). 11. D. Louit, D. Banjevic, and A. K. S. Jardine, “Optimization models for critical spare parts inventories — a reliability approach,” submitted to Eur. J. Oper. Res., available upon request (2005).
403