J. Mol. Biol. (1998) 279, 271±286
Conformational Stability and Thermodynamics of Folding of Ribonucleases Sa, Sa2 and Sa3 C. Nick Pace1,2,3*, Eric J. Hebert2, Kevin L. Shaw2, David Schell1 Valentin Both4, Daniela Krajcikova4, Jozef Sevcik4, Keith S. Wilson5 Zbigniew Dauter5, Robert W. Hartley6 and Gerald R. Grimsley1 1
Department of Medical Biochemistry and Genetics and 2 Department of Biochemistry and Biophysics and 3Center for Macromolecular Design, Texas A&M University, College Station, TX 77843, USA 4
Institute of Molecular Biology of the Slovak Academy of Sciences, Dubravska cesta 21 842 51 Bratislava, Slovak Republic 5
Department of Chemistry University of York, Heslington York, YO1 5DD, UK 6
Laboratory of Cellular and Developmental Biology, National Institutes of Health Bethesda, MD 20892, USA
Ribonucleases Sa, Sa2, and Sa3 are three small, extracellular enzymes produced by different strains of Streptomyces aureofaciens with amino acid sequences that are 50% identical. We have studied the unfolding of these enzymes by heat and urea to determine the conformational stability and its dependence on temperature, pH, NaCl, and the disul®de bond. All three of the Sa ribonucleases unfold reversibly by a two-state mechanism with melting temperatures, Tm , at pH 7 of 48.4� C (Sa), 41.1� C (Sa2), and 47.2� C (Sa3). The Tm values are increased in the presence of 0.5 M NaCl by 4.0 deg. C (Sa), 0.1 deg. C (Sa2), and 7.2 deg. C (Sa3). The Tm values are decreased by 20.0 deg. C (Sa), 31.5 deg. C (Sa2), and 27.0 deg. C (Sa3) when the single disul®de bond in the molecules is reduced. We compare these results with similar studies on two other members of the microbial ribonuclease family, RNase T1 and RNase Ba (barnase), and with a member of the mammalian ribonuclease family, RNase A. At pH 7 and 25� C, the conformational stabilities of the ribonucleases are (kcal/ mol): 2.9 (Sa2), 5.6 (Sa3), 6.1 (Sa), 6.6 (T1), 8.7 (Ba), and 9.2 (A). Our analysis of the stabilizing forces suggests that the hydrophobic effect contributes from 90 to 110 kcal/mol and that hydrogen bonding contributes from 70 to 105 kcal/mol to the stability of these ribonucleases. Thus, we think that the hydrophobic effect and hydrogen bonding make large but comparable contributions to the conformational stability of these proteins. # 1998 Academic Press Limited
*Corresponding author
Keywords: ribonucleases; protein folding; protein stability; thermal denaturation; disul®de bonds
Introduction Ribonucleases (RNases) may be the oldest enzymes, so perhaps it is not surprising that they are involved in such a wide range of functions (Schein, 1997; D'Alessio & Riordan, 1997). The two best characterized families are the mammalian RNases and the microbial RNases. The mammalian RNases, of which RNase A is the best known member, are the most rapidly evolving protein family (Rosenberg et al., 1995), and include such RNases as angiogenin, which stimulates blood vessel development, and onconase which is now in clinical trials for cancer treatment (Schein, 1997). The ®rst member of the microbial RNase family to Abbreviations used: DSC, differential scanning calorimitry; ASA, accessible surface area. 0022±2836/98/210271±16 $25.00/0/mb981760
be identi®ed was RNase T1 (Sato & Egami, 1957). This eukaryotic RNase was found in the culture medium of the fungus Aspergillus oryzae, which has been used in making sake since at least the eighth century and in the production of soy sauce (Takamine, 1914). The folding of RNase T1 has been studied in detail (De Vos et al., 1998; Myers et al., 1997; Steyaert, 1997; Mayr et al., 1996; Pace et al., 1991). RNase Ba, from Bacillus amyloliquefaciens strain H, was the ®rst prokaryotic RNase to be identi®ed and puri®ed (Nishimura & Nomura, 1959), and its potential usefulness as a protein folding model was shown by Hartley (1968). (RNase Ba is more often known as barnase, but for convenience and consistency with the nomenclature of the other RNases we will use RNase Ba in this paper.) Subsequently, the folding of RNase Ba has been studied in depth by the Fersht laboratory (see Johnson et al. (1997) for a recent reference). To # 1998 Academic Press Limited
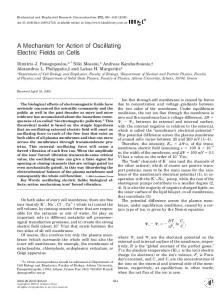
272 date, over 40 microbial RNases have been identi®ed (Hartley, 1997). Members of the mammalian and microbial RNase families share a small size and a similar mechanism of action. The Streptomyces are Gram-positive ®lamentous bacteria that are used industrially for the production of several antibiotics. Strains of Streptomyces aureofaciens are used to produce the antibiotic chlortetracycline, and they also synthesize and secrete into the growth medium a small RNase (Bacova et al., 1971). The RNases from three of these strains have been characterized and named RNase Sa from strain BMK, RNase Sa2 from strain R8/26, and RNase Sa3 from strain CCM 3239 (Hartley et al., 1996; Hebert et al., 1997). These Sa RNases are members of the microbial ribonuclease family (Hartley, 1980; Hill et al., 1983). We have expressed RNases Sa, Sa2, and Sa3 in Escherichia coli and developed puri®cation procedures that yield from 10 to 50 mg of protein per liter of culture medium (Hebert et al., 1997). RNase Sa is the best characterized of the three enzymes. Crystal structures of native RNase Sa have been Ê resolution (Sevcik et al., 1991), determined at 1.8 A Ê resolution (Sevcik et al., 1996), and most at 1.2 A Ê resolution (Sevcik et al., unpubrecently at 1.0 A lished observations). In addition, a number of crystal structures have been determined with nucleotides bound (Sevcik et al., 1990, 1993a,b). A solution structure is currently being determined by NMR (M. Rico et al., unpublished observations). Thus, the folded conformation of RNase Sa is extremely well characterized. We have recently completed crystal structures of RNases Sa2 and Ê resolution (Sevcik et al., unpublished Sa3 at 1.7 A observations). A ribbon diagram of RNase Sa is shown in Figure 1. The structures of RNases Sa2 and Sa3 are very similar to that of RNase Sa, which is not sur-
Microbial Ribonuclease Stability
prising since the three proteins have identical amino acids at 48 of 96 residues (Figure 2). RNase Sa is the smallest microbial RNase with 96 residues and it is in the a b family of proteins with a three-turn a-helix packed against a ®ve-stranded antiparallel b-sheet to form the hydrophobic core. The Sa RNases contain a single disul®de bond linking Cys residues near the ends of the molecules, e.g. residues 7 and 96 in RNase Sa. When the disul®de bond is broken, the proteins still fold, but the Tm values are lowered from near 50� C to near 20� C (see below). Consequently, at 37� C either the folded protein (disul®de intact) or the unfolded protein (disul®de broken) can be studied, and this is a useful feature. Thus, these RNases can serve as excellent models for both the folded and unfolded states of proteins. The amino acid sequences of RNases Sa, Sa2, Sa3, Ba, and T1 are aligned in Figure 2 with the conserved active site residues printed in boldface. All ®ve of these enzymes cleave single-stranded RNA molecules speci®cally on the 30 side of guanosine nucleotides. Compared to the 96 residues of RNase Sa , the percent identities are 69% for Sa3, 56% for Sa2, 23% for Ba, and 11% for T1. RNases Sa, Ba, and T1 have remarkably similar tertiary structures in the b-sheet regions near the active sites, but there are substantial differences in the a-helices and turns as shown in Figure 1. Here we report studies of the conformational stability and thermodynamics of folding of RNases Sa, Sa2, and Sa3. We compare these results with similar studies on RNases Ba and T1, and with studies of mammalian RNase A, a structurally unrelated enzyme with a similar function. Thus, we show how the changes in amino acid sequence have effected the thermodynamics of folding of closely and distantly related relatives in the microbial RNase family. We also compare the con-
Figure 1. Ribbon diagrams of RNases Sa, T1, and Ba drawn using MOLSCRIPT (Kraulis, 1991) and the following Protein Data Bank entries: 1RGG for RNase Sa, 9RNT for RNase T1, and 1RNB for RNase Ba.
273
Microbial Ribonuclease Stability
Figure 2. Aligned amino acid sequences of RNases Sa, Sa2, Sa3, T1, and Ba (Hebert et al., 1997; Hill et al., 1983).
tributions of conformational entropy, the hydrophobic effect, hydrogen bonding, and disul®de bonds to the conformational stability of these proteins.
wavelength chosen to monitor unfolding. A typical thermal denaturation curve is shown in Figure 3(b). Thermal denaturation curves for RNases Sa2 and Sa3 were also determined by measuring the CD at 234 nm, and they are similar to that shown for
Results Thermal denaturation Thermal denaturation was studied using both differential scanning calorimetry (DSC) and thermal denaturation curves. Six DSC scans were run on RNase Sa between pH 5.0 and pH 7.0. These experiments were analyzed as described below to determine the midpoint of the thermal denaturation curve, Tm , the calorimetric enthalpy change, �Hcal , and the van't Hoff enthalpy change, �HvH. For the six DSC experiments, the ratio �Hcal/ �HvH 0.99(�0.08). For RNases Sa2 and Sa3, two DSC experiments at pH 7 showed that �Hcal/ �HvH 1.00(�0.03) (Sa2) and 0.96(�0.04) (Sa3). The results from the DSC experiments are in excellent agreement with the results from thermal denaturation curves analyzed assuming a two-state folding mechanism. Thus, the thermal denaturation of all three of the Sa RNases closely approaches a two-state folding mechanism. When DSC scans were repeated on the same sample, almost identical results were obtained, showing that the thermal denaturation of the Sa RNases is reversible. Irreversibility was observed in the DSC experiments at higher protein concentrations near the isoelectric pH (pI) values for the proteins: 3.5 (Sa), 5.3 (Sa2), and 7.2 (Sa3) (Hebert et al., 1997). This appears to result because the unfolded states are also less soluble near their pI values. This is also true of RNase T1 (Hu et al., 1992). The circular dichroism (CD) spectra of folded and unfolded RNase Sa are shown in Figure 3(a). The positive CD band near 235 nm is also observed with RNase T1 and a few other proteins and has been discussed by Woody (1994). This band is not observed in unfolded RNase Sa and the difference between the folded and unfolded CD spectra is greatest at 234 nm, so this was the
Figure 3. (a) Circular dichroism spectra of native (25� C) and denatured (75� C) RNase Sa in 30 mM Mops buffer (pH 7). (b) A typical thermal denaturation curve for RNase Sa in 30 mM Mops buffer (pH 7) monitored by measuring the circular dichroism at 234 nm. The continuous line is a theoretical curve based on equation (7) and the thermodynamic parameters given in Table 1.
274
Microbial Ribonuclease Stability
RNase Sa. For all three proteins, thermal denaturation curves were determined as a function of pH over the pH range from 2 to 10. Thermal denaturation was greater than 95% reversible over most of the pH range, and the curves were analyzed by assuming a two-state mechanism. The analyses yield Tm and the van't Hoff enthalpy change for denaturation at Tm, �Hm. The thermal denaturation was studied most carefully at pH 7, and these results are summarized in Table 1. At the other pH values, generally only a single thermal denaturation curve was determined and analyzed. These data were used to estimate the heat capacity change for folding, �Cp, using the Kirchoff equation: d
�Hm =d
Tm �Cp
1
The plots used to determine �Cp values for each of the proteins are shown in Figure 4, and the values are given in Table 1. This method will be discussed further below. Also included in Table 1 are thermodynamic parameters characterizing the folding of RNases Ba, T1, and A. Urea denaturation A typical urea denaturation curve for RNase Sa is shown in Figure 5(a). The urea denaturation curves for RNases Sa2 and Sa3 were similar in appearance and quality. The curves were analyzed by assuming a two-state mechanism, and the fraction of denatured protein, FD, is plotted as a function of urea concentration for all three proteins in Figure 5(b). From the data in the transition region, the free energy of folding, �G, was calculated and found to vary linearly with urea concentration. Consequently, the data were analyzed using the linear extrapolation model: �G �G
H2 O ÿ murea
2
where m is a measure of the dependence of �G on urea concentration, and �G(H2O) is an estimate of the conformational stability of the protein that assumes that the linear dependence of �G on urea concentration observed in the transition region continues to 0 M urea (Greene & Pace, 1974; Pace, 1986). The parameters characterizing the urea denaturation of RNases Sa, Sa2, and Sa3 from this study, and of RNases Ba, T1, and A from the literature are given in Table 2. Dependence of the conformational stability on NaCl RNase T1 is stabilized by NaCl to a much greater extent than RNase A at pH 7 (von Hippel & Wong, 1965; Pace & Grimsley, 1988). The stabilization of RNase T1 is thought to result from the speci®c binding of Na ions to the folded protein (Pace & Grimsley, 1988). This prompted us to measure the effect of NaCl on the stability of other members of the microbial RNase family. The results in Table 3 show that all ®ve of the RNases are stabilized by 0.5 M NaCl, but that the increases in Tm range from 0.1 to 7.8� C. Contribution of disulfide bonds to the conformational stability The two disul®de bonds in RNase T1 contribute over 7 kcal/mol to the conformational stability (Pace et al., 1988), and the four disul®de bonds in RNase A make such a large contribution to the stability that the protein cannot be folded when the disul®de bonds are broken (An®nsen, 1973). To assess the contribution of the single disul®de bonds in RNases Sa, Sa2, and Sa3 to their conformational stability, Tm was measured for the proteins in the presence and absence of their disul®de
Table 1. Parameters characterizing the thermal denaturation of selected RNases at pH 7.0 RNase
Tma (� C)
Sag Sa2g Sa3g T1h Bai Aj Ak
48.4 41.1 47.2 51.6 53.2 62.8 62.8
�Hmb (kcal/mol) 97.4 68.4 93.6 105.7 126.6 119.4 119.4
�Smc (cal Kÿ1 molÿ1) 303 218 292 325 388 355 355
�Cpd (kcal Kÿ1 molÿ1) 1.52 1.27 1.57 1.65 1.79 1.90 1.31
�G(25� C)e (kcal/mol) 5.8 3.0 5.3 6.8 8.7 9.2 10.5
Tsf (� C) ÿ10 ÿ8 ÿ7 ÿ7 ÿ10 5 ÿ17
�G(Ts)e (kcal/mol) 9.1 5.5 8.2 9.8 12.8 10.5 14.8
Midpoint of the thermal unfolding curve. For Sa, Sa2, and Sa3, the standard deviation is �0.3� C. Enthalpy change at Tm. For Sa, Sa2, and Sa3, the standard deviation is �5%. c �Sm �Hm /Tm. d Determined by plotting �Hm as a function of Tm using equation (1). The standard deviations are �0.09 for Sa, �0.06 for Sa2, and �0.11 for Sa3. e Calculated with equation (3). f Calculated with equation (4). g From this work. h Tm and �Hm are the average of values from Shirley et al. (1989, 1992), and Yu et al. (1994). �Cp is from Pace & Laurents (1989). i Tm and �Hm are from this work. �Cp is the average value from Johnson & Fersht (1995), and Oliveberg et al. (1994). j Tm and �Hm are from Catanzano et al. (1996). �Cp is the average of 13 literature values (Brandts & Hunt, 1967; Danforth et al., 1967; Salahuddin & Tanford, 1970; Tsong et al., 1970; Shiao et al., 1971; Freire & Biltonen, 1978; Schwarz & Kirchoff, 1988; Pace & Laurents, 1989; Barone et al., 1992; Makhatadze et al., 1995; Liu & Sturtevant, 1996; Catanzano et al., 1997). k From Catanzano et al. (1996). a
b
275
Microbial Ribonuclease Stability
bond. The thermal denaturation curves were determined under different conditions for each protein because their reduced, unfolded states were not soluble at any common pH. (The unfolded states of the proteins are less soluble when the disul®de bonds are reduced.) The results in Table 4 show that the decreases in Tm range from 20� C to 31.5� C, and that the differences in stability at 37� C, a temperature intermediate between the Tm values, range from 5.7 to 7.9 kcal/mol.
Discussion Thermodynamics of folding The thermodynamic parameters characterizing the folding of the RNases are given in Table 1. These parameters can be used to calculate the free energy change for folding at any temperature, �G (T), using the modi®ed Gibbs-Helmholtz equation, �G
T �Hm
1 ÿ T=Tm �Cp
T ÿ Tm ÿ T ln
T=Tm
3
and the temperature where �G(T) reaches a maximum, TS, using Ts Tm exp
ÿ�Hm =Tm �Cp
4
(Becktel & Schellman, 1987). The protein stability curves for the six RNases calculated with these equations and the parameters given in Table 1 are shown in Figure 6. Values of TS, �G at TS, �G(TS), and �G at 25� C, �G(25� C), are given in Table 1. Generally, the value for Tm can be determined to better than �1%, the value for �Hm from a van't Hoff analysis can be determined to about �5%, and there is good agreement among results from different laboratories. In contrast, there is considerable uncertainty in the �Cp values, and different laboratories frequently get con¯icting results, even when using the same method. Consider RNase A. A brief search of the literature provided 13 �Cp values ranging from 1.24 (Makhatadze et al., 1995) to 2.50 (Brandts & Hunt, 1967) with an average of 1.90(�0.40) kcal Kÿ1 molÿ1. The last two lines in Table 1 illustrate the importance of �Cp in determining TS , �G(TS), and �G(25� C). The last line uses a complete data set at pH 7 from Catanzano et al. (1996) that includes �Cp 1.31, which is similar to the often-used value from the Privalov lab of 1.29 kcal Kÿ1 molÿ1 (Privalov & Gill, 1988). The next-to-last line uses the average (Cp 1.90 kcal Kÿ1 molÿ1. Note that the TS values differ by 22� C, the �G(TS) values by 4.3 kcal/mol, and the �G(25� C) values by 1.3 kcal/mol, depending just on the value of �Cp. This has a dramatic effect on
Figure 4. �Hm plotted as a function of Tm using data from thermal denaturation curves measured over the
pH range 2 to 10 for RNases Sa (a), Sa2 (b), and Sa3 (c). The continuous lines are least-squares ®ts to equation (1). The values of �Cp obtained from this analysis are 1.52(�0.09) for RNase Sa, 1.27(�0.06) for RNase Sa2, and 1.57(�0.11) kcal Kÿ1 molÿ1 for RNase Sa3.
276
Microbial Ribonuclease Stability Table 2. Parameters characterizing the urea denaturation of selected RNases at pH 7.0 RNase Sa Sa2 Sa3 T1 Ba A
urea1/2a (M) 6.44 2.10 5.63 5.30 4.49 6.92
mb (cal/mol/M) 0.99 1.31 1.05 1.21 1.94 1.35
�ac 0.32 0.33 0.32 0.32 0.50 0.34
�G(H2O)b (kcal/mol) 6.4 2.8 5.9 6.4 8.7 9.3
The data for RNases Sa, Sa2, and Sa3 are from this paper. The data for RNases T1 and A are from Pace (1990a,b), and the data for RNase Ba are from Pace et al. (1992). a (urea)1/2 �G(H2O)/m. b From equation (2) c �a is the fraction of buried groups that must become exposed to solvent on unfolding to account for the measured m values (Pace et al., 1990).
Figure 5. (a) A typical urea denaturation curve for RNase Sa in 30 mM Mops (pH 7.0), 25� C, monitored by measuring the circular dichroism at 234 nm. The continuous line is a theoretical curve based on equation (8) and the parameters given in Table 2. (b) The fraction of denatured protein, FD, as a function of urea concentration for RNase Sa (�), Sa2 (*), and Sa3 (*) in 30 mM Mops (pH 7.0), 25� C. The points were calculated from data such as those shown in (a) (Pace & Scholtz, 1996).
the stability curves, as shown in Figure 6. Consequently, a reliable �Cp value is of considerable importance, and below we discuss the methods commonly used to measure �Cp. One DSC method used to determine �Cp is to take the difference between the pre- and post-transition baselines. The errors are large because of the uncertainty in the baselines, and the �Cp values are generally smaller than those determined by other methods (Schwarz & Kirchoff, 1988). With RNase A, for example, Liu & Sturtevant (1996) found �Cp 1.08(�0.14) from an analysis of the baselines, and �Cp 1.74(�0.02) kcal Kÿ1 molÿ1 from a plot of �Hcal versus Tm using equation (1). Thus, the baseline method is not generally used to
estimate �Cp. However, Privalov et al. (1989) have used baseline measurements to show convincingly that �Cp decreases with increasing temperature. For example, between 5� C and 50� C they ®nd that �Cp decreases from 1.70 to 1.41 for RNase Ba (Griko et al., 1994), and from 1.31 to 1.20 kcal Kÿ1 molÿ1 for RNase T1 (Yu et al., 1994). This is supported by an analysis of �Cp in terms of protein structure and model compound data (Gomez et al., 1995), and, in the case of ubiquitin (Wintrode et al., 1994) and an SH3 domain (Viguera et al., 1994), by the direct observation that �Hcal does not vary linearly with temperature. In contrast, Nicholson & Scholtz (1996) have shown that a temperatureindependent �Cp is adequate to describe the stability of histidine-containing phosphocarrier protein over a temperature range from 0� C to 75� C. Our data yield an average �Cp for the temperature range 25� C to 55� C, and it is clear that the temperature dependence of �Cp can not be determined (Figure 4). Consequently, we assume that �Cp is independent of temperature. The most common DSC method used to determine �Cp is to measure �Hcal as a function of Tm Table 3. Parameters characterizing the thermal unfolding of ®ve microbial ribonucleases in the presence of 0 M and 0.5 M NaCl RNase Sa Sa2 Sa3 T1 Ba
NaCl (M)
Tma (� C)
�Tmb (deg. C)
0.0 0.5 0.0 0.5 0.0 0.5 0.0 0.5 0.0 0.5
48.4 52.4 41.1 41.2 47.2 54.4 51.6 59.4 53.2 55.8
± 4.0 ± 0.1 ± 7.2 ± 7.8 ± 2.6
�(�G)c (kcal/mol) 1.2 0.0 2.1 2.5 1.0
In 30 mM Mops buffer (pH 7.0). a Midpoint of the thermal unfolding curve. b �Tm Tm (0.5 M NaCl) ÿ Tm (0 M NaCl). c Determined using the method of Becktel & Shellman (1987), where �(�G) �Tm � �Sm using the �Sm values from Table 1.
277
Microbial Ribonuclease Stability
Table 4. Parameters characterizing the contribution of the disul®de bond to the stability of RNases Sa, Sa2, and Sa3 RNase
Tma (� C)
Sa R-Sa Sa2 R-Sa2 Sa3 R-Sa3
48.4 28.4 48.9 17.4 50.6 23.6
�Hma (kcal/mol)
�Tm (deg. C)
�(�G)(Tm)b (kcal/mol)
�(�G)(37� C)b (kcal/mol)
�(�G)(25� C)b (kcal/mol)
± 20 ± 31.5 ± 27.0
± 6.8 ± 6.8 ± 8.4
± 5.7 ± 6.4 ± 7.9
± 4.6 ± 5.9 ± 7.5
95 87 78 44 111 72
a Tm and �Hm determined under the following conditions: Sa and R-Sa, 30 mM Pipes buffer (pH 7.0); Sa2 and R-Sa2, 30 mM acetate buffer (pH 5.0); Sa3 and R-Sa3, 30 mM Gly-Gly buffer (pH 3.0). b Determined using equation (3) with the Tm and �Hm values from this Table and the �Cp values from Table 1.
and use equation (1) (Privalov & Khechinashvili, 1974). The pH is varied to change the stability, and the measurements are generally restricted to the acid pH range of 0 to 5 so that only the carboxyl groups on the protein will ionize. Under these conditions, the heat from proton binding or dissociation will be �0 if a carboxyl buffer is used, and no correction to the observed �Hcal values is necessary. This method has recently been questioned by McCrary et al. (1996) on the basis of their studies of the hyperthermophilic protein Sac7d. They ®nd �Cp 0.50(�0.02) based on plots of �Hcal versus Tm, but �Cp 0.86(�0.02) kcal Kÿ1 molÿ1 based on a global ®t of thermal and chemical denaturation data. They argue convincingly that the higher value is correct, and they show in a subsequent paper that the discrepancy probably results from a failure to take into account the linkage between protein stability and proton and anion binding (McCrary et al., 1998). Most proteins bind anions at acid pH and this will probably make a pH dependent contribution to �Hcal (Fink et al., 1994). Anion and cation binding can also contribute directly to �Cp. For example, Guinto & Di Cera (1996) have shown that �Cp 1.1 kcal Kÿ1 molÿ1 for the binding of a Na to thrombin. Thus,
Figure 6. Protein stability curves for RNases Sa, Sa2, Sa3, T1, Ba, and A at pH 7 calculated using equation (3) and the parameters given in Table 1. For RNase A, the dotted curve is based on �Cp 1.31 and the broken curve is based on �Cp 1.90 kcal Kÿ1 molÿ1 with identical values for �Hm and Tm as given in the last two rows in Table 1.
�Cp values obtained using �Hcal values from DSC measurements must be regarded with caution, as emphasized by the studies by Liu & Sturtevant (1996). They found �Cp values for RNase A ranging from 1.74 to 3.25 kcal Kÿ1 molÿ1, depending on the added solute present. The other approach frequently used to estimate �Cp is to measure �Hm by a van't Hoff analysis of thermal denaturation curves and again use equation (1). As described above, the measurements are often done in the low pH range, but this is not necessary. This method looks directly at the equilibrium between the folded and unfolded states of the protein. As a consequence, this method yields an effective value of �Cp that re¯ects both protein folding and other effects that shift the protein folding equilibrium. This was the method used to determine the �Cp values for RNases Sa, Sa2, and Sa3 given in Table 1. This provides a reliable estimate of �Cp over the temperature range 25� C to 50� C and over the pH range 2 to 10. For RNases Ba and T1, we have chosen the �Cp values from the literature that were determined by methods similar to those used here. For RNase A, the average �Cp 1.9 noted above seems more reasonable than the value of 1.24 kcal Kÿ1 molÿ1 that is used in most compilations of �Cp values, including ours (Myers et al., 1995). This conclusion is based in part on data that indicate that TS is more likely to be close to 5� C (�Cp 1.9) than to ÿ17� C (�Cp 1.31) (Salahuddin & Tanford, 1970; Arnold & Ulbrich-Hofmann, 1997; G. R. Grimsley, unpublished observations). At present, it seems safest to determine �Cp by a global analysis of both thermal and chemical denaturation data (Salahuddin & Tanford, 1967; Pace & Laurents, 1989; Chen & Schellman, 1989; Swint & Robertson, 1993; Scholtz, 1995; Nicholson & Scholtz, 1996; McCrary et al., 1996; Grantcharova & Baker, 1997). Several methods have been proposed to estimate �Cp that are based on the changes in accessible surface area that accompany protein folding (Spolar et al., 1992; Murphy & Freire, 1992; Myers et al., 1995). The best agreement with the �Cp values in Table 1 is obtained with: �Cp ÿ119 0:20
�ASA
5
where �(ASA) is the change in accessible surface
278 area exposed on unfolding calculated as described by Myers et al. (1995). The values obtained by this equation are (kcal Kÿ1 molÿ1): 1.36 (Sa), 1.34 (Sa2), 1.39 (Sa3), 1.57 (T1), 1.79 (Ba), and 1.90 (A), all in reasonable agreement with the experimental values. It might be expected that the four disul®de bonds in RNase A would reduce the value of �Cp, but Privalov et al. (1989) have shown that �Cp does not change signi®cantly when the disul®de bonds are broken. The results in Table 1 and Figure 6 show that maximum stabilities of the six RNases range from 5.5 to 12.8 kcal/mol. Most other proteins whose conformational stability has been measured would ®t in this range (Pace, 1990a). The maximum stabilities occur at similar temperatures, ÿ7� C to ÿ10� C, for the ®ve microbial RNases, but at a somewhat higher temperature for RNase A, 5� C. In addition, the Tm value for RNase A is substantially higher than it is for the microbial RNases. This may re¯ect the fact that RNase A is adapted to function at 35� C, the temperature of a cow, while the microbial RNases are probably adapted to function at a lower temperature. Conformational stability at 25� C, pH 7 Estimates of the conformational stability of the RNases at pH 7, 25� C based on analyses of the urea denaturation curves are given in Table 2. It can be seen that these estimates, based on the linear extrapolation method, are in good agreement with the �G(25� C) values from thermal denaturation curves given in Table 1. Yao & Bolen (1995) measured stabilities of 9.26(�0.31) and 9.38(�0.12) kcal/mol for RNase A by combining results from urea denaturation and potentiometric titration curves, in remarkably good agreement with stabilities of 9.2 from thermal denaturation (Table 1), 9.3 from urea denaturation (Table 2), and a value of 9.24(�0.64) from GdnHCl denaturation reported previously (Pace et al., 1990). Our results suggest that the urea and thermally unfolded states of these proteins are thermodynamically equivalent, and that the linear extrapolation method yields estimates of the conformational stability of the proteins, in good agreement with estimates from thermal denaturation. There is an excellent correlation between denaturant m values (Table 2) and the amount of protein surface area freshly exposed to solvent by unfolding (Myers et al., 1995). Tanford (1964, 1970) developed a model that can be used to estimate the fraction of peptide groups and uncharged sidechains that must be exposed to solvent to account for the measured m values. We denote this parameter�a. We have used this approach to show that proteins unfold to different extents, and that RNase Ba unfolds more completely than RNases T1 and A (Pace et al., 1990, 1992). The �a values in Table 2 show that despite signi®cant differences in the m values, the Sa RNases unfold to similar
Microbial Ribonuclease Stability
extents and that the extent of unfolding is identical to that observed with RNases T1 and A. In contrast, RNase Ba unfolds more completely than the other RNases. On the basis of their crystal structures, we estimate that a �a value of �0.7 would be observed if a protein unfolded completely. Thus, RNase Ba appears to be about 70% unfolded and the other RNases a little less than 50% unfolded by this criteria. (The analysis uses �Gtr values from water to denaturant solutions for model compounds so the results actually suggest that the unfolded Sa RNases are only �50% as accessible to solvent as the model compounds used to measure the �Gtr values.) In part, this must re¯ect the fact that RNase Ba has no disul®de bonds and all of the other RNases do. It also suggests that the single disul®de bonds in the Sa RNases and the two disul®de bonds in RNase T1 restrict the accessibility to denaturant about the same as the four disul®de bonds in RNase A. The conformational stability of RNase Sa2 is surprisingly low. With a stability of only 2.9 kcal/ mol, one out of 135 molecules is globally unfolded at 25� C. Thus, the low stability would have a small effect on the activity of the enzyme at 25� C and lower temperatures, and evidently this was stable enough for this strain of Streptomyces to survive under the conditions that existed as it evolved. The function of these extracellular RNases is not clear so it is dif®cult to say more about the signi®cance of this exceptionally low stability. pH dependence of the conformational stability The Tm and �Hm values measured as a function of pH were used with the �Cp values from Table 1 to calculate �G(25� C) values as a function of pH using equation (3), and the results are shown in Figure 7. Studies of the pH dependence of stability for the other RNases have been published: RNase T1 (Pace et al., 1990; Hu et al., 1992; Barone et al., 1992; Yu et al., 1994), RNase Ba (Pace et al., 1992; Oliveberg et al., 1994; Griko et al., 1994), and RNase A (Pace et al., 1990; Barone et al., 1992; Yao & Bolen, 1995). At the pH of maximum stability, the stabilities of the proteins are (kcal/mol): 4.7 (Sa2), 7.0 (Sa), 8.6 (Sa3), 8.8 (T1), 9.0 (Ba), and 9.3 (A). The microbial RNases are all maximally stable near pH 5 and most active in RNA hydrolysis at pH 7.5 to 8, despite a wide range of isoelectric points: 3.5 (Sa), 3.7 (T1), 5.3 (Sa2), 7.2 (Sa3), and 9.3 (Ba) (Hebert et al., 1997; Mossakowska et al., 1989). This suggests that it is advantageous for these proteins to maximize their stability near pH 5 and their activity near pH 7.5, but that there is no selective pressure to maintain a particular isoelectric point. The stability of all of the RNases drops sharply as the pH decreases below pH 4 (Figure 7). This is because some of the carboxyl groups have lower pK values in the folded than in the unfolded proteins. In RNase A, for example, ®ve of the 11 car-
279
Microbial Ribonuclease Stability
boxyl groups have pK values less than 3 in the folded protein and they would all be expected to have values above 4 in the unfolded proteins (Baker & Kintanar, 1996; Rico et al., 1991). As a consequence, the unfolded states bind protons more tightly than the folded states, and the equilibrium will be shifted toward unfolding as the H concentration increases. The dependence of �G(25� C) on pH can be used to estimate the maximum number of protons taken up on unfolding. The numbers range from �2 for RNases T1 and A (Pace et al., 1990), to �3 for the Sa RNases, to �4 for RNase Ba (Oliveberg et al., 1994). At higher pH values, the stabilities of the proteins drop showing that some of the ionizable groups in the folded proteins now have higher pK values than the same groups in the unfolded proteins. Note in Figure 7 that each of the Sa RNases has a unique dependence of stability on pH above pH 5. In both RNase T1 (McNutt et al., 1990) and RNase Ba (Sali et al., 1988; Pace et al., 1992), the pH dependence between pH 5 and 9 has been shown to depend mainly on a difference in the pK values of histidine side-chains in the folded and unfolded proteins. We are currently attempting to measure the pK values of all of the ionizable side-chains in folded and unfolded RNase Sa to see if they can be used to account quantitatively for the observed pH dependence of the stability.
NaCl dependence of the conformational stability
Figure 7. Conformational stability, �G(25� C), as a function of pH for RNase Sa (a), RNase Sa2 (b), and RNase Sa3 (c). �G(25� C) was calculated using equation (3) with �Hm and Tm values from thermal denaturation curves measured over the pH range 2 to 10 (the same data shown in Figure 4), and the �Cp values given in Table 1.
The conformational stability of a protein is often affected by the type and concentration of salt present. This can result from (1) an ionic strength effect due to Debye-Huckel screening of electrostatic interactions that contribute to protein stability, (2) the effects of salts on the groups which are exposed to solvent when the protein unfolds, and (3) the preferential binding of cations or anions to either the native or denatured states of the protein (von Hippel & Wong, 1965; Schrier & Schrier, 1967). We have shown that the conformational stability of RNase T1 is increased by salts and can be doubled by adding 0.2 M Na2HPO4. This remarkable increase in the conformational stability results primarily from the preferential binding of cations and anions to folded RNase T1 (Pace & Grimsley, 1988). To see if salts have a similar effect on the conformational stability of the other microbial RNases, we determined thermal unfolding curves at pH 7 in the presence and absence of 0.5 M NaCl. The results in Table 3 show that the presence of 0.5 M NaCl increases the stability of RNases Sa3 and T1 by over 2 kcal/mol, increases the stability of RNases Sa and Ba by about 1 kcal/ mol, but has no effect on the stability of RNase Sa2. As for RNase T1, it seems likely that most of the stability enhancement of RNases Sa, Sa3, and Ba is due to the preferential binding of cations or anions by the folded conformations of the proteins.
280
Microbial Ribonuclease Stability
The least stable of the RNases, Sa2, is the only protein that is not stabilized signi®cantly by NaCl. Contribution of disulfide bonds to the conformational stability The Sa RNases each contain a single disul®de bond at equivalent positions that links the ends of the molecule, e.g. residues 7 and 96 in RNase Sa (Figure 2). The three disul®de bonds are buried to similar extents, 62, 66, and 60% buried, have simiÊ , and lar S to S distances, 2.03, 2.00, and 2.00 A have similar w3 angles, ÿ94� , ÿ86� , and ÿ94� , for RNases Sa, Sa2, and Sa3, respectively. However, they affect the stabilities of the proteins to different extents. The �Tm values range from 20 deg. C to 31.5 deg. C, but the difference in stability depends on the temperature chosen for the comparison. We have not measured �Cp values for the reduced proteins so we have used the �Cp values from Table 1 to compare the stabilities at different temperatures. In the case of RNase Ba, Johnson et al. (1997) have shown that the presence of additional disul®de bonds does not change the �Cp values to a great extent. The results in Table 4 show that the �(�G) values are greatest at the Tm of the proteins with their disul®des intact and decrease at lower temperatures. Disul®de bonds increase the conformational stability of a protein primarily by constraining the unfolded conformations of the protein and thereby decreasing their conformational entropy. Based on our studies with RNase T1 and the few other studies available in the literature at the time, we suggested that the following equation could be used to roughly estimate the effect of a cross-link on the conformational entropy: �S ÿ2:1 ÿ
3=2R ln n
6
where n is the number of residues in the loop
forming the cross-link (Pace et al., 1988). For the Sa RNases, this suggests that the disul®de bonds would contribute 4.8 kcal/mol to the stability at 25� C. It can be seen in Table 4 that this provides a good estimate of the contribution of the disul®de bond to the stability of RNase Sa, but that the disul®de bonds of RNases Sa2 and Sa3 make a greater contribution to the stability. This is not surprising since factors such as strain in the native state (Katz & Kossiakoff, 1986), the hydrophobic effect (Doig & Williams, 1991), and other factors (Zhang et al., 1994) can also make important contributions. Forces contributing to the conformational stability of the microbial RNases We have used the crystal structures of the RNases to gain insight into the forces that contribute to their conformational stability. The major force favoring the unfolded state is conformational entropy. Rotation around the many bonds in a protein increases dramatically when the protein unfolds, and this provides a strong entropic driving force for unfolding. Substantial progress has been made in estimating the conformational entropy change accompanying protein folding, �SCE. Spolar & Record (1994) used an approach that separates the contribution of the hydrophobic effect to �S for protein folding from the other contributions, which they argue are mainly conformational entropy. They ®nd �SCE 5.6(�0.5) kcal Kÿ1 molÿ1 per residue, and this translates into a contribution to �G at 25� C of 1.7 kcal/mol per residue. When this is applied to the RNases, the results shown in Table 5 are obtained. In a completely different approach, the Freire lab used a combination of theory and experiment to arrive at a method for estimating the residue-speci®c changes in side-chain and backbone conformational entropy that accompany protein folding (Lee et al., 1994; D'Aquino et al., 1996). Estimates based on this
Table 5. Forces contributing to the conformational stability of the RNases RNase Sa Sa2 Sa3 T1 Ba A
C.E.a
C.E.b
S-Sc
HPd
HBe
�G(pred)
�G(25� C)
163 165 168 177 187 211
165 168 167 187 196 224
5 6 8 7 0 15
88 92 91 88 112 112
85 79 69 96 92 106
13 9 1 4 8 9
6 3 5 7 9 9
All units are kcal/mol. a Conformational entropy calculated using 1.7 kcal/mol per residue (Spolar & Record, 1994). b Conformational entropy calculated as described by Lee et al. (1994) and D'Aquino et al. (1996). c Values at 25 � C for RNases Sa, Sa2, and Sa3 are from Table 4; for RNase T1 are from Pace et al. (1988); and for RNase A were calculated using equation (6). d The contribution of the hydrophobic effect, HP, was calculated by multiplying the �Gtr values for n-octanol (Fauchere & Pliska, 1983; Pace, 1995) by the number of hydrophobic groups buried estimated by the Lee & Richards (1971) program. The hydrophobic groups included were the -CH2- groups from all of the polar and charged residues, plus the side-chains of the following amino acids: Ala, Val, Ile, Leu, Pro, Phe, Tyr, Trp, Met, Cys. e The contribution of hydrogen bonding, HB, was calculated by multiplying the number of hydrogen bonds calculated using the HBPLUS program from McDonald & Thornton (1994) by 1.0 kcal/mol per hydrogen bond (Myers & Pace, 1996).
Microbial Ribonuclease Stability
approach are also given in Table 5, and they are in remarkable agreement with those from the Spolar & Record (1994) approach. We will use the estimates based on the Freire method for the rest of the analysis because they make use of the threedimensional structures to estimate the extent to which each residue is buried in the folded protein, and we have this information for the RNases. One means of overcoming �SCE is to introduce disul®de bonds which will restrict the conformational entropy of the unfolded protein. In the microbial RNase family, the number of disul®de bonds ranges from zero to three, but most of the members have at least one disul®de bond. As shown in Table 5, the single disul®de bond that crosslinks the ends of the Sa RNases contributes from 5 to 8 kcal/mol to the stability at 25� C, and the two disul®de bonds in RNase T1 contribute 7 kcal/mol to the stability. The contribution of the disul®de bonds to the conformational stability of RNase A is a rough estimate based on equation (7). The Scheraga lab (Laity et al., 1997) is investigating the disul®de bonds of RNase A in detail and have shown experimentally that removing the 40 to 95 disul®de bond in RNase A lowers the Tm value by 22 deg. C. Using equation (3), we ®nd that this corresponds to a decrease in stability of 5.8 kcal/mol at 25� C. Disul®de bonds are most often found in extracellular enzymes, and all of the microbial RNases are extracellular. It might prove interesting to study the evolution of disul®de bonds in the microbial RNases family. It is possible that disul®de bonds provide other advantages to an organism besides their contribution to protein stability. Since Kauzmann's (1959) classic review, the prevailing view has been that the hydrophobic effect is the major force stabilizing proteins. We have suggested, based on stability studies of hydrophobic mutants (Xu et al., 1998), that �Gtr values for the transfer of hydrophobic groups from water to n-octanol can be used to obtain a reasonable estimate of the contribution of the hydrophobic effect to protein stability (Pace et al., 1996). We have used the crystal structures of the proteins to estimate the number of hydrophobic side-chains (Ala (3.4/6), Val (4.6/6), Ile (4.3/5), Leu (5.1/6), Pro (2.5/6), Phe (2.7/3), Tyr (6.2/8), Trp (0/0), Met (0/0), Cys (1.3/2)), and the number of -CH2groups from the polar and charged side-chains (43.7/79) that are buried on folding. (The values for RNase Sa are given in parentheses (number buried/number present) as an example.) These are then multiplied by the appropriate �Gtr value based on the n-octanol data (Fauchere & Pliska, 1983; Pace, 1995), and the contributions summed to arrive at the estimate of the contribution of the hydrophobic effect to the stability of each RNase given in Table 5. Note that the hydrophobic effect contributes more to the stability of RNases Sa, Sa2, and Sa3 than to RNase T1, a larger protein. Note also that the hydrophobic effect makes the same contribution to RNase Ba as to RNase A, a protein with 14 more residues. It is clear that the contri-
281 bution of disul®de bonds and the hydrophobic effect is not suf®cient to overcome the unfavorable contribution from conformational entropy. We propose that the additional free energy must come from the burial and hydrogen bonding of the polar groups in protein folding. When a peptide group is transferred from water to the vapor phase, the dehydration is very unfavorable, �Gtr 12.1 kcal/mol (Makhatadze & Privalov, 1995). When a peptide group is transferred from water to cyclohexane, the dehydration is much less unfavorable, �Gtr 5.3 kcal/mol (Radzika & Wolfenden, 1988; Pace, 1995). This shows unequivocally that van der Waals interactions between the peptide group and cyclohexane are very favorable. The interior of a protein is considerably more tightly packed than cyclohexane (Harpaz et al., 1994) so the van der Waals interactions will be even more favorable when a peptide group is buried in protein folding. Thus, we disagree with Honig & Cohen (1996) when they conclude: ``� � � a crucial property of the polypeptide backbone is that it contains polar NH and CO groups whose removal from water involves a signi®cant energetic penalty.`` We think that polar group burial in the protein interior is not so costly so that when polar groups are buried and form hydrogen bonds there is a substantial net gain in stability (Myers & Pace, 1996). Studies of 52 hydrogen bonding mutants show that when a hydrogenbonded polar group is removed from a protein, the average �(�G) 1.0(�1.0) kcal/mol per hydrogen bond (Myers & Pace, 1996). For each of the RNases, we have estimated the number of hydrogen bonds formed on folding using the HBPLUS program of McDonald & Thornton (1994). The product of these numbers leads to the estimates of the contribution of intramolecular hydrogen bonding to the stability of the RNases given in Table 5. Only for RNase T1 is the contribution from hydrogen bonding greater than the contribution from the hydrophobic effect, but the values are always comparable in magnitude, with the biggest difference being 22 kcal/mol for RNase Sa3. It is interesting that the contribution of hydrogen bonding to the stability of the three Sa RNases varies over a wider range than the contribution of the hydrophobic effect. The average lengths of the hydrogen Ê ): 2.92 (Sa2), 2.93 bonds in the six proteins are (A (Ba), 2.94 (A), 2.95 (T1), 2.96 (Sa3), and 2.97 (Sa). It is not clear if these differences are signi®cant, since other factors such as geometry are important, but there are indications that it may be (Makhatadze & Privalov, 1995). When the three stabilizing contributions and the destabilizing contribution are summed, we arrive at the predicted conformational stabilities, �G(pred), given in Table 5 along with the measured values, �G(25� C). The agreement is remarkably good given the number of factors that are ignored and this suggests that the major forces contributing to the conformational stability of proteins are included in Table 5.
282
Microbial Ribonuclease Stability
In conclusion, this analysis of the stability of these RNases provides additional support for the idea that intramolecular hydrogen bonding does indeed provide a favorable contribution to protein stability, and that the contribution is comparable in magnitude to that of the hydrophobic effect.
Materials and Methods Materials The puri®cation of RNases Sa, Sa2, and Sa3 after expression into the periplasmic space of Escherichia coli is described by Hebert et al. (1997). The expression and puri®cation of RNase Ba is described by Okorokov et al. (1994). Protein concentrations were determined using molar absorption coef®cients at 278 nm of 12,300 Mÿ1 cmÿ1 (1.16 mgÿ1 ml cmÿ1, Sa), 17,100 Mÿ1 cmÿ1 (1.57 mgÿ1 ml cmÿ1, Sa2), 17,550 Mÿ1 cmÿ1 ÿ1 ÿ1 (1.59 mg ml cm , Sa3) (Hebert et al., 1997), and 25,880 Mÿ1 cmÿ1 (2.09 mgÿ1 ml cmÿ1, Ba) (Lees & Hartley, 1966). Ultrapure urea was purchased from Ambion. Reagent-grade chemicals and glass-distilled water were used to prepare all buffers and solutions. R-RNases Sa, Sa2, and Sa3 were prepared using the methods described by Pace & Creighton (1986). In brief, the enzymes were reduced by incubating for two to three hours at 25� C in 0.2 M Tris-HCl (pH 8.7), 2 mM EDTA, 6 M guanidine hydrochloride, and 0.1 M dithiothreitol. This mixture was then desalted with a Sephadex G-25 column equilibrated with 10 mM dithiothreitol in the desired buffer. The reduced protein was used for unfolding studies on the same day of preparation. The dithiothreitol was purchased from Sigma. Thermal and urea denaturation Urea and thermal denaturation curves were determined using circular dichroism measurements at 234 nm to follow unfolding. The general approach is described by Pace & Scholtz (1996). The instrument was an Aviv 62DS spectropolarimeter equipped with a temperature control and stirring unit. We typically used protein concentrations of 0.05 to 0.2 mg/ml and quartz cuvettes with a 1 cm path length. For thermal denaturation curves, measurements were typically made at one degree intervals between 0� C and 80� C, at a heating rate of 30 deg. C/hour (equilibration time between measurements 1.5 minutes, band width 10 nm, and time constant ten seconds). Following the approach of Santoro & Bolen (1988), a nonlinear least-squares analysis was used to ®t the thermal denaturation curves to the equation: y f
yf mf � T
yu mu � T � exp
�Hm =RT �
T ÿ Tm =Tm g=
1 exp
�Hm =RT �
T ÿ Tm =Tm
7
where y represents the observed circular dichroism signal at 234 nm, yf and yu are the intercepts and mf and mu the slopes of the pre- and posttransition baselines, T is the temperature, Tm is the midpoint of the thermal unfolding curve, and �Hm is the enthalpy change for unfolding at Tm. Curve-®tting was performed using MicroCal Origin version 2.9 curve ®tting software (MicroCal Software, Inc., Northampton, MA). Reversibility of thermal denaturation in the pH range from 2 to 10 was checked by reheating the sample. In this pH range,
the reversibility was greater than 95% as judged by comparison of the �Hm values for the two scans. The buffers used were: glycine (pH 1.5 to 3.5 and 9.5 to 10), acetate (pH 3.5 to 5.5), Mes (pH 5.5 to 6.5), Mops (6.5 to 8.5), and diglycine (8.5 to 9.5). Urea stock solutions were prepared and their molarity calculated as described (Pace, 1986). Urea denaturation curves were determined by directly adding increasing amounts of urea to a single protein solution, with a correction made for the increase in reaction volume (Nicholson & Scholtz, 1996). Urea denaturation was shown to be greater than 95% reversible for all of the conditions reported here. A non-linear least-squares analysis was used to ®t the urea denaturation curves to the equation (Pace & Scholtz, 1996): y f
yf mf � D
yu mu � D � expm �
D ÿ D1=2 =RTg=
1 expm �
D ÿ D1=2 =RT
8
where y represents the observed circular dichroism at 234 nm, yf and yu are the intercepts and mf and mu are the slopes of the pre- and posttransition baselines, [D] is the urea concentration, [D]1/2 is the urea concentration at the midpoint of the curve, and m is from equation (2). The curves were analyzed with the same software used to analyze the thermal denaturation curves. Differential scanning calorimetry Differential scanning calorimetry (DSC) was performed on a Microcal MC2 DSC running MC2Plus EMF data acquisition software. Protein samples (5 to 10 ml of a 0.5 to 2.0 mg mlÿ1 solution) were dialyzed twice against two litres of buffer (30 mM) for at least four hours at 4� C. After the second dialysis, the protein sample and �50 ml of dialysate were centrifuged at 15,000 rpm for 20 minutes in a Sorvall SS-34 rotor at 4� C and degassed for ten minutes. Dialysate buffer was used in both cells to determine baselines that were subtracted from the sample runs to generate the DSC scans that were analyzed. Dialysate buffer was also used in the reference cell for all DSC sample scans. Data were collected under 40 lb/in2 of nitrogen using a 45 deg. C/ hour scan rate and a 20 second ®lter constant. A second scan was run on each sample after a 90 minute equilibration at low temperature to check thermal reversibility. The 30 mM buffers used were the sodium salts of Mes (pH 5.0 to 6.5), Mops (pH 6.0 to 7.9), or Pipes (pH 6.0 to 7.9). The DSC data were analyzed using the program dscII (E.J. Hebert & K. Gajiwala, Texas A&M University, College Station, TX). The calorimetric enthalpy of unfolding, �Hcal, was calculated using a composite Simpson's rule and a sigmoidal progression baseline. Tm was the temperature at which half of the total heat had been absorbed (Freire, 1995). The van't Hoff enthalpy, �HvH, was obtained using: �HvH 4R
Tm 2 �Cp;max =�Hcal
9
where Cp,max is the maximum of the excess heat capacity (Privalov & Khechinashvili, 1974).
Acknowledgments This research was supported by grants from the National Institutes of Health (GM 37039), the Robert A. Welch Foundation (A 1060), The Texas Advanced
Microbial Ribonuclease Stability Research Program (010366-181), and by the Tom and Jean McMullin Professorship. We thank Marty Scholtz, Eric Nicholson, Mary Elizabeth Huf®ne, Bea HuyghuesDespointes, George Makhatadze, and Norm Pace for helpful discussions.
References An®nsen, C. B. (1973). Principles that govern the folding of protein chains. Science, 181, 223± 230. Arnold, U. & Ulbrich-Hofmann, R. (1997). Kinetic and thermodynamic stabilities of ribonuclease A and ribonuclease B. Biochemistry, 36, 2166± 2172. Bacova, M., Zelinkova, E. & Zelinka, J. (1971). Exocellular ribonuclease from Streptomyces aureofaciens. Biochim. Biophys. Acta. 235, 335± 342. Baker, W. R. & Kintanar, A. (1996). Characterization of the pH titration shifts of ribonuclease A by oneand two-dimensional nuclear magnetic resonance spectroscopy. Arch. Biochem. Biophys, 327, 189± 199. Barone, G., Del, Vecchio P., Fessas, D., Giancola, C., Graziano, G., Pucci, P., Riccio, A. & Ruoppolo, M. (1992). Thermal denaturation of ribonuclease T1: a DSC study. J. Therm. Anal. 38, 2791± 2802. Becktel, W. J. & Schellman, J. A. (1987). Protein stability curves. Biopolymers, 26, 1859± 1877. Brandts, J. F. & Hunt, L. (1967). The thermodynamics of protein denaturation. III. The denaturation of ribonuclease in water and aqueous urea and aqueous ethanol mixtures. J. Am. Chem. Soc. 89, 4826± 4838. Catanzano, F., Giancola, C., Graziano, G. & Barone, G. (1996). Temperature-induced denaturation of ribonuclease S: a thermodynamic study. Biochemistry, 35, 13378± 13385. Catanzano, F., Graziano, G., Capasso, S. & Barone, G. (1997). Thermodynamic analysis of the effect of selective monodeamidation on asparagine 67 in ribonuclease A. Protein Sci. 6, 1682± 1693. Chen, B. & Schellman, J. A. (1989). Low-temperature unfolding of a mutant of phage T4 lysozyme. 2. Equilibrium studies. Biochemistry, 28, 691± 699. D'Alessio, G. & Riordan, J. F. (1997). Editors of Ribonucleases, Academic Press, San Diego. Danforth, R., Krakauer, H. & Sturtevant, J. M. (1967). Differential calorimetry of thermally induced processes in solution. Rev. Sci. Instrum. 38, 484±487. D'Aquino, J. A., Gomez, J., Hilser, V., Lee, K. H., Amzel, L. M. & Friere, E. (1996). The magnitude of the backbone conformational entropy change in protein folding. Proteins: Struct. Funct. Genet. 25, 143± 156. De Vos, S., Doumen, V., Langhorst, U. & Steyaert, J. (1998). Dissecting histidine interactions of ribonuclease T1 with asparagine and glutamine replacements: analysis of double mutant cycles at one position. J. Mol. Biol. 275, 651± 661. Doig, A. J. & Williams, D. H. (1991). Is the hydrophobic effect stabilizing or destabilizing in proteins? The contribution of disulphide bonds to protein stability. J. Mol. Biol. 217, 389± 398. Fauchere, J. L. & Pliska, V. E. (1983). Hydrophobic parameters of amino-acid side chains from the partitioning of N-acetyl-amino-acid amides. Eur. J. Med. Chem. 18, 369± 375. Fink, A. L., Calciano, L. J., Goto, Y., Kurotsu, T. & Palleros, D. R. (1994). Classi®cation of acid denaturation of proteins: intermediates and unfolded states. Biochemistry, 33, 12504± 12511.
283 Friere, E. (1995). Differential scanning calorimetry. In Protein Stability and Folding: Theory and Practice (Shirley, B. A., ed.), pp. 191± 218, Humana Press, Totowa, New Jersey. Freire, E. & Biltonen, R. (1978). Statistical mechanical deconvolution of thermal transitions in macromolecules. I. Theory and application to homogeneous systems. Biopolymers, 17, 463± 479. Gomez, J., Hilser, V. J., Xie, D. & Friere, E. (1995). The heat capacity of proteins. Proteins: Struct. Funct. Genet. 22, 404± 412. Grantcharova, V. P. & Baker, D. (1997). Folding dynamics of the src SH3 domain. Biochemistry, 36, 15685± 15692. Greene, R. F. & Pace, C. N. (1974). Urea and guanidine hydrochloride denaturation of ribonuclease, lysozyme, a-chymotrypsin, and b-lactoglobulin. J. Biol. Chem. 249, 5388± 5393. Griko, Y. V., Makhatadze, G. I., Privalov, P. L. & Hartley, R. W. (1994). Thermodynamics of barnase unfolding. Protein Sci. 3, 669± 676. Guinto, E. R. & Di Cera, E. (1996). Large heat capacity change in a protein-monovalent cation interaction. Biochemistry, 35, 8800± 8804. Harpaz, Y., Gerstein, M. & Chothia, C. (1994). Volume changes in protein folding. Structure, 2, 641± 649. Hartley, R. W. (1968). A reversible thermal transition of the extracellular ribonuclease of Bacillus amyloliquefaciens. Biochemistry, 6, 2401± 2408. Hartley, R. W. (1980). Homology between prokaryotic and eukaryotic ribonucleases. J. Mol. Evol. 15, 355± 358. Hartley, R. W. (1997). Barnase and barstar. In Ribonucleases (D'Alessio, G. & Riordan, J., eds), pp. 51 ± 100, Academic Press, San Diego. Hartley, R. W., Both, V., Hebert, E. J., Homerova, D., Jucovic, M., Nazarov, V., Rybajlak, I. & Sevcik, J. (1996). Barstar inhibits extracellular ribonucleases of Streptomyces and allows their production from recombinant genes. Protein Pept. Letters, 3, 225± 231. Hebert, E. J., Grimsley, G. R., Hartley, R. W., Horn, G., Schell, D., Garcia S., , Both, V., Sevcik, J. & Pace, C. N. (1997). Puri®cation of ribonucleases Sa, Sa2, and Sa3 after expression in Escherichia coli. Protein Express. Puri®cat. 11, 162± 168. Hill, C., Dodson, G., Heinemann, U., Saenger, W., Mitsui, Y., Nakamura, K., Borisov, S., Tischenko, G., Polyakov, K. & Pavlovsky, S. (1983). The structural and sequencehomology of a family of microbial ribonucleases. Trends Biochem. Sci. 8, 364± 369. Honig, B. & Cohen, F. E. (1996). Adding backbone to protein folding: why proteins are polypeptides. Folding Design, 1, R17 ± R20. Hu, C., Sturtevant, J. M., Thomson, J. A., Erickson, R. E. & Pace, C. N. (1992). Thermodynamics of ribonuclease T1 denaturation. Biochemistry, 31, 4876± 4882. Johnson, C. M. & Fersht, A. R. (1995). Protein stability as a function of denaturant concentration: the thermal stability of barnase in the presence of urea. Biochemistry, 34, 6795± 6804. Johnson, C. M., Oliveberg, M., Clarke, J. & Fersht, A. R. (1997). Thermodynamics of denaturation of mutants of barnase with disul®de crosslinks. J. Mol. Biol. 268, 198± 208. Katz, B. A. & Kossiakoff, A. (1986). The crystallographically determined structures of atypical strained dis-
284 ul®des engineered into subtilisin. J. Biol. Chem. 33, 15480± 15485. Kauzmann, W. (1959). Some factors in the interpretation of protein denaturation. Advan. Protein Chem. 14, 1 ±63. Kraulis, P. (1991). Molscript, a program to produce both detailed and schematic plots of protein structures. J. Appl. Crystallog. 24, 946± 950. Laity, J. H., Lester, C. C., Shimotakahara, S., Zimmerman, D. E., Montelione, G. T. & Scheraga, H. A. (1997). Structural characterization of an analog of the major rate-determining disul®de folding intermediate of bovine pancreatic ribonuclease A. Biochemistry, 36, 12683± 12699. Lee, B. & Richards, F. M. (1971). The interpretation of protein structures: estimation of static accessibility. J. Mol. Biol. 55, 379± 400. Lee, K. H., Xie, D., Friere, E. & Amzel, L. M. (1994). Estimation of changes in side chain con®gurational entropy in binding and folding: general methods and applications to helix formation. Proteins: Struct. Funct. Genet. 20, 68 ±84. Lees, C. W. & Hartley, R. W. (1966). Studies on Bacillus subtilis ribonuclease. III. puri®cation and amino acid composition. Biochemistry, 5, 3951± 3960. Liu, Y. & Sturtevant, J. M. (1996). The observed change in heat capacity accompanying the thermal unfolding of proteins depends on the composition of the solution and on the method employed to change the temperature of unfolding. Biochemistry, 35, 3059± 3062. Makhatadze, G. I. & Privalov, P. L. (1995). Energetics of protein structure. Advan. Protein Chem. 47, 307± 425. Makhatadze, G. I., Clore, G. M. & Gronenborn, A. M. (1995). Solvent isotope effect and protein stability. Nature Struct. Biol. 2, 852± 855. Mayr, L. M., Odefey, C., Schutkowski, M. & Schmid, F. X. (1996). Kinetic analysis of the unfolding and refolding of ribonuclease T1 by a stopped-¯ow double-mixing technique. Biochemistry, 35, 5550± 5561. McCrary, B. S., Edmondson, S. P. & Shriver, J. W. (1996). Hyperthermophile protein folding thermodynamics: differential scanning calorimetry and chemical denaturation of Sac7d. J. Mol. Biol. 264, 784± 805. McCrary, B. S., Bedell, J., Edmondson, S. P. & Shriver, J. W. (1998). Linkage of protonation and anion binding to the folding of Sac7d. J. Mol. Biol. 276, 203± 224. McDonald, I. K. & Thornton, J. M. (1994). Satisfying hydrogen bonding potential in proteins. J. Mol. Biol. 238, 777± 793. McNutt, M., Mullins, L. S., Raushel, F. M. & Pace, C. N. (1990). Contribution of histidine residues to the conformational stability of ribonuclease T1 and mutant Glu-58 ! Ala. Biochemistry, 29, 7572± 7576. Mossakowska, D. E., Nyberg, K. & Fersht, A. R. (1989). Kinetic characterization of the recombinant ribonuclease from Bacillus amyloliquefaciens (Barnase) and investigation of key residues in catalysis by sitedirected mutagenesis. Biochemistry, 28, 3843 ±3850. Murphy, K. P. & Friere, E. (1992). Thermodynamics of structural stability and cooperative folding behavior in proteins. Advan. Protein Chem. 43, 313± 361. Myers, J. K. & Pace, C. N. (1996). Hydrogen bonding stabilizes globular proteins. Biophys. J, 71, 2033± 2039.
Microbial Ribonuclease Stability Myers, J. K., Pace, C. N. & Scholtz, J. M. (1995). Denaturant m values and heat capacity changes: relation to changes in accessible surface areas of protein unfolding. Protein Sci. 4, 2138± 2148. Myers, J. K., Pace, C. N. & Scholtz, J. M. (1997). Helix propensities are identical in proteins and peptides. Biochemistry, 36, 10923± 10929. Nicholson, E. M. & Scholtz, J. M. (1996). Conformational stability of the Escherichia coli HPr protein: test of the linear extrapolation method and a thermodynamic characterization of cold denaturation. Biochemistry, 35, 11369± 11378. Nishimura, S. & Nomura, M. (1959). Ribonuclease of Bacillus subtilis. J. Biochem. (Tokyo), 46, 161±167. Okorokov, A. L., Hartley, R. W. & Panov, K. I. (1994). An improved system for ribonuclease Ba expression. Protein Express. Puri®cat. 5, 547± 552. Oliveberg, M., Vuilleumier, S. & Fersht, A. R. (1994). Thermodynamic study of the acid denaturation of barnase and its dependence on ionic strength: evidence for residual electrostatic interactions in the acid/thermally denatured state. Biochemistry, 33, 8826± 8832. Pace, C. N. (1986). Determination and analysis of urea and guanidine hydrochloride denaturation curves. Methods Enzymol. 131, 266±280. Pace, C. N. (1990a). Conformational stability of globular proteins. Trends Biochem. Sci. 15, 14 ± 17. Pace, C. N. (1990b). Measuring and increasing protein stability. Trends Biotechnol. 8, 93 ± 98. Pace, C. N. (1995). Evaluating the contribution of hydrogen bonding and hydrophobic bonding to protein folding. Methods Enzymol. 259, 538± 554. Pace, C. N. & Creighton, T. E. (1986). The disulphide folding pathway of ribonuclease T1. J. Mol. Biol. 188, 477± 486. Pace, C. N. & Grimsley, G. R. (1988). Ribonuclease T1 is stabilized by cation and anion binding. Biochemistry, 27, 3242± 3246. Pace, C. N. & Laurents, D. V. (1989). A new method for determining the heat capacity change for protein folding. Biochemistry, 28, 2520± 2525. Pace, C. N. & Scholtz, J. M. (1996). Measuring the conformational stability of a protein. In Protein Structure: A Practical Approach (Creighton, T. E., ed.), pp. 299± 321, IRL Press, Oxford. Pace, C. N., Grimsley, G. R., Thomson, J. A. & Barnett, B. J. (1988). Conformational stability and activity of ribonuclease T1 with zero, one, and two intact disul®de bonds. J. Biol. Chem. 263, 11820± 11825. Pace, C. N., Laurents, D. V. & Thomson, J. A. (1990). pH dependence of the urea and guanidine hydrochloride denaturation of ribonuclease A and ribonuclease T1. Biochemistry, 29, 2564± 2572. Pace, C. N., Heinemann, U., Hahn, U. & Saenger, W. (1991). Ribonuclease T1: structure, function, and stability. Angew. Chem. Int. Ed. Engl. 30, 343± 360. Pace, C. N., Laurents, D. V. & Erickson, R. E. (1992). Urea denaturation of barnase: pH dependence and characterization of the unfolded state. Biochemistry, 31, 2728± 2734. Pace, C. N., Shirley, B. A., McNutt, M. & Gajiwala, K. (1996). Forces contributing to the conformational stability of proteins. FASEB J, 10, 75 ± 83. Privalov, P. L. & Gill, S. J. (1988). Stability of protein structure and hydrophobic interaction. Advan. Protein Chem. 39, 193± 234. Privalov, P. L. & Khechinashvili, N. N. (1974). A thermodynamic approach to the problem of stabiliz-
Microbial Ribonuclease Stability ation of globular protein structure: a calorimetric study. J. Mol. Biol. 86, 665± 684. Privalov, P. L., Tiktopulo, E. I., Venyaminov, S. Y., Griko, Y. V., Makhatadze, G. I. & Khechinashvili, N. N. (1989). Heat capacity and conformation of proteins in the denatured state. J. Mol. Biol. 205, 737± 750. Radzicka, A. & Wolfenden, R. (1988). Comparing the polarities of the amino acids: side-chain distribution coef®cients between the vapor phase, cyclohexane, 1-octanol, and neutral aqueous solution. Biochemistry, 27, 1644± 1670. Rico, M., Santoro, J., Gonzalez, C., Bruix, M. & Niera, J. L. (1991). Structure, Mechanism and Function of Ribonucleases. Proceedings of the 2nd International Meeting Held in Sant Feliu de Guixols, Girona Spain. (Cuchillo, C. M., de Lorans, R., Nogues, M. V. & Pares, X., eds), pp. 9 ± 14, IBF Publications, Barcelona. Rosenberg, H. F., Dyer, K. D., Tiffany, H. L. & Gonzalez, M. (1995). Rapid evolution of a unique family of primate ribonuclease genes. Nature Genet. 10, 219± 223. Salahuddin, A. & Tanford, C. (1970). Thermodynamics of the denaturation of ribonuclease by guanidine hydrochloride. Biochemistry, 9, 1342± 1347. Sali, D., Bycroft, M. & Fersht, A. R. (1988). Stabilisation of protein structure by interaction of an alpha-helix dipole with a charged side-chain. Nature, 335, 496± 500. Santoro, M. M. & Bolen, D. W. (1988). Unfolding free energy changes determined by the linear extrapolation method. 1. Unfolding of phenylmethanesulfonyl a-chymotrypsin using different denaturants. Biochemistry, 27, 8063± 8068. Sato, K. & Egami, F. (1957). Studies on ribonucleases in takadiastase. I. J. Biochem. (Tokyo), 44, 753±767. Schein, C. H. (1997). From housekeeper to microsurgeon: the diagnostic and therapeutic potential of ribonucleases. Nature Biotech. 15, 529± 536. Scholtz, J. M. (1995). Conformational stability of HPr: the histidine-containing phosphocarrier protein from Bacillus subtilis. Protein Sci. 4, 35 ±43. Schrier, E. E. & Schrier, E. B. (1967). The salting-out behavior of amides and its relation to the denaturation of proteins by salts. J. Phys. Chem. 71, 1851± 1860. Schwarz, F. P. & Kirchoff, W. H. (1988). Biological thermodynamic data for the calibration of differential scanning calorimeters: heat capacity data on the unfolding transition of ribonuclease A in solution. Thermochimica Acta, 128, 267± 295. Sevcik, J., Sanishvili, R. G., Pavlovsky, A. G. & Polyakov, K. M. (1990). Comparison of active sites of some microbial ribonucleases: structural basis for guanylic speci®city. Trends Biochem. Sci. 15, 158± 162. Sevcik, J., Dodson, E. J. & Dodson, G. G. (1991). Determination and restrained least-squares re®nement of the structures of ribonuclease Sa and its Ê resolution. complex with 30 -guanylic acid at 1.8 A Acta. Crystallog. Struct. Sci. sect. B, 47, 240± 253. Sevcik, J., Hill, C. P., Dauter, Z. & Wilson, K. S. (1993a). Complex of ribonuclease from Streptomyces aureofaÊ resolution. Acta Crystalciens with 20 -GMP at 1.7 A log. sect. D, 49, 267± 271. Sevcik, J., Zegers, I., Wyns, L., Dauter, Z. & Wilson, K. S. (1993b). Complex of ribonuclease Sa with cyclic
285 nucleotide and proposed model for the reaction intermediate. Eur. J. Biochem. 216, 301± 305. Sevcik, J., Dauter, Z., Lamzin, V. S. & Wilson, K. (1996). Ribonuclease from Streptomyces aureofaciens at atomic resolution. Acta. Crystallog. sect. D, 52, 327± 344. Shiao, D. F., Lumry, R. & Fahey, J. (1971). Studies of the chymotrypsinogen family of proteins. XI. Heatcapacity changes accompanying reversible thermal unfolding of proteins. J. Am. Chem. Soc. 93, 2024± 2035. Shirley, B. A., Stanssens, P., Steyaert, J. & Pace, C. N. (1989). Conformational stability and activity of ribonuclease T1 and mutants: Gln25 ) Lys, Glu58 ) Ala, and the double mutant. J. Biol. Chem. 264, 11621± 11625. Shirley, B. A., Stanssens, P., Hahn, U. & Pace, C. N. (1992). Contribution of hydrogen bonding to the conformational stability of ribonuclease T1. Biochemistry, 31, 725± 732. Spolar, R. S. & Record, M. T. (1994). Coupling of local folding to site-speci®c binding of proteins to DNA. Science, 263, 777± 784. Spolar, R. S., Livingstone, J. R. & Record, M. T. (1992). Use of liquid hydrocarbon and amide transfer data to estimate contributions to thermodynamic functions of protein folding from the removal of nonpolar and polar surface from water. Biochemistry, 31, 3947± 3977. Steyaert, J. (1997). A decade of protein engineering on ribonuclease T1: atomic dissection of the enzymesubstrate interactions. Eur. J. Biochem. 247, 1± 11. Swint, L. & Robertson, A. D. (1993). Thermodynamics of unfolding for turkey ovomucoid third domain: thermal and chemical denaturation. Protein Sci. 2, 2037± 2049. Takamine, J. (1914). Enzymes of Aspergillus oryzae and the application of its amyloclastic enzyme to the fermentation industry. Chem. News, 110, 215± 218. Tanford, C. (1964). Isothermal unfolding of globular proteins in aqueous urea solutions. J. Am. Chem. Soc. 86, 2050± 2059. Tanford, C. (1970). Protein denaturation, part C. Theoretical models for the mechanism of denaturation. Adv. Protein Chem, 24, 1 ± 95. Tsong, T. Y., Hearn, R. P., Wrathall, D. P. & Sturtevant, J. M. (1970). A calorimetric study of thermally induced conformational transitions of ribonuclease A and certain of its derivatives. Biochemistry, 9, 2666± 2677. Viguera, A. R., Martinez, J. C., Filimonov, V. V., Mateo, P. L. & Serrano, L. (1994). Thermodynamic and kinetic analysis of the SH3 domain of spectrin shows a two-state folding transition. Biochemistry, 33, 2142± 2150. von Hippel, P. H. & Wong, K. (1965). On the conformational stability of globular proteins. J. Biol. Chem. 240, 3909± 3923. Wintrode, P. L., Makhatadze, G. I. & Privalov, P. L. (1994). Thermodynamics of ubiquitin unfolding. Proteins: Struct. Funct. Genet. 18, 246± 253. Woody, R. W. (1994). Contributions of tryptophan side chains to the far-ultraviolet circular dichroism of proteins. Eur. Biophys. J. 23, 253± 262. Xu, J., Baase, W. A., Baldwin, E. & Matthews, B. (1998). The response of T4 lysozyme to large-to-small substitutions within the core and its relation to the hydrophobic effect. Protein Sci. 7, 158± 177.
286
Microbial Ribonuclease Stability
Yao, M. & Bolen, D. W. (1995). How valid are denaturant-induced unfolding free energy measurements? Level of conformance to common assumptions over an extended range of ribonuclease A stability. Biochemistry, 34, 3771± 3781.
Yu, Y., Makhatadze, G. I., Pace, C. N. & Privalov, P. L. (1994). Energetics of ribonuclease T1 structure. Biochemistry, 33, 3312± 3319. Zhang, T., Bertelsen, E. & Alber, T. (1994). Entropic effects of disulphide bonds on protein stability. Nature Struct. Biol. 1, 434± 438.
Edited by P. E. Wright (Received 30 December 1997; received in revised form 2 March 1998; accepted 3 March 1998)