INSTITUTE OF PHYSICS PUBLISHING and INTERNATIONAL ATOMIC ENERGY AGENCY
NUCLEAR FUSION
Nucl. Fusion 46 (2006) S307–S312
doi:10.1088/0029-5515/46/6/S11
Measurement of the electron energy distribution function by a Langmuir probe in an ITER-like hydrogen negative ion source B. Crowley1 , D. Homfray1 , S.J. Cox1 , D. Boilson2 , H.P.L. de Esch3 and R.S. Hemsworth3 1 2 3
Euratom/UKAEA Fusion Association, Culham Science Centre, Abingdon, OX14 3DB, UK Association Euratom/DCU, Dublin City University, Dublin 9, Ireland Association Euratom-CEA, CEA Cadarache, F-13108, St. Paul lez Durance, France
Received 5 July 2005, accepted for publication 23 December 2005 Published 23 May 2006 Online at stacks.iop.org/NF/46/S307 Abstract Determining d2 I /dV 2 from a traditional Langmuir probe trace using numerical techniques is inherently noisy and generally yields poor results. We have developed a Langmuir probe system based on a method first used in the 1950s by Boyd and Twiddy (1959 Proc. R. Soc. A 53 250). The system measures the 2nd derivative directly. This paper presents an account of the experimental method, apparatus and software used along with some preliminary results from the KAMABOKO III source including a comparison with conventional probe methods. PACS numbers: 52.27.Cm, 41.75.Cn, 52.59.−f, 52.70.−m
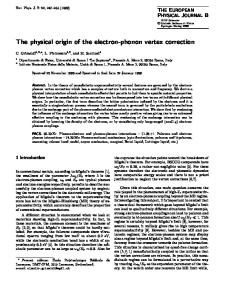
1. Introduction The development of a high yield H− (or D− ) ion source capable of long pulse operation is an essential step towards the realization of a neutral beam heating system for ITER. In Cadarache, development on negative ion sources is being carried out on the KAMABOKO III ion source (an ITER-like source, i.e. a caesiated, filamented, multi-pole arc discharge source). The system is fully described elsewhere [2]. A key feature of the ion source is the separation of the driver region from the extraction region by means of the magnetic filter field. The filter field keeps the electron temperature at the extraction grid low in order to minimize the destruction of H− ions through the process of electron detachment (e + H− → e + H + e). The cross section for this process increases by three orders of magnitude over the electron energy range from 1 to 10 eV. Hence for optimization of the source it is important to know the electron temperature. To this end a Langmuir probe is used to measure the plasma parameters (Te , ne and Vp ) in front of the extraction grid. However, the electron energy distribution function (EEDF) in low pressure plasmas is generally non-Maxwellian even at the low electron energy range and the application of conventional theory can lead to significant errors. In non-Maxwellian plasmas, the electron temperature can be thought of as an effective 0029-5515/06/060307+06$30.00
© 2006 IAEA, Vienna
Gas Inlet
S N S
N
S N
N
S
S
N
N
S N
S
S
N
250
Figure 1. Cross section of the KAMABOKO III ion source.
electron temperature corresponding to a mean electron energy determined from the integrals of the EEDF. Druyvesteyn [3] √ shows that the EEDF is proportional to V (d2 I /dV 2 ), where d2 I /dV 2 is the second derivative of the probe current–voltage characteristic.
Printed in the UK
S307
B. Crowley et al
2. Background Langmuir probes are vital diagnostic tools in the study of low pressure weakly ionized plasmas. Local measurements of various plasma parameters are possible using Langmuir probes, making them superior to many other diagnostic techniques. These strongly non-equilibrium plasmas are characterized by an electron temperature that is much higher than the ion or neutral gas temperature. Moreover the EEDF itself is generally non-Maxwellian, particularly in arc driven systems where the plasma is sustained by primary electrons falling through a potential of approximately 100 V. Many probe theories [4–6, 8] have been developed over the years to determine the plasma parameters from probe traces under various conditions. These theories apply to either ion collection by a probe or electron collection assuming a Maxwellian electron distribution. Analysis of nonMaxwellian plasmas using these techniques yields misleading results [7]. The Druyvesteyn [3] extension of the Langmuir and Mott–Smith probe theory [8] allows the determination of the electron energy spectrum. Druyvesteyn shows that the EEDF may be found from the expression, � � 2m� 1/2 d2 I 2 , (1) N(�) = Ae2 e dV 2 where N(�) is the number of electrons with energy in the internal [e�,� + d�] eV, V is the probe voltage, � is the probe voltage with respect to the plasma potential Vp , (� = Vp − V ), A is the probe area, d2 I /dV 2 is the second derivative of the current–voltage characteristic and e and m are the electronic charge and mass. The electron density, ne , is obtained from the integral of N(�). � ∞
ne =
N(�) d�.
(2)
0
In the case of a non-Maxwellian electron energy distribution the electron temperature can be thought of as an effective electron temperature defined as, � ∞ 2 2 Teff = ��� = �N(�) d�. (3) 3 3ne 0 However determining d2 I /dV 2 from a traditional Langmuir probe trace using numerical techniques is inherently noisy and generally yields poor results. In this paper we present an alternative method first used in the 1950s by Boyd and Twiddy [1]. The method is to superimpose a modulated ac voltage (em ) on the probe voltage V ; the superimposed voltage can be represented as � � �� 1 2 1 em = E + cos pt − cos 3pt + · · · , etc cos ωt, 2 π 3 (4) where E is the peak of the modulated signal and p and ω are the frequencies of the modulation and carrier signals, respectively. By Taylor’s theorem the probe current can be expressed as I = f (V + em ) = f (V ) + em f � (V ) + S308
2 em f �� (V ) · · · . 2!
The component of current measured at frequency p receives contributions only from even-order derivatives, provided that ω is not a multiple of p, and is given by � 2 � � � E 1 �� E4 3 1 1 ���� ip = f (V ) + + 2 f (V ) + · · · , etc 2! π 4! 8 4 π × cos pt. (5) Terms involving the fourth and higher order derivatives can be neglected; hence, the second derivative may be obtained from a direct measurement of ip . In practical units the EEDF is given by N(�) =
8π � m� �1/2 ip (rms) (eV)−1 cm−3 . A e3 E2
(6)
The effect of the finite value of the ac amplitude on the measurement of the 2nd derivative as reported in [9] was minimised by varying the value of E from 0.1 V just below the expected plasma potential where the 2nd derivative is high to 1 V in the ion collection region where the 2nd derivative is small. This variation was done in an exponential fashion in order to optimize simultaneously the signal to noise ratio and the energy resolution. This system was tested on a variety of passive circuits with non-linear current-voltage characteristics and the instrument was found to reproduce faithfully (to within 1%) the expected 2nd derivative. 2.1. Caveat The validity of the Druyvesteyn formula (equation (1)) is limited by the condition λe � rs where rs is the radius of the sheath around the probe and λe is the electron mean free path. In the case of the probe operating in a magnetic field the limiting condition is ρe � rs where ρe is the Larmor radius of the electron [10, 11]. All the results presented in this paper pertain to low pressure scenarios (∼0.3 Pa) where the condition, λe � rs , holds true and the condition, ρe � rs , holds true for all data except data points measured closed to the edge of the plasma (the first point in figure 7). In the cases where these conditions are not met electron depletion will cause distortions of the second derivative of the probe characteristic, hence the actual measurement is not d2 I /dV 2 but rather the measurement is a convolution of d2 I /dV 2 and the � instrumental function of the differentiating method ψ(V −V ), i.e. what is measured is � 2 d2 J d I � � = φ(V − V ) dV . (7) dV 2 dV � 2 To correctly obtain the EEDF a deconvolution procedure must � be applied and knowledge of ψ(V − V ) is required. Results obtained with a spherical probe and analysed with the more sophisticated deconvolution procedure will be the subject of a future publication.
3. Experimental set-up 3.1. Hardware The cylindrical tungsten probe is 0.5 cm long with a radius of 50 µm. The probe is mounted on a ceramic shaft that is housed in a bellows-type motorized linear drive mechanism.
Hydrogen negative ion source 1.5
Kepco Power supply
Plasma
PC Probe
0.5
2
d I/dV
2
1.0
Isolation Amplifier
Figure 2. Schematic of the experimental set-up.
0.0 2
2
2
2
d I/dV Numerical
100
d I/dV Boyd-Twiddy -0.5 -10
Probe Current (mA)
80
-8
-6
-4
-2
0
2
4
6
8
10
Probe Voltage (V)
Figure 4. 2nd derivative of the I –V curve showing the numerical and BT method. Measurement taken at the centre of the discharge with arc power is 47 kW and the gas pressure, 0.3 Pa.
60
40
20 11
10
0
-2
0
2
4
6
8
10
12
14
16
18
20
Probe Voltage (V)
Figure 3. Langmuir probe trace raw data and electron current best fit.
This allows precise positioning of the probe for spatial scans across the plasma grid. The controlling PC contains a National Instruments M-series data acquisition card. The card is a 16 bit 2.5 M samples s−1 with 4 analog output and 16 analog input channels. Output channels from the card are connected to a KEPCO bipolar operational power supply. The power supply has a voltage range of ±100 V, a current rating of 1 A and 20 kHz bandwidth. The output of the power supply is connected to the probe and the current drawn on the probe fed to a two-channel isolation amplifier. The signal at one channel has its dc component removed before amplification via a suitable gain resistor to a −10 to 10 V signal which is returned to the data acquisition card for analysis. The other signal is ac filtered, amplified and returned to the data acquisition card. The PC and all the electronics are powered from the mains through an isolation transformer and the common ground for all the equipment is the source wall.
-3
-4
10
10
-1
-6
EEDF eV cm
-8
9
10
EEDF Maxwellian Fit Te=2 eV Druyvesteyn Fit Teff=2.98 eV 8
10
0
1
2
3
4
5
6
7
8
9
10
11
12
13
14
16
17
Figure 5. Plot of EEDF with fitted Maxwellian and Druyvesteyn distributions. Measurement taken at the centre of the discharge with arc power is 47 kW and the gas pressure, 0.3 Pa.
-3.8
-4.0
-4.2
-4.4 I raw data Ith (OML) Ith (BRL) Ith(ABR)
3.2. Software -4.6
A LabVIEW™ computer program was developed to run the data acquisition and the data analysis. The program generates the output waveform to the Kepco power supply. The output waveform consists of a dc bias with the modulated ac signal (em ) superimposed. The frequency settings used throughout were ω = 10 kHz and p = ω/(2π), the dc bias was swept from −20 to 20 V and E was varied from 0.01 to 1 V. See figure 2. The program reads the probe current signals and filters the ac channel using a software fast Fourier transform bandpass
15
Electron Energy (eV)
Probe Current (mA)
-20 -10
data Ith Langmuir Theory
-8
-7
-6
-5
-4
-3
-2
Probe Voltage (V)
Figure 6. The ion current fitted to ABR OML and BRL theories of ion collection.
filter and records the rms value of the required frequency component as a function of applied dc probe voltage. The dc value of the probe current is also recorded in order to generate a traditional Langmuir probe trace for comparison. S309
B. Crowley et al
Table 1. Summary of results from the I –V curve shown in figure 3. Vp (V)
Vf (V)
Te (LMS) (eV)
Teff (BT) (eV)
ne (BT) (cm−3 )
ne (LMS) (cm−3 )
ne (OML) (cm−3 )
ne (ABR) (cm−3 )
ne (BRL) (cm−3 )
7.6
1.56
2.05
2.98
1.6 × 10¹²
9 × 10¹¹
1.5 × 10¹²
5.5 × 10¹¹
1.7 × 10¹²
4. Analysis
35
In all cases the pertinent data are extracted from the trace and are fitted to the theory using the Levenberg–Marquart nonlinear fitting method. Classical Langmuir theory determines an electron temperature based on the assumption that the electrons have a Maxwellian distribution. OML, BRL and ABR theories can be used to infer electron temperature but these methods are very unreliable as only a small portion of the electrons in the high energy range are considered. The energy distribution in this range is very likely to differ from the rest of the distribution unless there is a strong influence of electron–electron interactions. Hence it is preferable to use Langmuir theory to infer Te and then use this value to fit the OML, BRL and ABR theories.
5. Results Figures 3–6 show the data obtained for a typical shot. In this case the probe was positioned near the centre of the discharge, the arc power was 47 kW and the gas pressure was 0.3 Pa. The results are summarized in table 1. Figure 3 shows the Langmuir probe I –V curve raw data (open circles); these data are fitted to the classical Langmuir theory (solid line) applied to the electron retardation region when the probe potential is less than the plasma potential. The theory assumes a Maxwellian electron distribution but it is clear from the figure that the theory does not fit the data very well between 2 and 6 V. The 2nd derivative of the I –V curve from figure 3 is presented in figure 4. The figure also shows the 2nd derivative as obtained by both a standard numerical method (· · · · · ·) and the Boyd– Twiddy method (—•—). Obtaining the result by a numerical method requires smoothing of the data between successive differentiation operations and the outcome is subject to the choice of the smoothing method employed [12]. The Boyd– Twiddy method, on the other hand, does not require any S310
ne (BRL) ne (BT)
-3
25
11
20 15 10 5 5 0
Te (LMS) Teff (BT)
Te (eV)
4 3 2 1 15 0 10
Vp, Vf (Volts)
(i) The orbital motion limited (OML) theory of ion collection [5, 8]. (ii) The Allen–Boyd–Reynolds (ABR) radial motion theory of ion collection [4]. (iii) Bernstein–Rabinowitz–Laframboise (BRL) theory of ion collection [6]. (iv) Classical Langmuir–Mott Smith (LMS) theory for electron collection [8].
ne (10 cm )
30
The data analysis is performed in a separate program module. Firstly the plasma potential is found from the zero of the 2nd derivative. The EEDF is then determined and the integrals evaluated to obtain the electron density and the effective electron temperature. The EEDF data is fitted to the Druyvesteyn formula, N(�) = a� 0.5 exp(b� c ), using a non-linear least squares fitting method. The traditional Langmuir probe I –V characteristic trace is analysed using the following methods.
5 0
Vp Vf
-5 -10 0
20
40
60
80
100
120
140
160
180
Position (mm)
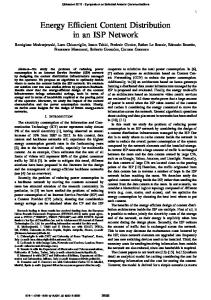
Figure 7. Plasma parameters as a function of position from the edge to the centre of the source. The arc power was 47 kW and the pressure, was 0.3 Pa.
subjective analysis and it results in a smoother curve than the former method. The plasma potential is found from the zero of the 2nd derivative to be 7.6 ± 0.5 V and the floating potential is found from the zero of the Langmuir probe trace to be 1.56 V. The error in the measured value of the plasma potential can translate to an error of up to 20% in the parameters derived using this value. The data from the 2nd derivative (Boyd– Twiddy method) are used together with the measured plasma potential to evaluate the EEDF. This EEDF is shown in figure 5 where it fitted to the Druyvesteyn formula, N (�) = a� 0.5 exp(b� c ), for two values of parameter c, i.e. c = 1 for a Maxwellian distribution and for a least squares best fit value for c in the Druyvesteyn formula. It is clear that a Maxwellian is not the best fit for the data. Integrating the data from figure 5 according to equations (3) and (4) gives ne = 1.6 × 1012 cm−3 and Teff = 2.98 eV. Analysis of the electron retardation region of the I –V curve using classical Langmuir theory yields ne = 9 × 1011 cm−3 and Te = 2.05 eV. An increase from 2 to 3 eV in the electron temperature results in a change from 1 × 10⁻¹⁷ cm2 to 1.1 × 10⁻¹⁶ cm2 in the value of the cross section for electron impact detachment of H− [13].
Hydrogen negative ion source 15
20
11
-3
ne (10 cm )
11
-3
ne (10 cm )
15 10
5
ne (BRL) ne (BT)
Te (LMS) Teff (BT)
Te (eV)
3 2
2
1
1
10 0
10
8
8
Vp, Vf (Volts)
Te (eV)
4
6 4
Vp Vf
2 0 0.1
ne (BRL) ne (BT)
5 0 3
5 0
Vp, Vf (Volts)
10
Te (LMS) Teff (BT)
6 4
Vp Vf
2 0
0.2
0.3
0.4
0.5
20
40
60
Power (kW)
Pressure (Pa)
Figure 8. Plasma parameters measured at the centre of the discharge as a function of pressure. The arc power was 47 kW.
Figure 9. Plasma parameters in the centre of the discharge as a function of arc power. The pressure was 0.3 Pa.
Figure 6 shows the ionic current fitted to the different theories of ion collection. It was found that the BRL theory fits the data better than the others. This is not surprising since the BRL theory is the most complete (and most difficult to implement), taking into account sheath expansion, collisions and finite ion temperature. The BRL theory is fitted to the data following a procedure described in [14]. The plasma parameters were measured as a function of arc power, source pressure, anode–cathode voltage and as a function of probe position. A summary of the results is presented in figures 7–10. In each figure the plasma potential and the floating potential are presented together on the bottom graph, Te and Teff are presented on the middle graph and the plasma density is presented on the top graph. Figure 7 shows the plasma parameters as a function of position from the edge to the centre of the source. The axial position is 1 cm from the extraction grid. For the scan the arc power was kept at a constant 47 kW and the source pressure was 0.3 Pa. It is found that the plasma potential is almost constant across the source and that the electron temperature decreases towards the centre of the source and that Teff is consistently about 1 eV greater than Te . The plasma density decreases significantly towards the centre of the source. This non-uniform plasma density across the source makes it difficult to extract a uniform large area beam from the source. Figure 8 shows the results of a pressure scan. The power was 47 kW and the results presented are for the central position.
The density is maximum at 0.3 Pa and the electron temperature decreases with increasing pressure. The results of the power scan measured in the centre of the discharge with source pressure of 0.3 Pa is shown in figure 9. The figure shows that the density increases strongly (from 5 × 10¹¹ to 1.5 × 1012 cm−3 ) over a power range, 25–65 kW, whilst the electron temperature increases only slightly (<1 eV) across the same power range. Figure 10 shows the plasma parameters for three values of anode–cathode voltage from 73 to 93 V. The variation seems to have little effect on Te but the density increases from 7 × 10¹¹ to 1.4 × 1012 cm−3 .
6. Conclusion Plasma parameters in the KAMABOKO III source were determined and the EEDF was found to be non-Maxwellian with an effective electron temperature higher than the inferred Maxwellian temperature. A higher effective electron temperature, in the extraction region, has an effect on both the production and the destruction of negative ions. Firstly one would expect an increase in the negative ion destruction due to electron detachment. The higher electron temperature would also lead to a reduction in negative ion production due to dissociative attachment. The rate coefficient for H− production via the dissociative attachment channel was calculated for a Maxwellian distribution with Te = 1 and real distribution of Teff = 2. It was found that the rate coefficient is about S311
B. Crowley et al
11
-3
ne (10 cm )
15
10
ne (BRL) ne (BT) 3 5
Te (eV)
2
also capable of analysing the I –V trace using a variety of common procedures. The EEDF as determined by both numerical differentiation and the direct 2nd derivative (Boyd–Twiddy) method have been compared. Both methods gave a similar form for the EEDF but the form of the numerical method depended on the smoothing method employed. Since the degree of departure of the EEDF from Maxwellian may not be known, measuring the EEDF is the most reliable way to use the Langmuir probe diagnostic.
Acknowledgment
1
Te (LMS) Teff (BT)
10 0
This work was conducted under the European Fusion Development Agreement and funded by Euratom and the UK Engineering and Physical Science Research Council.
References Vp, Vf (Volts)
8 6 4 2
Vp Vf
0 70
75
80
85
90
95
Anode Cathode Voltage (V)
Figure 10. Plasma parameters in the centre of the discharge as a function of anode–cathode voltage. The arc power was 47 kW and the pressure was 0.3 Pa.
a factor of 2 higher for the Maxwellian distribution. The same calculation for the rate coefficient for the process of negative ion destruction due to electron detachment shows an increase by a factor of 4 for the measured distribution compared with the fitted Maxwellian distribution. Hence, to model and optimize the production of negative ions, it is clearly necessary to know the form of the EEDF. A Langmuir probe system capable of directly measuring the 2nd derivative of the I –V trace has been developed and tested in the KAMABOKO III source. The probe system is
S312
[1] Boyd R.L.F. and Twiddy N.D. 1959 Proc. R. Soc. A 53 250 [2] Trainham R., Jacquot C., Riz D., Simonin A., Miyamoto K., Fugiwara Y. and Okumura Y. 1998 Rev. Sci. Instrum. 69 926 [3] Druyvesteyn M.J. 1930 Z. Phys. 64 790 [4] Allen J.E., Boyde R.L.F. and Reynolds P. 1957 Proc. Phys. Soc. (London) B 70 297 [5] Laframboise J.G. 1966 University of Toronto Institute for Aerospace Studies Report No 100 [6] Bernstein I.B. and Rabinowitz I.N. 1959 Phys. Fluid 2 112 [7] Godyak V.A., Piejak R.B. and Alexandrovich B. 1993 J. Appl. Phys. 8 73 [8] Langmuir I. and Mott-Smith H. 1924 Gen. Elect. Rev. 27 449 [9] Kilvington A.I., Jones R.P and Swift J.D. J. Sci. Instrum. 44 517 [10] Arslankekov R.R, Khromov N.A and Kudryavtsev A.A.1994 Plasma Sources Sci. Technol. 3 528 [11] Friedland L. and Kagan Yu 1979 J. Phys. D: Appl. Phys. 12 739 [12] Magnus F. and Gudmundsson J.T. 2002 Digital smoothing of the Langmuir probe I –V characteristic Report No RH-20-2002, Science Institute University of Iceland [13] Janev R.K. et al 1985 Elementary Processes in Hydrogen–Helium Plasmas (Berlin-Heidelberg: Springer) [14] Chen F.F. Plasma Diagnostic Techniques (New York: Academic) p 113, chapter 4