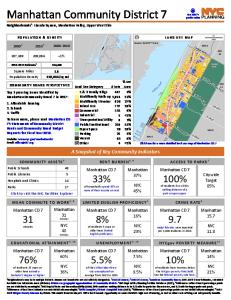
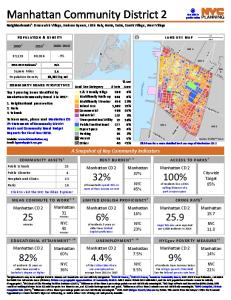
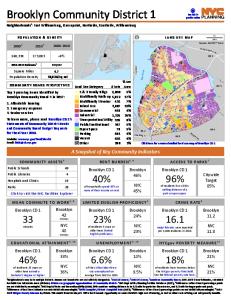
Manhattan Community District 1
See MN 1's profile online
Neighborhoods1: Battery Park City, Civic Center, Ellis Island, Governors Island, Liberty Island, South Street Seaport, Tribeca, Wall Street, World Trade Center
CO M M U N I T Y A S S E T S 5
Public Schools
Public Libraries
Hospitals and Clinics Parks
1 9
27
Click to visit the NYC Facilities Explorer
M E A N C O M M U T E T O W O R K 4, 8
Manhattan CD 1
25 minutes
Manhattan 31 minutes
NYC 40
minutes
E D U C AT I O N A L AT TA I N M E N T 4 , 1 0
Manhattan CD 1
82%
of residents 25 years or older have earned a bachelor's degree or higher
Upper New York Bay
Manhattan 60% NYC 36%
32%
of households spend 35% or more of their income on rent
Manhattan 37% NYC 45%
LI M I T E D EN GL I S H P RO FI CI EN C Y 4
Manhattan CD 1
6%
of residents 5 years or older have limited English proficiency
Manhattan 16% NYC 23%
U N E M P L OY M E N T 4 , 1 0
Manhattan CD 1
4.4%
of the civilian labor force was unemployed on average from 2011 to 2015
BK 2
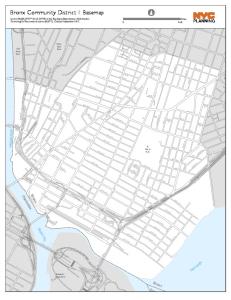
Click here for a more detailed land use map of Manhattan CD 1
R E N T B U R D E N 4, 6
Manhattan CD 1
r RD
BK 6
A Snapshot of Key Community Indicators 32
nel Tun
Website: www.nyc.gov/html/mancb1 Email:
[email protected]
y Care
To learn more, please read Manhattan CD 1's Statements of Community District Needs and Community Board Budget Requests for Fiscal Year 2018.
hL Hug
1. Affordable housing 2. Resiliency 3. Schools
FD
MN 3
Br
Top 3 pressing issues identified by Manhattan Community Board 1 in 2017:
% Lot Land Use Category # Lots Area 1 & 2 Family Bldgs 34 <1% Multifamily Walk-up 62 <1% Multifamily Elevator 174 5% Mixed Use 550 11% Commercial 363 22% Industrial 1% 87 Transportation/Utility 41 12% Public/Institutional 64 28% Open Space 4% 20 Parking 1% 26 Vacant 2% 33 Other 24 15%
St
n kly oo Br
COMMUNITY BOARD PERSPECTIVES
be rs
Ce nt re St
1.5 40,652/sq mi
Hudson Riv er
Square Miles Population Density
Ch am
N/A
wa y
+77%
Bro ad
60,978
MN 2 Ca na lS t
y
34,420
Source: PLUTOTM 16v2
Brooklyn Qu
2000-2010
Ea st Ri ve r
20103
0.5
Miles
West St
20002
2011-2015 Estimate4
LA N D U S E M A P
[
eens E xw
PO P U L ATI O N & D E N S I T Y
Manhattan 7.5% NYC 9.5%
A C C E S S TO PA R KS 7
Manhattan CD 1
100%
Citywide Target 85%
of residents live within walking distance of a park or open space
C R I M E R AT E 9
Manhattan CD 1
15.6
major felonies were reported per 1,000 residents in 2016
Manhattan 15.7 NYC 11.8
N YC g o v P O V E R T Y M E A S U R E 1 1
Manhattan CD 1
9%
of residents have incomes below the NYCgov poverty threshold. See the federal poverty rate here.
Manhattan 14% NYC 21%
Neighborhoods may be in multiple districts. Names and boundaries are not officially designated. 22000 US Census; 32010 US Census; 4American Community Survey 2011-2015 5-Year Estimates, calculated for Public Use Microdata Areas (PUMAs). PUMAs are geographic approximations of community districts. MN 1 shares PUMA 3810 with MN 2, and the ACS population estimate cannot be reliably disaggregated. 5NYC Dept of City Planning Facilites Database (2017); 6 Differences of less than 3 percentage points are not statistically meaningful. 7NYC Dept of Parks and Recreation (DPR) (2016). DPR considers walking distance to be 1/4 mile for parks less than 6 acres, and 1/2 mile for larger parks and pools. 8Differences of less than 2 minutes are not statistically meaningful. 9NYPD CompStat, Historic Complaint Data (2017); 10 Differences of less than 2 percentage points are not statistically meaningful. 11 2011-2015 NYCgov Poverty Measure by PUMA. This metric from the Mayor's Office for Economic Opportunity accounts for NYC's high cost of housing, as well as other costs of living and anti-poverty benefits.
1