ORIGINAL CONTRIBUTION
Low-Fat Dietary Pattern and Risk of Cardiovascular Disease The Women’s Health Initiative Randomized Controlled Dietary Modification Trial Barbara V. Howard, PhD; Linda Van Horn, PhD; Judith Hsia, MD; JoAnn E. Manson, MD; Marcia L. Stefanick, PhD; Sylvia Wassertheil-Smoller, PhD; Lewis H. Kuller, MD; Andrea Z. LaCroix, PhD; Robert D. Langer, MD; Norman L. Lasser, MD; Cora E. Lewis, MD; Marian C. Limacher, MD; Karen L. Margolis, MD; W. Jerry Mysiw, MD; Judith K. Ockene, PhD; Linda M. Parker, DSc; Michael G. Perri, PhD; Lawrence Phillips, MD; Ross L. Prentice, PhD; John Robbins, MD; Jacques E. Rossouw, MD; Gloria E. Sarto, MD; Irwin J. Schatz, MD; Linda G. Snetselaar, PhD; Victor J. Stevens, PhD; Lesley F. Tinker, PhD; Maurizio Trevisan, MD; Mara Z. Vitolins, DrPH; Garnet L. Anderson, PhD; Annlouise R. Assaf, PhD; Tamsen Bassford, MD; Shirley A. A. Beresford, PhD; Henry R. Black, MD; Robert L. Brunner, PhD; Robert G. Brzyski, MD; Bette Caan, DrPH; Rowan T. Chlebowski, MD; Margery Gass, MD; Iris Granek, MD; Philip Greenland, MD; Jennifer Hays, PhD; David Heber, MD; Gerardo Heiss, MD; Susan L. Hendrix, DO; F. Allan Hubbell, MD; Karen C. Johnson, MD; Jane Morley Kotchen, MD
C
LINICAL TRIALS AND OBSERVAtional studies have identified strong associations between low-density lipoprotein cholesterol (LDL-C) level and other cardiovascular disease (CVD) risk factors and dietary intake of fats, particularly
See also pp 629, 643, and 693.
Context Multiple epidemiologic studies and some trials have linked diet with cardiovascular disease (CVD) prevention, but long-term intervention data are needed. Objective To test the hypothesis that a dietary intervention, intended to be low in fat and high in vegetables, fruits, and grains to reduce cancer, would reduce CVD risk. Design, Setting, and Participants Randomized controlled trial of 48 835 postmenopausal women aged 50 to 79 years, of diverse backgrounds and ethnicities, who participated in the Women’s Health Initiative Dietary Modification Trial. Women were randomly assigned to an intervention (19 541 [40%]) or comparison group (29 294 [60%]) in a free-living setting. Study enrollment occurred between 1993 and 1998 in 40 US clinical centers; mean follow-up in this analysis was 8.1 years. Intervention Intensive behavior modification in group and individual sessions designed to reduce total fat intake to 20% of calories and increase intakes of vegetables/ fruits to 5 servings/d and grains to at least 6 servings/d. The comparison group received diet-related education materials. Main Outcome Measures Fatal and nonfatal coronary heart disease (CHD), fatal and nonfatal stroke, and CVD (composite of CHD and stroke). Results By year 6, mean fat intake decreased by 8.2% of energy intake in the intervention vs the comparison group, with small decreases in saturated (2.9%), monounsaturated (3.3%), and polyunsaturated (1.5%) fat; increases occurred in intakes of vegetables/fruits (1.1 servings/d) and grains (0.5 serving/d). Low-density lipoprotein cholesterol levels, diastolic blood pressure, and factor VIIc levels were significantly reduced by 3.55 mg/dL, 0.31 mm Hg, and 4.29%, respectively; levels of high-density lipoprotein cholesterol, triglycerides, glucose, and insulin did not significantly differ in the intervention vs comparison groups. The numbers who developed CHD, stroke, and CVD (annualized incidence rates) were 1000 (0.63%), 434 (0.28%), and 1357 (0.86%) in the intervention and 1549 (0.65%), 642 (0.27%), and 2088 (0.88%) in the comparison group. The diet had no significant effects on incidence of CHD (hazard ratio [HR], 0.97; 95% confidence interval [CI], 0.90-1.06), stroke (HR, 1.02; 95% CI, 0.90-1.15), or CVD (HR, 0.98; 95% CI, 0.92-1.05). Excluding participants with baseline CVD (3.4%), the HRs (95% CIs) for CHD and stroke were 0.94 (0.86-1.02) and 1.02 (0.90-1.17), respectively. Trends toward greater reductions in CHD risk were observed in those with lower intakes of saturated fat or trans fat or higher intakes of vegetables/fruits. Conclusions Over a mean of 8.1 years, a dietary intervention that reduced total fat intake and increased intakes of vegetables, fruits, and grains did not significantly reduce the risk of CHD, stroke, or CVD in postmenopausal women and achieved only modest effects on CVD risk factors, suggesting that more focused diet and lifestyle interventions may be needed to improve risk factors and reduce CVD risk. Clinical Trials Registration ClinicalTrials.gov Identifier NCT00000611 www.jama.com
JAMA. 2006;295:655-666 Author Affiliations are listed at the end of this article. Corresponding Author: Barbara V. Howard, PhD,
©2006 American Medical Association. All rights reserved.
MedStar Research Institute, 6495 New Hampshire Ave, Suite 201, Hyattsville, MD 20783 (barbara.v.howard @medstar.net).
(Reprinted) JAMA, February 8, 2006—Vol 295, No. 6
Downloaded from www.jama.com by xxxyyy, on November 24, 2006
655
LOW-FAT DIETARY PATTERN AND RISK OF CARDIOVASCULAR DISEASE
saturated and trans fats, cholesterol, plant products, and grains or fiber. Epidemiologic studies have demonstrated that diets low in saturated fat and cholesterol are associated with lower rates of CVD and have implicated several nutrients as determinants of CVD risk.1-6 Replacing saturated fat with polyunsaturated fat reduced cardiovascular events in some early trials.7-9 In more recent secondary prevention trials, a Mediterranean-type dietary pattern10,11 or a very low-fat eating pattern12 prevented recurrent events, and meta-analyses13,14 of recent trials of lipid-lowering drugs have documented a strong relationship between changes in LDL-C level and decreased incidence of coronary heart disease (CHD). Whether a single “healthy” diet could result in decreased risks of cancer and CVD has not been previously evaluated. The primary aim of the Women’s Health Initiative (WHI) Dietary
Modification Trial was to test whether behavioral intervention intended to produce a dietary pattern low in total fat, along with increased intakes of vegetables, fruits, and grains, would decrease the incidence of breast and colorectal cancer in postmenopausal women.15 A secondary aim was to test whether such a dietary intervention, which did not focus on the intake of specific fats, would also reduce the risk of CVD. This report compares incidence of CHD and CVD among postmenopausal women randomly assigned to either the dietary modification intervention or usual-diet comparison group during a mean of 8.1 years of follow-up. METHODS Recruitment and Dietary Intervention
Details of the study design and methods have been published.16,17 All women
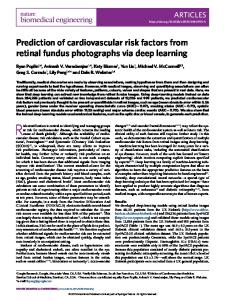
Figure 1. Participant Flow in the Dietary Modification Component of the Women’s Health Initiative 373 092 Women Initiated Screening by Providing the Eligibility Screening Form 316 953 Excluded 24 473 Refused Consent 107 210 Had <32% Energy From Fat 185 270 Consent Information Not Available 56 139 Provided Consent and Met the ≥32% Energy From Fat Eligibility Criterion 7304 Excluded∗ 1668 Nutritionist Judgment/Participant Reevaluation 2163 Administrative Ineligibility 278 Ate ≥10 Meals per Week Away From Home 229 Had History of Breast Cancer 453 Other Medical Condition 48 835 Randomized
19 541 Were Assigned to Receive Low-Fat Diet
29 294 Were Assigned to Receive Usual Diet
Status on 3/31/2005 17 674 Alive and Outcomes Data Submitted in Last 18 mo 663 Withdrew 254 Lost to Follow-up 950 Deceased
Status on 3/31/2005 26 677 Alive and Outcomes Data Submitted in Last 18 mo 890 Withdrew 273 Lost to Follow-up 1454 Deceased
19 541 Included in Primary Analyses
29 294 Included in Primary Analyses
*Categories are presented for which exclusions are known. More than 1 reason could be given for exclusion. 656 JAMA, February 8, 2006—Vol 295, No. 6 (Reprinted)
provided written informed consent, and the study was approved by the local institutional review boards as well as by the Coordinating Center institutional review board and the National Institutes of Health. Briefly, 48 835 women between the ages of 50 and 79 years were enrolled between 1993 and 1998 at 40 US clinical centers and were randomly assigned to an intervention group (40%, n = 19 541) or a usualdiet comparison group (n = 29 294) (FIGURE 1) using a randomized permuted block algorithm with blocks of size 5, 10, or 15, stratified by clinical center site and age group. Race/ ethnicity was classified by self-report, using options outlined on the personal data form completed by all participants at baseline. Eligibility criteria included being postmenopausal and consuming at baseline a diet with fat intake of 32% or more of total calories, as assessed by a food frequency questionnaire (FFQ). Major exclusions for WHI included prior breast or colorectal cancer, other cancers except nonmelanoma skin cancer in the last 10 years, medical conditions with predicted survival less than 3 years, and adherence concerns such as alcoholism. Additional trialspecific exclusions included type 1 diabetes and frequent consumption of meals prepared away from home. The intervention was designed to promote dietary change with the goals of reducing intake of total fat to 20% of energy intake (in kilocalories) by increasing intake of vegetables and fruits to at least 5 servings daily and of grains to at least 6 servings daily. The intervention did not include total energy reduction or weight loss goals. Although not a separate focus of the intervention, it was presumed that by reducing total fat intake to 20% kcal, intake of saturated fat would also be reduced (7% energy intake). The intensive behavioral modification program involved 18 group sessions in the first year and quarterly maintenance sessions thereafter, led by specially trained and certified nutritionists. Each participant was as-
©2006 American Medical Association. All rights reserved.
Downloaded from www.jama.com by xxxyyy, on November 24, 2006
LOW-FAT DIETARY PATTERN AND RISK OF CARDIOVASCULAR DISEASE
signed her own fat-gram goal, calculated on the basis of height. Participants self-monitored total fat-gram intake and also servings of vegetables, fruits, and grains. No formal intervention regarding saturated fat, cholesterol, trans fatty acids, or other known atherogenic factors was provided. Details of the dietary intervention have been published.16-18 Group activities were supplemented during the intervention period by individual interviews that used validated reflective listening techniques, 1 9 targeted-message campaigns, and personalized feedback on fat intake. Individual contacts were completed by telephone or mail. Women in the comparison group received a copy of the Dietary Guidelines for Americans,20 as well as other healthrelated materials, but had no contact with the nutrition interventionists. All participants were also invited to participate concurrently in one of the other WHI controlled trials of hormone therapy (HT) (estrogen alone or with progestin).21 Participation in a trial of calcium and vitamin D supplementation (CaD) was offered after 1 year.22 In total, 20 592 (42.2%) joined only the Dietary Modification Trial, 8050 (16.5%) the Dietary Modification plus HT Trial, 25 210 (51.6%) the Dietary Modification plus CaD Trial, and 5017 (10.3%) all 3 trials. Details of the HT and CaD trials have been published.15,21,22,24 Based on the intent-to-treat criteria, participants were followed up from the date of entry until death, loss to followup, time of a request for no further contact, or until the trial’s planned completion date, regardless of their adherence to the dietary intervention. All participants were contacted by clinic staff at 6-month intervals to provide information on health outcomes. Height, weight, waist circumference, and blood pressure were measured at annual visits using standardized procedures. Fasting blood samples were collected at baseline and at year 1 from all participants and from a 5.8% (n = 2816) subsample of women at years 3 and 6. The subsample was randomly chosen with
oversampling of minority women in which the odds for selection were 6-fold higher than for white women. Physical activity was assessed at baseline and at years 1, 3, 6, and 9; questions assessed walking and participation in sports, and hours of activity per week were calculated for each participant. Physical activity was expressed as metabolic equivalent tasks per week for the analysis. All participants completed an FFQ designed specifically for the study23 at baseline and 1 year. Thereafter, one third of the participants completed the FFQ each year in a rotating sample; completion rates were 100% at baseline and 81% thereafter. Data on follow-up dietary intake were computed from FFQs administered from years 5 through 7 (designated as year 6 followup), thus including all participants. Four-day food records were provided by all women prior to randomization.
those occurring during surgery were included if they met established criteria. Silent MI was diagnosed by comparing baseline and follow-up ECGs at 3, 6, and 9 years after randomization. Coronary heart disease death was defined as death consistent with CHD as the underlying cause plus 1 or more of the following: preterminal hospitalization with MI within 28 days of death; previous angina or MI and no potentially lethal noncoronary disease process; death resulting from a procedure related to coronary artery disease; or death certificate consistent with CHD as the underlying cause. Stroke diagnosis was based on the rapid onset of a neurologic deficit lasting more than 24 hours or until death, requiring hospitalization and supported by imaging studies when available. Coronary revascularization procedures were validated by medical record review. Design and Data Analysis
Outcome Ascertainment
Methods for ascertaining and classifying outcomes have been published previously.24-26 Electrocardiograms (ECGs) were digitally acquired every 3 years and analyzed by a core laboratory. Women completed a medical update questionnaire every 6 months; medical records for all overnight hospitalizations and outpatient coronary revascularization procedures were reviewed by central physician adjudicators (for CHD death) or trained local adjudicators (for all other coronary end points), all blinded to treatment assignment. For this analysis, major CHD, the outcome variable that was designated in the trial design, was defined as acute myocardial infarction (MI) requiring overnight hospitalization or silent MI determined from serial ECGs or CHD death; composite CHD was defined to include MI, CHD death, and coronary revascularization. Cardiovascular disease includes composite CHD and ischemic and hemorrhagic stroke. The diagnosis of acute MI was established according to an algorithm that included cardiac pain, enzyme levels, and ECG readings. Aborted MIs and
©2006 American Medical Association. All rights reserved.
Adherence assumptions included 13% lower percentage energy intake from fat in the intervention compared with the comparison group 1 year after randomization, diminishing to an 11% energy difference at 9 years. These assumptions led to a projected 14% lower CHD incidence in the intervention vs the comparison group. However, the achieved difference in percentage energy from fat was only about 70% of design assumptions. This reduction, along with a comparison group incidence rate that is about two thirds of the design rate, leads to a projected power of only approximately 40% over the 8.1-year follow-up period, under other design assumptions. All primary analyses were based on the intent-to-treat principle and used time-to-event methods, defined to be the number of days from randomization to the first postrandomization diagnosis. For silent MIs, the date of the follow-up ECG applied. A woman with self-report but without the diagnosis was censored for that event at the time of her last follow-up contact. Primary outcome comparisons are presented as hazard ratios (HRs) and
(Reprinted) JAMA, February 8, 2006—Vol 295, No. 6
Downloaded from www.jama.com by xxxyyy, on November 24, 2006
657
LOW-FAT DIETARY PATTERN AND RISK OF CARDIOVASCULAR DISEASE
Table 1. Baseline Characteristics of the Dietary Modification Trial Participants (N = 48 835) No. (%) Intervention (n = 19 541)
Characteristic Age group at screening, y 50-59 60-69 70-79 Mean (SD) Race/ethnicity White Black Hispanic American Indian/Alaskan Native Asian/Pacific Islander Unknown Annual family income, $ ⬍10 000 10 000-19 999 20 000-34 999 35 000-49 999 50 000-74 999 ⱖ75 000 Body mass index* ⬍25 25-⬍30 ⱖ30 First-degree relative with premature MI No Yes Postmenopausal hormone therapy, y Estrogen alone None ⬍5 ⱖ5 Estrogen plus progestin None ⬍5 ⱖ5 Smoking Never or past Current Hypertension (treated or BP ⱖ140/90 mm Hg) No Yes History of hypercholesterolemia requiring medication No Yes Treated for diabetes (pills or injections) No Yes History of cardiovascular disease MI Stroke CABG surgery or PCI Aspirin use (ⱖ80 mg/d) No Yes The metabolic syndrome† No Yes
Comparison (n = 29 294)
P Value
7206 (36.9) 9086 (46.5) 3249 (16.6) 62.3 (6.9)
10 797 (36.9) 13 626 (46.5) 4871 (16.6) 62.3 (6.9)
15 869 (81.2) 2137 (10.9) 755 (3.9) 88 (0.5) 433 (2.2) 259 (1.3)
23 890 (81.6) 3129 (10.7) 1099 (3.8) 115 (0.4) 674 (2.3) 387 (1.3)
.76
683 (3.7) 2091 (11.4) 4501 (24.5) 3954 (21.5) 3887 (21.1) 3293 (17.9)
1100 (4.0) 3203 (11.6) 6814 (24.7) 5868 (21.3) 5662 (20.5) 4948 (17.9)
.40
5072 (26.1) 6940 (35.7) 7442 (38.3)
7585 (26.0) 10 446 (35.8) 11 126 (38.2)
.94
14 064 (81.3) 3239 (18.7)
21 079 (81.2) 4887 (18.8)
.79
12 262 (62.8) 2711 (13.9) 4568 (23.4)
18 452 (63.0) 3933 (13.4) 6909 (23.6)
.36
14 196 (72.7) 2768 (14.2) 2576 (13.2)
21 299 (72.7) 4114 (14.0) 3881 (13.3)
.92
18 039 (93.4) 1273 (6.6)
27 009 (93.2) 1977 (6.8)
.33
10 315 (57.5) 7617 (42.5)
15 271 (56.8) 11 596 (43.2)
.15
15 231 (88.2) 2034 (11.8)
22 761 (87.9) 3138 (12.1)
.29
18 673 (95.6) 866 (4.4)
27 955 (95.4) 1336 (4.6)
363 (1.9) 205 (1.0) 241 (1.2)
548 (1.9) 328 (1.1) 321 (1.1)
⬎.99 .99
.50
.92 .46 .17
16 149 (82.7) 3391 (17.4)
23 980 (81.9) 5314 (18.1)
.03
679 (64.4) 393 (35.6)
1056 (64.0) 608 (36.0)
.94
Abbreviations: BP, blood pressure; CABG, coronary artery bypass graft; MI, myocardial infarction; PCI, percutaneous coronary intervention. *Calculated as weight in kilograms divided by the square of height in meters. †Defined retrospectively by Adult Treatment Panel III criteria and determined on a 5.8% subsample.
658 JAMA, February 8, 2006—Vol 295, No. 6 (Reprinted)
95% confidence intervals (CIs) from Cox proportional hazard analyses, stratified by age at screening, prevalent disease, and randomization status in the hormone trials. Assumptions of proportionality were met and tested by testing for a treatment by time-toevent interaction. Outcomes were also evaluated after exclusion of women with CVD at baseline (n=1656 [3.4%]). No time-dependent variables were included in the analyses. Changes in individual LDL-C levels in the 5.8% subsample were compared with those predicted using the equation of Mensink and Katan27: ⌬LDL-C=1.28(⌬sat) −0.24(⌬mono) −0.55(⌬poly) where sat indicates saturated fat; mono, monounsaturated fat; and poly, polyunsaturated fat. Secondary analyses compared event rates in the intervention and comparison groups in women stratified by baseline characteristics (eg, ethnicity, age, and body mass index [BMI]), as well as other health characteristics known to influence CVD. For the analysis of baseline percentage energy from fat, data from baseline 4-day food records of those women who developed CHD were also used as described previously.28 The possibility of important subgroup effects was explored by testing for interactions in expanded Cox models. Twenty-seven subgroups were tested; thus, at least 1 would be expected to be significant by chance alone at the .05 level of significance. Secondary analyses were also conducted, using Cox models, examining the relationship in the intervention group between CHD events after year 1 and quartiles of specific nutrient intakes at year 1 (ie, percentage energy from intakes of fat, vegetables and fruits, and grains). Other dietary components not specific to the intervention but believed to influence CVD were similarly assessed, including saturated fats, trans fatty acids, cholesterol, fiber, and the ratio of polyunsaturated to saturated fat. The analysis
©2006 American Medical Association. All rights reserved.
Downloaded from www.jama.com by xxxyyy, on November 24, 2006
LOW-FAT DIETARY PATTERN AND RISK OF CARDIOVASCULAR DISEASE
provided adjustment for energy intake, for known correlates of trial adherence, and for characteristics known to influence CVD risk; the CVD rate in the comparison group was used as the reference. All analyses were performed using SAS version 9.1 (SAS Institute Inc, Cary, NC). RESULTS Baseline Characteristics
The mean (SD) age of the 48 835 participants was 62.3 (6.9) years. Demographic characteristics, medical history, and behavioral characteristics of the study population have been described in detail16 and appear in TABLE 1 by intervention group. The cohort was ethnically diverse (18.6% minority) and in-
cluded a range of education and income levels; 3.4% reported a history of CVD. No significant differences were found between the randomization groups for any of the measures presented in Table 1 and TABLE 2, except for a 0.4-mm Hg difference in systolic blood pressure and a 0.7% difference in use of aspirin. The women in this trial reflect the characteristics of the general population of women of this age throughout the United States, except that they had somewhat higher obesity measures, income, and education and lower rates of smoking.16 Baseline levels of lipids and other biomarkers measured in a 5.8% sample were similar between the 2 groups, except that high-density lipoprotein cholesterol (HDL-C) level in the compari-
son group was 1.7 mg/dL (0.04 mmol/L) lower (Table 2). TABLE 3 presents overall baseline and follow-up nutrient data for both groups based on the FFQ. No meaningful changes were seen in any of the dietary factors in the comparison group. Compared with the comparison group, the intervention group reported significant changes in all dietary components, resulting in year 6 in an 8.2% lower mean total fat intake (P⬍.001) and a 2.9% lower mean saturated fat intake (P⬍.001), as well as reduced intakes of trans, monounsaturated, and polyunsaturated fat and cholesterol (but no change in ratio of polyunsaturated to saturated fat) and increased intakes of fiber, vegetables and fruits, total and whole grains, and soy.
Table 2. Differences Between the Mean Changes in Cardiovascular Disease Risk Factors From Baseline to Year 3 in the Intervention vs the Comparison Group Change at Year 3 Baseline, Mean (SD) Risk Factor Weight, kg Body mass index† Waist circumference, cm Physical activity, METs/wk Blood pressure, mm Hg Systolic Diastolic
Intervention
Comparison
76.8 (16.6) 29.1 (5.9) 89.0 (13.9) 10.0 (11.7)
76.7 (16.5) 29.1 (5.9) 89.0 (13.7) 10.1 (12.0)
127.5 (17.2) 75.9 (9.1)
127.9 (17.2) 76.0 (9.1)
Year 3, Mean (SD) Intervention Comparison Clinical Values 75.7 (17.1) 76.7 (16.8) 28.8 (6.0) 29.2 (5.9) 88.2 (13.9) 89.3 (14.1) 11.6 (13.0) 11.3 (12.8) 125.1 (16.9) 73.1 (9.4)
125.7 (16.8) 73.6 (9.3)
Intervention, Mean (SD)
Comparison, Mean (SD)
Difference, Mean (95% CI)
−0.7 (9.0) −0.2 (2.7) −0.4 (7.3) 1.4 (11.7)
0.6 (9.2) 0.3 (2.7) 0.5 (7.7) 1.0 (11.4)
−1.29 (−1.47 to −1.11)* −0.49 (−0.54 to −0.44)* −0.98 (−1.19 to −0.76)* 0.39 (0.16 to 0.63)*
−2.2 (16.3) −2.6 (9.4)
−2.1 (16.4) −2.3 (9.4)
−0.17 (−0.49 to 0.15) −0.31 (−0.50 to −0.13)*
Laboratory Values Cholesterol, mg/dL Total‡ LDL-C‡ HDL-C‡ Total cholesterol–HDL-C ratio‡ Non–HDL-C‡ Triglycerides, mg/dL‡ 㛳
224.0 (36.5) 133.3 (35.3) 60.1 (16.1) 4.0 (1.2) 163.9 (39.5) 138.6 (65.1)
224.2 (39.2) 134.2 (35.1) 58.4 (15.4) 4.1 (1.3) 165.8 (41.1) 141.1 (66.3)
214.1 (35.3) 123.2 (33.1) 59.7 (15.8) 3.8 (1.1) 154.3 (36.5) 142.3 (67.5)
216.6 (35.9) 127.0 (34.0) 58.2 (15.5) 4.0 (1.2) 158.4 (37.0) 144.6 (63.7)
−10.2 (32.0) −9.7 (29.3) −0.7 (9.4) −0.2 (0.8) −9.7 (32.0) 1.0 (0.4)
−6.9 (31.9) −6.2 (29.1) −0.3 (10.2) −0.1 (1.0) −6.6 (32.6) 1.0 (0.3)
−3.26 (−6.53 to −0.00)§ −3.55 (−6.58 to −0.52)§ −0.43 (−1.42 to 0.57) −0.04 (−0.13 to 0.5) −3.08 (−6.37 to 0.22) 0.00 (−0.03 to 0.04)
Lipoprotein(a), mg/dL‡ 㛳 Glucose, mg/dL‡
15.7 (17.5) 100.4 (26.6)
15.4 (17.0) 100.0 (26.9)
13.2 (15.1) 98.8 (25.6)
13.8 (15.5) 99.5 (27.3)
0.9 (0.5) −1.7 (19.9)
0.9 (0.5) −0.7 (21.6)
−0.01 (−0.07 to 0.05) −1.06 (−3.06 to 0.93)
9.9 (4.9) 2.4 (1.4) 0.7 (0.4)
10.2 (5.3) 2.5 (1.6) 0.7 (0.4)
10.5 (5.3) 2.5 (1.5) 0.7 (0.4)
11.2 (5.9) 2.7 (1.7) 0.6 (0.4)
1.1 (0.5) 1.1 (0.5) 0.0 (0.3)
1.1 (0.5) 1.1 (0.6) −0.0 (0.3)
−0.03 (−0.07 to 0.02) −0.04 (−0.09 to 0.01) 0.04 (0.01 to 0.07)§
131.0 (33.3) 301.5 (59.3)
129.1 (29.0) 298.7 (61.7)
130.0 (35.7) 288.0 (58.1)
131.6 (32.7) 290.2 (60.0)
Insulin, µIU/mL‡ 㛳 HOMA insulin resistance‡ 㛳 Total carotenoids, µg/mL‡ Factor VIIc, %‡ Fibrinogen, mg/dL‡
−1.9 (27.3) −11.1 (49.9)
2.4 (28.7) −10.2 (54.0)
−4.29 (−7.29 to −1.29)* −0.97 (−6.41 to 4.47)
Abbreviations: CI, confidence interval; HDL-C, high-density lipoprotein cholesterol; HOMA, homeostasis model assessment; LDL-C, low-density lipoprotein cholesterol; METs, metabolic equivalent tasks. SI conversion factors: To convert total cholesterol, LDL-C, and HDL-C to mmol/L, multiply values by 0.0259; triglycerides to mmol/L, by 0.0113; lipoprotein(a) to µmol/L, by 0.0357; glucose to mmol/L, by 0.0555; insulin to pmol/L, by 6.945; and fibrinogen to µmol/L, by 0.0294. *Difference significant at P⬍.001 from a 2-sample test. †Calculated as weight in kilograms divided by the square of height in meters. ‡Blood measures were performed on a 5.8% subsample at year 3. Means and SDs have been weighted by ethnicity using the ethnicity distribution of participants randomized to the entire clinical trial. Tests for differences between the randomization groups are performed on the weighted means and SDs. §Difference significant at P⬍.05 from a 2-sample test. 㛳Means shown are geometric means.
©2006 American Medical Association. All rights reserved.
(Reprinted) JAMA, February 8, 2006—Vol 295, No. 6
Downloaded from www.jama.com by xxxyyy, on November 24, 2006
659
LOW-FAT DIETARY PATTERN AND RISK OF CARDIOVASCULAR DISEASE Follow-up
At trial conclusion, 2404 women (4.9%) were deceased, 1553 (3.2%) had stopped follow-up, and 527 (1.1%) were lost to follow-up. Five percent (4.7%) of women in the intervention and 4.0% in the comparison group withdrew, were considered lost to follow-up, or had stopped providing outcomes information for longer than 18 months (Figure 1). Eleven percent (11.4%) of women had terminated the intervention, as defined by neither attending group sessions nor providing selfmonitoring information through phone or individual visits for 18 months. CVD Risk Factors
At year 3, women in the intervention group compared with those in the comparison group showed small but significant decreases in body weight,29 waist circumference,29 diastolic blood
pressure, LDL-C level (3.55 mg/dL [0.09 mmol/L]), and factor VIIc level (Table 2). The dietary intervention had no statistically significant effects on levels of triglycerides or HDL-C; ratio of total cholesterol to HDL-C; levels of non–HDL-C, lipoprotein(a), glucose, or insulin; or insulin resistance as estimated by homeostasis model assessment30; in the latter 3 factors, there were trends toward improvement. The observed absolute LDL-C change of 2.7 mg/dL (0.07 mmol/L) after 6 years was similar to the 2.3-mg/dL (0.06mmol/L) change predicted using current equations based on differences in fatty acid intakes.27 Carotenoid levels, a reflection of increased vegetable consumption, were significantly higher. CVD Outcomes
After a mean of 8.1 years of follow up, the observed incidence rate for major
CHD (MI/CHD death, 3.6 per 1000 person-years) in the comparison group was 30% lower than projected in the design. No significant effects of the dietary intervention were observed for major CHD (HR, 0.98; 95% CI, 0.881.09) or composite CHD (CHD/ revascularization; HR, 0.97; 95% CI, 0.90-1.06) vs the comparison group (TABLE 4). The incidences of total, fatal, or nonfatal stroke were not influenced by the dietary intervention (HR, 1.02; 95% CI, 0.90-1.15), nor was a composite measure of CVD (CHD/ revascularization/stroke; HR, 0.98; 95% CI, 0.92-1.05). The monitoring plan for the Dietary Modification Trial specified 2 primary outcomes (breast and colorectal cancer) and 2 secondary outcomes (major CHD and death from other causes). The 95% CI for major CHD, adjusted for these 4 outcomes using a Bonferroni correction,
Table 3. Baseline and Follow-up Nutrient Intakes* Year 1, Mean (SD)
Year 6, Mean (SD)
Baseline, Mean (SD) Intervention Total energy, kcal/d Daily intakes, % of energy Total fat Saturated fat Monounsaturated fat Polyunsaturated fat P/S fat ratio Total trans fatty acid Protein Carbohydrate
Comparison
Intervention
Comparison
Difference, Mean (95% CI)†
Intervention
Comparison
Difference, Mean (95% CI)†
1790.2 (710.1) 1789.4 (703.0) 1500.5 (544.2) 1593.8 (644.0) −93.4 (−104.8 to −81.9) 1431.8 (551.7) 1546.2 (639.5) −114.3 (−126.8 to −101.8)
37.8 (5.1) 12.7 (2.5) 14.4 (2.3)
37.8 (5.0) 12.7 (2.5) 14.4 (2.3)
24.3 (7.5) 8.1 (2.8) 8.9 (3.1)
35.1 (6.9) 11.8 (2.9) 13.3 (2.9)
−10.7 (10.9 to −10.6) −3.7 (−3.7 to −3.6) −4.4 (−4.5 to −4.4)
28.8 (8.4) 9.5 (3.2) 10.8 (3.5)
37.0 (7.3) 12.4 (3.1) 14.2 (3.1)
−8.2 (−8.3 to −8.0) −2.9 (−3.0 to −2.8) −3.3 (−3.4 to −3.3)
7.8 (2.0)
7.8 (2.0)
5.2 (1.8)
7.2 (2.1)
−2.0 (−2.0 to −2.0)
6.1 (2.1)
7.5 (2.1)
−1.5 (−1.5 to −1.4)
0.6 (0.2) 2.7 (1.1)
0.6 (0.2) 2.8 (1.1)
0.7 (0.2) 1.6 (0.8)
0.6 (0.2) 2.5 (1.1)
0.0 (0.0 to 0.0) −0.8 (−0.9 to −0.8)
0.7 (0.2) 1.8 (0.9)
0.6 (0.2) 2.4 (1.1)
0.0 (0.0 to 0.0) −0.6 (−0.6 to −0.6)
16.5 (3.0) 45.6 (6.3)
16.4 (3.0) 45.6 (6.2)
17.7 (3.1) 58.3 (8.9)
16.9 (3.2) 48.0 (8.0)
0.8 (0.8 to 0.9) 10.3 (10.2 to 10.5)
17.7 (3.4) 53.9 (9.9)
17.1 (3.3) 45.9 (8.8)
0.6 (0.5 to 0.6) 8.1 (7.9 to 8.3)
Dietary fiber, g/d
15.4 (6.4)
15.4 (6.4)
18.1 (7.5)
14.9 (6.5)
3.2 (3.0 to 3.3)
16.9 (7.5)
14.4 (6.4)
2.4 (2.3 to 2.6)
Soluble fiber, g/d
4.2 (1.7)
4.2 (1.8)
4.9 (2.0)
4.0 (1.8)
0.8 (0.8 to 0.9)
4.5 (2.0)
3.8 (1.7)
0.6 (0.6 to 0.7)
Dietary folate equivalent, µg/d
259.2 (136.6)
259.3 (138.1)
398.5 (215.0)
346.1 (195.1)
52.4 (48.6 to 56.2)
469.1 (205.9)
422.5 (189.0)
46.6 (42.5 to 50.6)
Cholesterol, mg/d
260.5 (139.0)
260.0 (135.6)
172.4 (99.3)
229.8 (128.7) −57.5 (−59.7 to −55.3)
193.6 (118.7)
243.5 (143.2)
−49.9 (−52.7 to −47.2)
Intakes, servings/d Vegetables and fruits Grains Whole grains
3.6 (1.8)
3.6 (1.8)
5.1 (2.3)
3.9 (2.0)
1.2 (1.2 to 1.2)
4.9 (2.4)
3.8 (2.0)
1.1 (1.1 to 1.2)
4.7 (2.5) 1.1 (0.8)
4.8 (2.5) 1.1 (0.8)
5.1 (2.7) 1.4 (0.9)
4.2 (2.3) 1.1 (0.7)
0.8 (0.8 to 0.9) 0.3 (0.3 to 0.3)
4.3 (2.4) 1.2 (0.9)
3.8 (2.2) 1.0 (0.7)
0.5 (0.4 to 0.5) 0.2 (0.2 to 0.2)
Intakes, servings/wk Soy‡ Nuts Fish
0.1 (0.7) 1.5 (2.3) 1.9 (1.8)
0.1 (0.7) 1.5 (2.3) 1.9 (1.7)
0.2 (0.8) 0.5 (1.1) 1.9 (1.7)
0.2 (0.7) 1.3 (1.9) 1.8 (1.7)
0.0 (0.0 to 0.0) −0.8 (−0.8 to −0.7) 0.1 (0.0 to 0.1)
0.3 (1.0) 1.0 (1.7) 2.0 (1.7)
0.2 (0.9) 1.8 (2.5) 2.0 (1.9)
0.0 (0.0 to 0.1) −0.8 (−0.9 to −0.8) 0.0 (−0.1 to 0.0)
Abbreviations: CI, confidence interval; P/S, ratio of polyunsaturated fat to saturated fat. *Nutrient intakes were available on 19 470 and 29 216 participants at baseline, and 18 058 and 26 743 at year 1 and 14 885 and 22 958 at year 6 in the intervention and comparison groups, respectively. Data on servings of types of food was available on 19 470 and 29 216 participants at baseline, 18 057 and 26 743 at year 1, and 14 774 and 22 713 at year 6 in the intervention and comparison groups respectively. †All differences significant at P⬍.001 from a 2-sample test except for soy at year 3 (P = .02), and fish at year 6 (P = .40). ‡No soy intake was reported by 87.0%, 84.9%, and 80.1% of participants at baseline, year 1, and year 6, respectively.
660 JAMA, February 8, 2006—Vol 295, No. 6 (Reprinted)
©2006 American Medical Association. All rights reserved.
Downloaded from www.jama.com by xxxyyy, on November 24, 2006
LOW-FAT DIETARY PATTERN AND RISK OF CARDIOVASCULAR DISEASE
was 0.86 to 1.12. After women with history of CVD at baseline were removed (n=1656 [3.4%]), HRs (95% CIs) for major CHD, composite CHD, stroke, and total CVD were 0.93 (0.83-1.05), 0.94 (0.86-1.02), 1.02 (0.90-1.17), and 0.96 (0.89-1.03), respectively. The HR for the 3.4% of women with CVD at baseline was 1.26 (95% CI, 1.031.54). We considered the potential confounding effects of changing medication use during the trial by examining use of statins, aspirin, and angiotensinconverting enzyme inhibitors at year 6. All differences in medication use between groups were less than 1%. In examining trends over time (FIGURE 2), there was no apparent influence of the dietary intervention on stroke at any point up to 9 years of follow-up. There appeared to be a slight, nonsignificant trend toward decreased CHD rates in the intervention group in the later years, and this was more pronounced for women with no CVD at baseline. Likewise, exploratory analyses of CHD outcomes in groups stratified by race/ethnicity, age, BMI, waist circumference, smoking, statin use, diabetes, randomization to the HT and CaD trials, and baseline fat
intake revealed no significant interactions between the intervention group and any of these variables (FIGURE 3), either in the group as a whole or if women with baseline CVD were excluded. A significant interaction was observed between the intervention effect and baseline disease (P =.006). Additional Analyses
When the effect of the intervention was assessed using adherence criteria based on participation in intervention activities,28 the HRs did not change. Trends for changes in specific components of the diet were examined by evaluating CHD risk in individuals stratified by quartiles of achieved levels of key nutrients at year 1, using the rate in the comparison group as the reference. Analyses were adjusted for age, baseline CHD, and HT randomization group; full models included CVD risk factors (age, BMI, hypertension, high cholesterol level, smoking, diabetes, physical activity, and energy expenditure) and correlates of adherence (ethnicity, education, income, and psychosocial factors). Compared with those in the entire comparison group, a trend was ob-
served toward reduction of CHD risk among those in the intervention group who reached the lowest levels of saturated fat (HR, 0.81; 95% CI, 0.69-0.96 in the group that consumed ⬍6.1% energy; P⬍.001 [adjusted HR, 0.82; 95% CI, 0.67-0.99; P = .05]) and trans fat (HR, 0.81; 95% CI, 0.69-0.95 in group consuming ⬍1.1% energy intake; P⬍.001 [adjusted HR, 0.84; 95% CI, 0.69-1.02; P = .10]) or the highest intakes of vegetables and fruits (HR, 0.88; 95% CI, 0.76-1.03 in the group that consumed ⱖ6.5 servings/d; P⬍.001 [adjusted HR, 0.89; 95% CI, 0.741.06; P =.11]). While these additional analyses are subject to residual confounding because of reporting bias or the lack of a comparable comparison group, some confidence in their validity is supported by parallel patterns of LDL-C reductions in participants stratified by changes in saturated fat at year 1 (−10.1; 95% CI, −13.5 to −6.6 mg/dL [0.26; 95% CI, −0.36 to −0.17 mmol/L] in the quartile with the greatest reduction; P=.005 for trend), and trans fat (−9.0; 95% CI, −12.5 to −5.6 mg/dL [0.23; 95% CI, −0.32 to −0.14 mmol/L] in the quartile with the greatest reduction; P =.03).
Table 4. Clinical Outcomes (Annualized Percentage) of the Dietary Modification Trial Participants by Randomization Assignment All Participants, No. (%)
Mean follow-up time, mo Major CHD (nonfatal MI or CHD death)†‡ Nonfatal MI CHD death CABG/PCI Composite CHD (nonfatal MI, CHD death, or CABG/PCI) Stroke Fatal§ Nonfatal Stroke class Ischemic Hemorrhagic Total cardiovascular disease||
Intervention (n = 19 541) 96.9 559 (0.35) 435 (0.28) 158 (0.10) 717 (0.45) 1000 (0.63)
Comparison (n = 29 294) 97.1 863 (0.36) 671 (0.28) 234 (0.10) 1113 (0.47) 1549 (0.65)
434 (0.28) 55 (0.03) 379 (0.24) 256 (0.16) 67 (0.04) 1357 (0.86)
Participants Without History of CVD, No. (%)
0.98 (0.88-1.09) 0.98 (0.87-1.11) 1.02 (0.84-1.25) 0.96 (0.88-1.06) 0.97 (0.90-1.06)
Intervention (n = 18 633) 97.2 452 (0.30) 353 (0.23) 124 (0.08) 569 (0.38) 806 (0.53)
Comparison (n = 27 925) 97.4 733 (0.32) 581 (0.26) 185 (0.08) 935 (0.41) 1292 (0.57)
0.93 (0.83-1.05) 0.91 (0.80-1.04) 1.01 (0.81-1.27) 0.91 (0.82-1.01) 0.94 (0.86-1.02)
642 (0.27) 86 (0.04) 556 (0.23)
1.02 (0.90-1.15) 0.97 (0.69-1.36) 1.03 (0.90-1.17)
384 (0.25) 46 (0.03) 338 (0.22)
564 (0.25) 73 (0.03) 491 (0.22)
1.02 (0.90-1.17) 0.94 (0.65-1.35) 1.04 (0.90-1.19)
383 (0.16) 113 (0.05) 2088 (0.88)
1.01 (0.86-1.18) 0.90 (0.66-1.22) 0.98 (0.92-1.05)
228 (0.15) 62 (0.04) 1132 (0.75)
334 (0.15) 106 (0.05) 1777 (0.78)
1.03 (0.87-1.22) 0.88 (0.64-1.20) 0.96 (0.89-1.03)
HR (95% CI)*
HR (95% CI)*
Abbreviations: CABG, coronary artery bypass graft; CHD, coronary heart disease; CI, confidence interval; HR, hazard ratio; MI, myocardial infarction; PCI, percutaneous coronary intervention. *From an unweighted proportional hazards model stratified by prevalent condition, age, and hormone therapy randomization group. †MI includes clinical MI and silent MI. Fifty-five and 47 MIs were identified only by serial electrocardiography among all participants and those without history of CVD, respectively. ‡Nonfatal MI is defined as no definite CHD death within 28 days of MI. §Fatal stroke is defined as death within 30 days of stroke, or source of outcome is cause of death only. ||Total cardiovascular disease includes clinical MI, silent MI, death due to CHD, CABG/PCI, and stroke.
©2006 American Medical Association. All rights reserved.
(Reprinted) JAMA, February 8, 2006—Vol 295, No. 6
Downloaded from www.jama.com by xxxyyy, on November 24, 2006
661
LOW-FAT DIETARY PATTERN AND RISK OF CARDIOVASCULAR DISEASE
COMMENT The WHI Dietary Modification Trial is the largest long-term randomized trial of a dietary intervention ever conducted to our knowledge, and it achieved an 8.2% reduction at year 6 in total fat intake and a mean daily increase of 1.1 servings of vegetables and fruits and 0.5 serving of grains. No sig-
nificant effects on incidence of CHD or stroke were observed during 8.1 years of follow-up. Analysis of subcomponents of CVD, including MI, coronary interventions, and stroke separately showed no beneficial or adverse effects of the dietary changes. Although power was limited for subgroup analyses, stratification by ethnicity, age, BMI,
or the presence of baseline CVD risk factors did not reveal any subgroup in which there were significant effects. An interaction with prior CVD was observed; women without baseline CVD had an HR close to significant, but the absolute reduction was only 7%. The intervention was associated with increased risk in the 3.4% of women with
Figure 2. Kaplan-Meier Estimates of Cumulative Hazards for CHD (MI, CHD Death, or Revascularization) and Stroke All Participants 0.06
MI, CHD Death, or Revascularization
Stroke Comparison Intervention
Cumulative Hazard
0.05
0.04 HR, 1.02 (95% CI, 0.90-1.15)
HR, 0.97 (95% CI, 0.90-1.06) 0.03
0.02
0.01
0 0
1
2
3
4
5
6
7
8
9
0
1
2
3
4
Time, y Events Intervention Comparison No. at Risk Intervention Comparison
87 129
86 162
106 161
121 184
123 188
5
6
7
8
9
60 82
57 88
44 70
28 40
Time, y 140 213
136 206
95 161
71 91
19 541 19 299 19 063 18 776 18 477 18 189 17 811 15 429 10 156 5014 28 294 28 868 28 484 28 121 27 712 27 251 26 813 23 173 15 283 7523
29 54
54 54
48 72
52 82
47 70
19 541 19 348 18 132 18 900 18 662 18 438 18 122 15 744 10 397 5159 29 294 28 936 28 657 28 376 28 057 27 704 27 376 23 734 15 665 7743
Participants Without a History of CVD 0.06
MI, CHD Death, or Revascularization
Stroke
Cumulative Hazard
0.05
0.04 HR, 0.94 (95% CI, 0.86-1.02)
HR, 1.02 (95% CI, 0.90-1.17)
0.03
0.02
0.01
0 0
1
2
3
4
5
6
7
8
9
0
1
2
3
Time, y Events Intervention Comparison No. at Risk Intervention Comparison
59 95
64 125
78 135
102 154
95 151
4
5
6
7
8
9
52 74
53 75
41 62
27 36
Time, y 117 188
114 178
85 142
61 75
18 633 18 435 18 231 17 981 17 720 17 469 17 131 14 094 9844 4878 27 925 27 552 27 223 26 898 26 528 26 130 25 731 22 307 14 767 7294
24 48
47 48
40 60
46 69
40 62
18 633 18 463 18 266 18 053 17 841 17 637 17 352 15 131 10 027 4989 27 925 28 598 27 343 26 086 26 796 26 484 26 186 22 765 15 090 7479
CHD indicates coronary heart disease; CI, confidence interval; HR, hazard ratio; MI, myocardial infarction. 662 JAMA, February 8, 2006—Vol 295, No. 6 (Reprinted)
©2006 American Medical Association. All rights reserved.
Downloaded from www.jama.com by xxxyyy, on November 24, 2006
LOW-FAT DIETARY PATTERN AND RISK OF CARDIOVASCULAR DISEASE
Figure 3. Risk of Composite Coronary Heart Disease (CHD) in Various Subgroups No. of Cases of CHD (Annualized %) Intervention
Comparison
P Value for Interaction
Race or Ethnic Group White Black Hispanic American Indian/Alaskan Native Asian or Pacific Islander Unknown/Other
838 (0.65) 119 (0.70) 20 (0.35) 1 (0.14) 8 (0.24) 14 (0.72)
1330 (0.68) 150 (0.60) 30 (0.35) 7 (0.78) 15 (0.28) 17 (0.56)
.11
Age Group at Screening, y 50-59 60-69 70-79
171 (0.28) 521 (0.72) 308 (1.23)
287 (0.31) 763 (0.71) 499 (1.32)
.58
Body Mass Index <25 25-<30 ≥30
183 (0.44) 359 (0.64) 456 (0.77)
284 (0.46) 556 (0.65) 706 (0.80)
.07
Family History of Premature MI No Yes
582 (0.52) 270 (1.06)
918 (0.54) 419 (1.10)
.77
Waist Circumference, cm ≤78.9 79.0-87.5 87.6-97.9 ≥98.0
141 (0.36) 216 (0.52) 272 (0.71) 371 (0.95)
242 (0.41) 326 (0.54) 442 (0.75) 537 (0.92)
.19
Cigarette Smoking Never/past Current
885 (0.61) 99 (0.98)
1377 (0.63) 144 (0.91)
.77
Physical Activity, METS per Week ≤2.6 2.7-11.2 ≥11.3
352 (0.77) 276 (0.61) 248 (0.53)
524 (0.77) 436 (0.64) 412 (0.59)
.37
Hypertension (Treated or BP >140/90 mm Hg) No Yes
296 (0.36) 624 (1.04)
514 (0.42) 915 (1.00)
.03
Statin Use No Yes
862 (0.58) 138 (1.49)
1344 (0.60) 205 (1.45)
.81
Treated for Diabetes (Pills or Injections) No Yes
834 (0.55) 166 (2.50)
1302 (0.57) 247 (2.44)
.71
Baseline % Energy From Fat∗ <33.84 33.84-<36.87 36.87-<40.80 ≥40.80
255 (0.63) 230 (0.59) 243 (0.63) 269 (0.68)
345 (0.59) 380 (0.64) 393 (0.66) 425 (0.73)
.67
Baseline Energy From Saturated Fat, % <10.9 10.9-<12.4 12.4-<14.1 ≥14.1
243 (0.61) 247 (0.63) 264 (0.67) 243 (0.62)
395 (0.67) 379 (0.63) 390 (0.66) 379 (0.65)
.96
Randomized to Hormone Therapy Trial Active Placebo
94 (0.73) 89 (0.70)
146 (0.72) 150 (0.79)
.40
Randomized to CaD Trial Active Placebo
238 (0.61) 232 (0.58)
377 (0.58) 364 (0.57)
.50
History of CVD (MI, CABG/PCI, or Stroke) No
806 (0.53)
1292 (0.57)
.006
Favors Intervention
0.1
Favors Comparison
1.0
10
HR (95% CI)
Body mass index was calculated as weight in kilograms divided by the square of height in meters. BP indicates blood pressure; CABG, coronary artery bypass graft; CaD, calcium and vitamin D; CI, confidence interval; CVD, cardiovascular disease; HR, hazard ratio; HT, hormone therapy; METs, metabolic equivalent tasks; MI, myocardial infarction; PCI, percutaneous coronary intervention. *Conclusions do not change if results from 4-day food records are used.
©2006 American Medical Association. All rights reserved.
(Reprinted) JAMA, February 8, 2006—Vol 295, No. 6
Downloaded from www.jama.com by xxxyyy, on November 24, 2006
663
LOW-FAT DIETARY PATTERN AND RISK OF CARDIOVASCULAR DISEASE
baseline CVD; this may be a chance observation, or rates in this small subset may be confounded by concurrent therapy or comorbid conditions. The primary focus of the WHI Dietary Modification Trial intervention was on lowering rates of breast and colorectal cancer, not those of CVD, by targeting total dietary fat reduction.28,31 Women in the intervention group achieved intakes of saturated fat and cholesterol that were less than 10% of energy intake and less than 300 mg/d, respectively. However, intakes of polyunsaturated fat, vegetables and fruits, and fiber were lower than now recommended,32-34 and there was no focus on consumption of fish. However, while the WHI Dietary Modification Trial intervention was not specifically designed to lower rates of CVD, at least 3 findings relevant to CVD are worth noting. First, contrary to previous suggestions about adverse effects of increasing carbohydrate intake on CVD risk factors,35,36 no long-term adverse effects were observed on lipid profiles or levels of glucose or insulin. There were no significant increases in triglycerides levels or decreases in HDL-C levels, and trends for glucose and insulin levels and for estimated insulin resistance all were slightly favorable. Body weight, waist circumference, and diastolic blood pressure were significantly lower, as were levels of factor VIIc. Because there are no apparent changes that would have mitigated a potentially favorable effect on CVD, the lack of an appreciable CVD effect may be attributable to the limited decrease (only 2.7 mg/dL [0.07 mmol/L]) in LDL-C level, as well as the modest differences in other potentially favorable dietary components. Based on a large body of evidence from LDL-C– lowering trials,13,14 this magnitude of change in LDL-C level would be predicted to produce only a small (2%4%) decrease in CVD risk, a value far below the power for detection in the current study. As delivered, the dietary intervention was not expected to have substantial effects on lipoprotein
levels, but it is possible that a diet specifically lower in saturated and trans fat combined with increased intakes of vegetables, fruits, and grains might have led to a decrease in CVD risk. The trial is not a test of the dietary guidelines currently recommended for prevention of CVD32-34 that specify a plant-based, high-fiber diet rich in vegetables, fruits, whole grains, nuts, beans, low-fat dairy products, and fish and replacement of saturated and trans fat with monounsaturated and polyunsaturated fat and plant sterols. Second, there is value in the comparison of these results to the limited existing clinical trial results. Six previous randomized dietary trials, conducted many years ago, examined the effect of dietary fat on rates of CVD with at least 2 years of follow-up.7-9,37-39 In 4 of these trials,7-9,39 individuals started with diets extremely high in saturated fat; saturated fat intake was decreased by approximately 10% of energy intake, resulting in a 12% to 15% decrease in blood levels of total cholesterol and a significant reduction in CHD. In 2 other studies in which total cholesterol levels were reduced by only 3% to 4%, no reduction was seen in CHD.37,38 These previous studies further support the implication that the lack of effect on CVD in the current study was attributable to the small decrease in saturated fat and reduced intakes of monounsaturated and polyunsaturated fat that yielded the subsequent minimal change in LDL-C levels. These data further imply that, because the current mean saturated fat intake in the United States is now approximately 11% kcal vs 18% to 20% in the 1970s,40 very aggressive and targeted dietary intervention would be required to achieve substantial LDL-C lowering through dietary approaches. This might be difficult to attain within the context of the general societal framework of food processing and availability. Third, this study provides the opportunity for subgroup analyses. These results show no effect of this diet on stroke, but a possible trend toward benefit with regard to CHD
664 JAMA, February 8, 2006—Vol 295, No. 6 (Reprinted)
was observed. The large diverse cohort and long duration provide the unique opportunity to evaluate the effects of different levels of dietary adherence and to examine whether specific qualitative and quantitative changes in the diet affected CVD outcomes. Stratification by attainment of lowest levels of saturated or trans fat or highest intakes of vegetables and fruits showed positive trends, with women who achieved the more optimal levels showing lower LDL-C levels and rates of CHD. Several previous observational studies have indicated that intakes of specific fatty acids are more strongly related to CHD risk than is total fat intake. 1,2,6 Collectively, these analyses, despite their inherent limitations, suggest that a diet lower in saturated and trans fat intake and higher in intakes of vegetables and fruits and polyunsaturated fat than what was achieved in this trial might show significant benefit in preventing CHD. Strengths of this study include its randomized design, long-term follow-up, large sample size, ethnic and socioeconomic diversity, and high retention rate. Limitations include the lack of targeting key nutrients relevant to CVD and the focus on women aged between 50 and 79 years; the possibility that the effect might have been greater in men or if the diet had been initiated at younger ages cannot be ruled out. Why trends toward protective effects for CHD events were observed only in women without baseline disease also needs further consideration. Limitations associated with the FFQ methodology include bias caused by self-report41 and the need to recall food intake throughout a 3-month period; also, our validation study suggested that baseline percentage of energy from fat may have been overestimated by 2% to 3%.42 In conclusion, this long-term dietary intervention in postmenopausal women, intended to reduce fat intake and increase intake of vegetables, fruits, and grains, achieved an 8.2% of energy decrease in total fat intake but only a 2.9% of energy
©2006 American Medical Association. All rights reserved.
Downloaded from www.jama.com by xxxyyy, on November 24, 2006
LOW-FAT DIETARY PATTERN AND RISK OF CARDIOVASCULAR DISEASE
decrease in saturated fat intake and only modest increases in intakes of vegetables, fruits, and grains. The intervention did not reduce risk of CHD or stroke. To achieve a significant public health impact on CVD events, a greater magnitude of change in multiple macronutrients and micronutrients and other behaviors that influence CVD risk factors may be necessary. Author Affiliations: MedStar Research Institute/ Howard University, Washington, DC (Dr Howard); Northwestern University, Chicago/Evanston, Ill (Drs Horn and Greenland); George Washington University, Washington, DC (Dr Hsia); Brigham and Women’s Hospital, Harvard Medical School, Boston, Mass (Dr Manson); Stanford Prevention Research Center, Stanford, Calif (Dr Stefanick); Albert Einstein College of Medicine, Bronx, NY (Dr Wassertheil-Smoller); University of Pittsburgh, Pittsburgh, Pa (Dr Kuller); Fred Hutchinson Cancer Research Center, Seattle, Wash (Drs LaCroix, Prentice, Tinker, Anderson, and Beresford); University of California at San Diego (Dr Langer); University of Medicine and Dentistry of New Jersey, Newark (Dr Lasser); University of Alabama at Birmingham (Dr Lewis); University of Florida, Gainesville (Drs Limacher and Perri); University of Minnesota, Minneapolis (Dr Margolis); The Ohio State University, Columbus (Dr Mysiw); University of Massachusetts/ Fallon Clinic, Worcester (Dr Ockene); University of Miami, Miami, Fla (Dr Parker); Emory University, Atlanta, Ga (Dr Phillips); University of California at Davis (Dr Robbins); National Heart, Lung, and Blood Institute, Bethesda, Md (Dr Rossouw); University of Wisconsin, Madison (Dr Sarto); University of Hawaii, Honolulu (Dr Schatz); University of Iowa, Iowa City/ Davenport (Dr Snetselaar); Kaiser Permanente Center for Health Research, Portland, Ore (Dr Stevens); University at Buffalo, Buffalo, NY (Dr Trevisan); Wake Forest University School of Medicine, Winston-Salem, NC (Dr Vitolins); Brown University, Providence, RI (Dr Assaf ); University of Arizona, Tucson/Phoenix (Dr Bassford); Rush University Medical Center, Chicago (Dr Black); University of Nevada, Reno (Dr Brunner); University of Texas Health Science Center, San Antonio (Dr Brzyski); Kaiser Permanente Division of Research, Oakland, Calif (Dr Caan); Harbor-UCLA Research and Education Institute, Torrance, Calif (Dr Chlebowski); University of Cincinnati, Cincinnati, Ohio (Dr Gass); State University of New York at Stony Brook (Dr Granek); Baylor College of Medicine, Houston, Tex (Dr Hays); University of California at Los Angeles (Dr Heber); University of North Carolina, Chapel Hill (Dr Heiss); Wayne State University School of Medicine/ Hutzel Hospital, Detroit, Mich (Dr Hendrix); University of California at Irvine (Dr Hubbell); University of Tennessee Health Science Center, Memphis (Dr Johnson); and Medical College of Wisconsin, Milwaukee (Dr Kotchen).Dr Assaf is now affiliated with Pfizer Inc, Cambridge, Mass. Author Contributions: Dr Howard had full access to all of the data in the study and takes responsibility for the integrity of the data and the accuracy of the data analysis. Study concept and design: Van Horn, Manson, Stefanick, Lewis, Margolis, Prentice, Robbins, Rossouw, Snetselaar, Stevens, Tinker, Trevisan, Anderson, Bassford, Black, Greenland, Hays. Acquisition of data: Howard, Van Horn, Hsia, Manson, Stefanick, Wassertheil-Smoller, LaCroix, Langer, Lasser, Lewis, Limacher, Margolis, Mysiw, Ockene, Parker, Perri, Phillips, Prentice, Robbins, Sarto, Schatz,
Snetselaar, Stevens, Tinker, Trevisan, Assaf, Bassford, Beresford, Black, Brunner, Brzyski, Caan, Chlebowski, Gass, Granek, Greenland, Hays, Heber, Heiss, Hendrix, Hubbell, Johnson, Kotchen. Analysis and interpretation of data: Howard, Van Horn, Hsia, Manson, Stefanick, Wassertheil-Smoller, Kuller, LaCroix, Lewis, Limacher, Mysiw, Perri, Prentice, Rossouw, Snetselaar, Tinker, Trevisan, Vitolins, Anderson, Black, Chlebowski, Greenland. Drafting of the manuscript: Howard, Van Horn, Stefanick, Rossouw, Trevisan, Vitolins. Critical revision of the manuscript for important intellectual content: Howard, Van Horn, Hsia, Manson, Stefanick, Wassertheil-Smoller, Kuller, LaCroix, Langer, Lasser, Lewis, Limacher, Margolis, Mysiw, Ockene, Parker, Perri, Phillips, Prentice, Robbins, Rossouw, Sarto, Schatz, Snetselaar, Stevens, Tinker, Trevisan, Anderson, Assaf, Bassford, Beresford, Black, Brunner, Brzyski, Caan, Chlebowski, Gass, Granek, Greenland, Hays, Heber, Heiss, Hendrix, Hubbell, Johnson, Kotchen. Statistical analysis: Van Horn, Kuller, LaCroix, Prentice. Obtained funding: Howard, Van Horn, Manson, Stefanick, Wassertheil-Smoller, Langer, Lewis, Ockene, Prentice, Robbins, Rossouw, Snetselaar, Stevens, Trevisan, Assaf, Beresford, Black, Brunner, Greenland, Heiss, Hendrix, Hubbell. Administrative, technical, or material support: Van Horn, Hsia, Manson, Stefanick, LaCroix, Langer, Lasser, Lewis, Limacher, Margolis, Mysiw, Ockene, Perri, Phillips, Prentice, Robbins, Rossouw, Snetselaar, Stevens, Trevisan, Anderson, Assaf, Bassford, Black, Brunner, Brzyski, Granek, Hays, Heber, Heiss, Hendrix, Hubbell, Johnson, Kotchen. Study supervision: Howard, Van Horn, Manson, Stefanick, Wassertheil-Smoller, LaCroix, Limacher, Ockene, Parker, Perri, Prentice, Robbins, Stevens, Trevisan, Anderson, Assaf, Beresford, Black, Brunner, Caan, Chlebowski, Hays, Heiss, Hendrix, Johnson. Critical input to representation of the intervention program: Tinker. Financial Disclosures: Dr Howard has served on the advisory boards of Merck, Shering Plough, the Egg Nutrition Council, and General Mills, and has received research support from Merck and Pfizer. Dr Assaf is an employee of Pfizer. Dr Black has received research grants from Pfizer and AstraZeneca, was on the speaker’s bureaus for Pfizer, Novartis, Sanofi-Aventis, BristolMyers Squibb, Searle, Pharmacia, and Boehringer, and served as a consultant or on an advisory board for Myogen, Merck Sharp and Dohme, Novartis, MylanBertek, Pfizer, Bristol-Myers Squibb, and SanofiAventis. No other disclosures were reported. Funding/Support: Funding was provided by the National Heart, Lung, and Blood Institute, US Department of Health and Human Services. While the WHI hormone therapy and calcium-vitamin D trials received study medications from pharmaceutical companies, the diet trial received no outside nonfederal support. Role of the Sponsor: The National Heart, Lung, and Blood Institute has representation on the WHI Steering Committee, which governed the design and conduct of the study, the interpretation of the data, and preparation and approval of manuscripts. The National Heart, Lung, and Blood Institute Project Office reviewed the manuscript. Independent Statistical Analyses: All statistical analyses for the study were performed by statisticians at the Fred Hutchinson Cancer Research Center, Division of Public Health Sciences, under the direction of the principal investigator of the Coordinating Center, Dr Prentice. WHI Investigators: For a complete list of the WHI investigators, see the companion article in this issue, “Dietary Pattern and Risk of Invasive Breast Cancer: the Women’s Health Initiative Randomized Controlled Dietary Modification Trial” ( JAMA. 2006;296:629642).
©2006 American Medical Association. All rights reserved.
Acknowledgment: We thank Mary Pettinger, Fred Hutchinson Cancer Research Center, for data analysis and Rachel Schaperow, MedStar Research Institute, for editorial assistance.
REFERENCES 1. Keys A. From Naples to seven countries—a sentimental journey. Prog Biochem Pharmacol. 1983;19:130. 2. Oh K, Hu FB, Manson JE, Stampfer MJ, Willett WC. Dietary fat intake and risk of coronary heart disease in women: 20 years of follow-up of the Nurses’ Health Study. Am J Epidemiol. 2005;161:672-679. 3. Liu S, Stampfer MJ, Hu FB, et al. Whole grain consumption and risk of coronary heart disease: results from the Nurses’ Health Study. Am J Clin Nutr. 1999; 70:412-419. 4. Liu S, Manson JE, Lee I-M, et al. Fruit and vegetable intake and risk of cardiovascular disease: the Women’s Health Study. Am J Clin Nutr. 2000;72:922928. 5. Fung TT, Stampfer MJ, Manson JE, Rexrode KM, Willett WC, Hu FB. Prospective study of major dietary patterns and stroke risk in women. Stroke. 2004; 35:2014-2019. 6. Kris-Etherton PM, Harris WS, Appel LJ; American Heart Association Nutrition Committee. Fish consumption, fish oil, omega-3 fatty acids, and cardiovascular disease [published correction appears in Circulation. 2003;107:512]. Circulation. 2002;21:27472757. 7. Dayton S, Pearce ML, Hashimoto S, Cixon WJ, Tomlyasu U. A controlled trial of a diet high in unsaturated fat for preventing complications of atherosclerosis. Circulation. 1969;60(suppl 2):111-163. 8. Leren P. The Oslo Diet-Heart Study: eleven year report. Circulation. 1970;42:935-942. 9. Turpeinen O, Karvonen MJ, Pekkarinen M, Miettinen M, Elosuo R, Paavilainen E. Dietary prevention of coronary heart disease: the Finnish Mental Hospital Study. Int J Epidemiol. 1979;8:99-118. 10. de Lorgeril M, Salen P, Martin JL, Monjaud I, Delaye J, Mamelle N. Mediterranean diet, traditional risk factors and the rate of cardiovascular complications after myocardial infarction: final report of the Lyon Diet Heart Study. Circulation. 1999;99:779-785. 11. de Lorgeril M, Renaud S, Mamelle N, et al. Mediterranean alpha-linolenic acid-rich diet in secondary prevention of coronary heart disease [published correction appears in Lancet. 1995;345:738]. Lancet. 1994;343:1454-1459. 12. Ornish D, Scherwitz LW, Billings JH, et al. Intensive lifestyle changes for reversal of coronary heart disease. JAMA. 1998;280:2001-2007. 13. Baigent C, Keech A, Kearney PM, et al; Cholesterol Treatment Trialists’(CTT) Collaborators. Efficacy and safety of cholesterol-lowering treatment: prospective meta-analysis of data from 90,056 participants in 14 randomised trials of statins. Lancet. 2005;366: 1267-1278. 14. Hebert PR, Gaziano JM, Chan KS, Hennekens CH. Cholesterol lowering with statin drugs, risk of stroke, and total mortality: an overview of randomized trials. JAMA. 1997;278:313-321. 15. Women’s Health Initiative Study Group. Design of the Women’s Health Initiative clinical trial and observational study. Control Clin Trials. 1998;19:61-109. 16. Ritenbaugh C, Patterson R, Chlebowski RT, et al. The Women’s Health Initiative Dietary Modification Trial: overview and baseline characteristics of participants. Ann Epidemiol. 2003;13:S87-S97. 17. Patterson RE, Kristal A, Rodabough R, et al. Changes in food sources of dietary fat in response to an intensive low-fat dietary intervention: early results from the Women’s Health Initiative. J Am Diet Assoc. 2003;103:454-460. 18. Tinker LF, Burrows ER, Henry H, Patterson R,
(Reprinted) JAMA, February 8, 2006—Vol 295, No. 6
Downloaded from www.jama.com by xxxyyy, on November 24, 2006
665
LOW-FAT DIETARY PATTERN AND RISK OF CARDIOVASCULAR DISEASE Rupp L, Van Horn L. The Women’s Health Initiative: overview of the nutrition components. In: Krummel D, Kris-Etherton P, eds. Nutrition in Women’s Health. Gaithersburg, Md: ASPEN Publishers; 1996:510-542. 19. Bowen D, Ehret C, Pedersen M, et al. Results of an adjunct dietary intervention program in the Women’s Health Initiative. J Am Diet Assoc. 2002;102:1631-1637. 20. US Department of Agriculture. Dietary Guidelines for Americans. 3rd ed. Washington, DC: US Dept of Health and Human Services; 1990. 21. Stefanick ML, Cochrane BB, Hsia J, Barad DH, Liu JH, Johnson SR. The Women’s Health Initiative postmenopausal hormone trials: overview and baseline characteristics of participants. Ann Epidemiol. 2003; 13(9 suppl):S78-S86. 22. Jackson RD, LaCroix AZ, Cauley JA, McGowan J. The Women’s Health Initiative calcium-vitamin D trial: overview and baseline characteristics of participants. Ann Epidemiol. 2003;13(9 suppl):S98-S106. 23. Patterson RE, Kristal AR, Tinker LF, Carter RA, Bolton MP, Argus-Collins T. Measurement characteristics of the Women’s Health Initiative food frequency questionnaire. Ann Epidemiol. 1999;9:178-187. 24. Writing Group for the Women’s Health Initiative Investigators. Risks and benefits of estrogen plus progestin in healthy postmenopausal women: principal results from the Women’s Health Initiative randomized controlled trial. JAMA. 2002;288:321-333. 25. Manson JE, Hsia J, Johnson KC, et al; Women’s Health Initiative Investigators. Estrogen plus progestin and risk of CHD. N Engl J Med. 2003;349:523-534. 26. Curb JD, McTiernan A, Heckbert SR, et al. Outcomes ascertainment and adjudication methods in the
Women’s Health Initiative. Ann Epidemiol. 2003;13: S122-S128. 27. Mensink RP, Katan MB. Effect of dietary fatty acids on serum lipids and lipoproteins: a metaanalysis of 27 trials. Arterioscler Thromb. 1992;12:911918. 28. Prentice RL, Caan B, Chlebowski R, et al. Lowfat dietary pattern and risk of invasive breast cancer: the Women’s Health Initiative randomized controlled dietary modification trial. JAMA. 2006;295: 629-642. 29. Howard BV, Manson JE, Stefanick ML, et al. Lowfat dietary pattern and weight change over 7 years: the Women’s Health Initiative Dietary Modification Trial. JAMA. 2006;295:39-49. 30. Matthews DR, Hosker JP, Rudenski AS, et al. Homeostasis model assessment: insulin resistance and b-cell function from fasting plasma glucose and insulin concentrations in man. Diabetologia. 1985;28: 412-419. 31. Beresford SAA, Johnson KC, Rittenbaugh C, et al. Low-fat dietary pattern and risk of colorectal cancer: the Women’s Health Initiative randomized controlled dietary modification trial. JAMA. 2006;295:643654. 32. Krauss RM, Eckel RH, Howard B, et al. AHA Dietary Guidelines, Revision 2000: a statement for healthcare professionals from the nutrition committee of the American Heart Association. Circulation. 2000;102: 2284-2299. 33. Franz MJ, Bantle JP, Beebe CA, Brunzeu JD, Chasson JL. Evidence-based nutrition principles and recommendations for the treatment and prevention of diabetes and related complications. Diabetes Care. 2002;25:148-198.
34. Expert Panel on Detection, Evaluation, and Treatment of High Blood Cholesterol in Adults. Executive Summary of the Third Report of the National Cholesterol Education Program (NCEP) Expert Panel on Detection, Evaluation, and Treatment of High Blood Cholesterol in Adults (Adult Treatment Panel III). JAMA. 2001;285:2486-2497. 35. Pereira MA, Liu S. Types of carbohydrates and risk of cardiovascular disease. J Womens Health (Larchmt). 2003;12:115-122. 36. Hellerstein MK. Carbohydrate-induced hypertriglyceridemia: modifying factors and implications for cardiovascular risk. Curr Opin Lipidol. 2002;13:33-40. 37. Low-fat diet in myocardial infarction: a controlled trial. Lancet. 1965;2:501-504. 38. Controlled trial of soya-bean oil in myocardial infarction. Lancet. 1968;2:693-700. 39. Watts GF, Lewis B, Brunt JNH, et al. Effects on coronary artery disease of lipid-lowering diet, or diet plus cholestyramine, in the St. Thomas’ Atherosclerosis Regression Study (STARS). Lancet. 1992;339:563569. 40. Chanmugam P, Guthrie JF, Cecilio S, Morton JF, Basiotis P, Anand R. Did fat intake in the United States really decline between 1989-1991 and 1994-1996? J Am Diet Assoc. 2003;103:867-872. 41. Subar AF, Kipnis V, Troiano RP, et al. Using intake of biomarkers to evaluate the extent of dietary misreporting in a large sample of adults: the OPEN Study. Am J Epidemiol. 2003;158:113. 42. Wang C-Y, Anderson GL, Prentice RL. Estimation of the correlation between nutrient intake measures under restricted sampling. Biometrics. 1999;55: 711-717.
I may as well tell you, here and now, that if you are going about the place thinking things pretty, you will never make a modern poet. Be poignant, man, be poignant! —P. G. Wodehouse (1881-1975)
666 JAMA, February 8, 2006—Vol 295, No. 6 (Reprinted)
©2006 American Medical Association. All rights reserved.
Downloaded from www.jama.com by xxxyyy, on November 24, 2006