Local candidates and distributive politics under closed-list proportional representation∗ Jon H. Fiva†, Askill H. Halse‡,§ and Daniel M. Smith¶ April 2, 2018
Abstract Geographic representation is an important consideration in candidate nominations, even under closed-list proportional representation (PR), and may even matter for distributive policy outcomes. However, since nominations are determined strategically, the causal effects of representation for local areas are difficult to identify. We investigate the relationship between local representation and both voter behavior and redistributive policies in the closed-list PR setting of Norway (1953-2013). Exploiting as-good-as-random election outcomes for candidates who are marginally close to winning a seat in parliament, we find that parties obtain higher support in subsequent elections in the hometowns of narrowly-elected candidates. This effect appears to be driven by an increase in the probability of having the local candidate at the top of the party list in the next election. However, we find no effect of local representation on geographically targeted policy benefits for the candidates’ hometowns. Our results suggest that local candidates under closed-list PR are able to attract and mobilize local voters, but either do not have the power to obtain distributive benefits for their localities, or are not interested in seeking them.
∗
We are grateful to Patricia Funk, Bjørn Høyland, Jo Thori Lind, Janne Tukiainen, and seminar participants at the 2017 AEA Meeting, Free University of Bozen-Bolzano, Norwegian Business School, Norwegian University of Science and Technology, Statistics Norway, and University of Oslo for helpful comments and suggestions. We would also like to thank the Directorate of Public Roads and Norwegian Centre for Research Data for providing some of the data used in the analysis. These institutions are not responsible for the analysis or the interpretation of the results. This paper is part of the research activities at the center of Equality, Social Organization, and Performance (ESOP) at the Department of Economics at the University of Oslo. † BI Norwegian Business School. E-mail:
[email protected]. ‡ University of Oslo, E-mail:
[email protected]. § Institute of Transport Economics (TØI), Oslo. ¶ Harvard University, E-mail:
[email protected].
1
1
Introduction
Parties seeking to win elections must take into account how voters will evaluate the observable characteristics of the candidates they nominate. One important characteristic is the geographic background or local ties of candidates (Latner and McGann, 2005; Shugart, Valdini and Suominen, 2005; Put, Maddens and Verleden, 2015; Saarimaa and Tukiainen, 2016). Multiple studies across various contexts have found a positive correlation between a candidate’s local ties (through birth or residence) and electoral support in a district or subregion within a district (e.g., Key, 1949; Nemoto and Shugart, 2013; Fiva and Smith, 2017a; Panagopoulos, Leighley and Hamel, 2017). Indeed, voters may value candidates with local ties even if those candidates do not come from their preferred political parties (e.g., Blais et al., 2003; Arzheimer and Evans, 2012; Campbell and Cowley, 2014; Horiuchi, Smith and Yamamoto, 2018). Part of the reason behind voters’ preference for locals may be an expectation that the local candidate will do a better job serving the community’s interests or delivering public goods (e.g., Carozzi and Repetto, 2016; Fiva and Halse, 2016). However, the strategic nature of candidate selection decisions within parties makes it difficult to determine whether there is any causal effect of local representation on party support. Moreover, it is often unclear whether voters actually derive any tangible distributive policy benefits as a direct effect of having a local candidate elected to parliament, particularly in multimember, closed-list proportional representation (PR) settings. Most of the existing studies on local ties and voter support concern electoral systems where votes are cast for an individual candidate, either in single-member district (SMD) systems (e.g., Lewis-Beck and Rice, 1983; Rice and Macht, 1987; Meredith, 2013; Arzheimer and Evans, 2014), or multimember systems that allow for intraparty preference voting, like the single-transferable vote (STV) system and open-list PR (e.g., Tavits, 2010; G´orecki and Marsh, 2012, 2014; Jankowski, 2016). Here, we consider the effect of local representation in the relatively unexplored setting
2
of closed-list PR.1 Because votes are cast for parties, rather than candidates, closed-list PR should theoretically decrease the salience of the personal characteristics of individual candidates (Shugart, 2001; Shugart, Valdini and Suominen, 2005). In addition, personalvote-seeking behavior through the provision of public goods is assumed to be less prevalent under PR systems, where voters tend to evaluate parties based on programmatic platforms, and there are several legislators representing each electoral district, making it more difficult to attribute individual credit for providing such benefits (Carey and Shugart, 1995).2 What then might be the relationship, if any, between local representation and voter behavior or distributive policies in closed-list PR settings? We investigate whether and how local representation matters in the closed-list PR setting of Norway. Our empirical analysis is based on an original data set of all candidates in Norwegian parliamentary elections from 1953-2013, biographical information on the candidates’ home municipalities within the larger districts, and vote returns measured at the municipality-level in these elections. We first investigate how local representation affects turnout, party support, and candidate nominations in the next election. We then examine the effect of local representation on distributive policy decisions. The Norwegian government has a tradition of promoting distributive policies to support settlement and economic activity in all parts of the country, which makes it an ideal case for studying the effects of geographic representation on distributive politics. To study the impact of local representation on distributive politics, we use three different policy outcomes: (1) national road constructions, (2) central government jobs (some of which are located in 1
Fiva and Halse (2016) find evidence of local favoritism in public spending within election districts in the closed-list PR context of Norwegian regional governments, where the entire region is one electoral district. A few additional studies document the distribution of local candidates on party lists in closed-list settings, without evaluating the effect of those candidates on electoral behavior or distributive politics (e.g., Shugart, Valdini and Suominen, 2005; Latner and McGann, 2005; Esp´ırito-Santo and Sanches, 2018). 2 There is some evidence supporting the claim that PR systems result in lower levels of geographically targeted distributive policies relative to widely dispersed programmatic policies. However, this evidence is based either on aggregate spending data, and so requires assumptions about the relative costs of distributive policies (Milesi-Ferretti et al., 2002; Persson and Tabellini, 2003; Funk and Gathmann, 2013), or it is based on politicians’ observed legislative behavior (i.e., bill submissions or committee membership), without directly measuring the final policy outcomes (e.g., Stratmann and Baur, 2002; Pekkanen, Krauss and Nyblade, 2006; Gagliarducci, Nannicini and Naticchionia, 2011).
3
the periphery), and (3) investment funding from the central government. The mechanics of the Norwegian electoral system provide opportunities to plausibly identify causal effects of political representation under weak assumptions. We identify two quasi-experimental events which result in a municipality gaining representation in parliament: (1) a local candidate narrowly wins a district (“first-tier”) seat in a close election; (2) a local candidate wins a national (“second-tier”) adjustment seat. We exploit both these events using a regression discontinuity (RD) framework. The first event captures the part of the seat allocation outcome in closed-list PR systems that can be considered as good as random when parties’ vote shares are sufficiently close to allocation thresholds (Folke, 2014; Fiva and Smith, 2018). The second event captures the fact that it is almost impossible to predict ex ante which candidates will be awarded national adjustment seats, which are allocated based on parties’ “excess votes” after first-tier seats have been allocated. Our results show that parties enjoy higher support in the next election in the hometowns of narrowly elected candidates. We find no evidence that overall turnout increases, suggesting that the presence of a local incumbent serves to mobilize the erstwhile supporters of other parties, rather than to mobilize previous abstainers. We also find that when a local candidate wins a seat by a narrow margin, the top candidate of the same party is more likely to come from the same locality in the next election. Considering larger geographic units, we find no evidence that the party enjoys a local advantage beyond the hometown of the candidate. It appears as though voters in other municipalities close to the hometown would prefer having their own local top candidate, something which becomes less likely when the candidate wins and runs again. We find no evidence that the hometown of a narrowly elected candidate benefits in terms of distributive policies. For all three policy outcomes in our data, the effects are either close to zero or negative. This indicates that legislators elected in this electoral setting either do not have the power to obtain benefits to their hometown, or are not interested in doing so. It also suggests that the link between voters and local repre4
sentation, at least in the closed-list PR setting of Norway, probably does not relate to expectations among voters for distributive gains from politicians with local ties.
2
Case Setting
Our interest is in whether geographic representation matters for voter participation and distributive policy outcomes within election districts. In this section, we describe the Norwegian electoral system and the candidate nomination procedures within parties, and illustrate how the main parties balance their tickets geographically.
The electoral system Proportional representation for electing members of parliament (MPs) to the Norwegian Storting was introduced in 1921. Originally, the seat allocation was determined through the D’Hondt method; however, from the 1953 election onwards, seats have been allocated by the Modified Sainte-Lagu¨e method, which is more favorable to small parties. The 1953 electoral reform also abolished a previous distinction between urban and rural electoral districts, such that districts since 1953 correspond to the borders of Norway’s 19 regions (fylker ).3 District magnitude ranges from 4 to 16 seats, with an average of about 9 seats. A two-tier system was introduced in 1989. In the first tier, seats are allocated proportionally to parties within each of the 19 districts based on party vote shares in the district. In the second tier, adjustment seats are given to parties that are under-represented at the national level once the first-tier seats have been allocated, provided that those parties reach an electoral threshold of 4 percent of the national vote. From 1989 to 2001, there were eight second-tier seats, which could be allocated to any district. Since 2005, there is one second-tier seat per district (hence 19 adjustment seats in total). Party lists are closed—each party puts forward a rank-ordered list of candidates in each of the districts, and votes are cast for the party list as a whole.4 3 4
Bergen was a separate district until 1973. Voters may cross names off of the list when they cast their ballots, but the rank order will only be
5
The party system has been relatively stable (Strøm and Leipart, 1993; Narud and Strøm, 2011). The main party cleavage runs between the left-leaning social democratic camp, consisting of the Labor Party (DNA) and the Socialist Peoples’ Party/Socialist Left Party (SV; founded in 1961), and the right-leaning conservative camp, consisting of the Center Party (SP; formerly the Farmer’s Party), the Christian Peoples’ Party (KrF), the Liberal Party (V), the Conservative Party (H), and the Progress Party (FrP; founded in 1973). A few other parties have succeeded in winning seats in some elections.5 Partisan identification among voters was remarkably and consistently high, at roughly 70 percent, until the 1980s, when it began to decline to around 50 percent today (Bengtsson et al., 2013, p. 71).
Candidate nominations and geographic balance Candidate nominations and rank positions are determined within each district by duespaying party delegates at nominating conventions (Valen, Narud and Skare, 2002). This implies that the local party organization is responsible for determining the composition of each list with respect to geography, age, gender, and other background characteristics. Candidates are almost always residents of the districts where they run; however, in a few cases parties have allowed candidates to run in a district other than their home district in order to increase those candidates’ chances of election. In some cases, this is done strategically in order to increase the electoral chances of members of the party elite.6 Our main measure of geographic affiliation is the home municipality of the candidate. In the vast majority of cases, this is reported on the election ballot.7 On average, changed if at least half of all of the party’s voters make exactly the same change. In practice this has never happened, so the system is effectively closed-list. 5 The left-right cleavage has shifted somewhat in recent elections, after the Center Party joined the center-left coalition in 2005. 6 In 1989, Erik Solheim, leader of the Socialist Left Party, was elected from Sør-Trøndelag instead of his home district, Oslo. In 2005, Dagfinn Høybr˚ aten, leader of the Christian Democratic Party, was elected from Rogaland instead of his home district, Akershus. In 2005, Progress Party MP and later deputy party leader Per Sandberg switched from Nord-Trøndelag to Sør-Trøndelag district. 7 In a few cases, we have used home municipality reported in the previous or next election, or in elections at the regional level. Candidates who report a hometown outside the election district are not included. The exception is candidates who apparently change hometown when going into national politics. If a candidate changes hometown status to the capital, Oslo, or a neighboring municipality (and
6
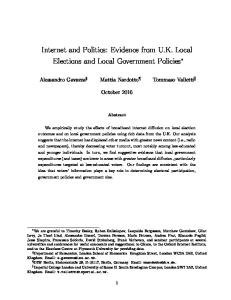
each electoral district consists of about 25 municipalities, but these vary dramatically in population size (the median municipality has about 4,000 inhabitants, while the average municipality has about 10,000 inhabitants). To illustrate the extent to which parties geographically balance their ticket, we calculate two measures: (i) the “effective” number of municipalities represented in the district based on population shares,8 and (ii) the “effective” number of municipalities based on municipalities’ share of candidates in the top ten ranked positions on the party lists. Figure 1 plots the relationship between these two indices for the four largest parties. If parties did not geographically balance their tickets, we should see binned scatter points that line up around the dashed line at y = x (i.e., municipalities are, on average, represented on the ticket in proportion to their share of the population in the election district). This is not the case. In electoral districts that have a strong concentration in municipal population size, such as the three leftmost binned scatter points in Figure 1, tickets tend to be less geographically concentrated.9 This particularly applies to the Center Party, where the effective number of municipalities represented by candidates in the top ten positions of the party list is about nine, independent of the concentration in population size across municipalities of the electoral district.
3
Data
Our data set covers all candidates on all party lists for Storting elections from 1906-2013 (Fiva and Smith, 2017b). This data set also includes information on those candidates’ gender, occupation, and hometown (municipality within election district). Because the data set includes background information on all candidates running for office, not just winners, it is well suited for analyzing the consequences of political representation. runs in another election district), we use the candidate’s original hometown. 8 This index accounts for both the number of municipalities and their relative size and is calculated 1 by EN oM = Pn P opShare 2 , where P opSharei is the share of the population of municipality m. i=1 i 9 The three leftmost districts in each subpanel of Figure 1 are Hordaland Sør-Trøndelag, and VestAgder, which all are dominated by large cities (Bergen, Trondheim, and Kristiansand).
7
Figure 1: Geographic balancing for the four largest parties
Top 5 candidates on ballot
0
5 10 15 20 Effective number of hometowns in district
Effective number of hometowns with a candidate 0 2 4 6 8 10
Effective number of hometowns with a candidate 0 2 4 6 8 10
Labor Party
25
Top 10 candidates on ballot
0
5 10 15 20 Effective number of hometowns in district
25
Top 5 candidates on ballot
0
5 10 15 20 Effective number of hometowns in district
Effective number of hometowns with a candidate 0 2 4 6 8 10
Effective number of hometowns with a candidate 0 2 4 6 8 10
Center Party
25
Top 10 candidates on ballot
0
5 10 15 20 Effective number of hometowns in district
25
Top 5 candidates on ballot
0
5 10 15 20 Effective number of hometowns in district
Effective number of hometowns with a candidate 0 2 4 6 8 10
Effective number of hometowns with a candidate 0 2 4 6 8 10
Christian Democratic Party
25
Top 10 candidates on ballot
0
5 10 15 20 Effective number of hometowns in district
25
Top 5 candidates on ballot
0
5 10 15 20 Effective number of hometowns in district
Effective number of hometowns with a candidate 0 2 4 6 8 10
Effective number of hometowns with a candidate 0 2 4 6 8 10
Conservative Party
25
Top 10 candidates on ballot
0
5 10 15 20 Effective number of hometowns in district
25
Note: The figure plots, for each of the four largest parties, the effective number of municipalities based on candidate shares in the top ten positions of the list against the effective number of municipalities based on population shares. In each panel, each electoral district is represented by one binned scatterpoint. Hordaland, pre- and post-1973, is treated as two different districts. At the dashed line at y = x, municipalities are, on average, represented on the ticket in proportion to their population share in the election district.
8
Our empirical analysis builds on the framework of Fiva and Smith (2018). While their RD analysis is applied to the 1953-1981 period, before adjustment seats are introduced, we use data for the entire 1953-2013 period.10 Like Fiva and Smith (2018), we start by identifying candidates, for each of the seven main parties, who are either next in line to win a seat, or first in line to lose a seat.11 We then use party vote counts at the district level to measure how far individual candidates are from winning (losing) a seat using the distance measure proposed by Folke (2014). In short, this measure generates a win margin for each candidate, which is defined as the minimum total vote change across all parties, scaled by the total number of votes cast, that would be required for candidate i in party j to experience a seat change.12 To investigate the impact of local representation on voter behavior, we supplement the candidate-level observations with municipality-level vote returns.13 As mentioned in the introduction, we rely on three different policy outcomes, all measured at the municipality-level, to study the impact of local representation on distributive politics: (1) constructions on nationals roads, (2) central government jobs, and (3) investment funding from the central government.
Constructions on national roads Due to its large geographical area and relatively scattered settlement pattern, Norway has a wide and diverse network of public roads—overall totaling 94,000 kilometers. The network consists of national, regional, and local roads. The national government is responsible for the national roads, which amounted to 28,000 kilometers before 2010, or 10 Fiva and Smith (2018) end their analysis in 1981 primarily because they need a sufficiently large period after candidates have run in order for family members to potentially appear in the data. 11 We also include the Norwegian Communist Party in the 1953 and 1957 elections, and the New People’s Party in the 1973 and 1977 elections. 12 Appendix Figure A.1 gives the frequency of observations for the subsample of marginal candidates, defined as those within 5 percentage points from winning a first-tier seat. There is no evidence of any sorting around the threshold for a seat change, lending support to the key identifying assumption of the RD design. Appendix Figure A.2 shows that pre-treatment municipality-level characteristics, e.g., population size, are balanced around the threshold for a seat change. Fiva and Smith (2018) show similar balance checks for candidate-level characteristics. 13 These data are missing for two districts, Telemark and Nord-Trøndelag, in the 1981 elections, when votes had to be recounted due to error.
9
roughly five meters per capita.14 In 2010, a large share of this network was transferred to the regional road network. Public funding of investments in national roads is allocated in the national budget, which is approved by parliament at the end of each calendar year. The time at which a road project is first proposed and discussed in parliament varies across projects. Since 1970, the government is required to prepare a long-term plan of road projects to be discussed in parliament. In 2002, this plan was replaced by a national transport plan covering all modes of transport. The national plan is not a binding legal document, but rather simply a document of policy intentions. Before receiving funding, a road project has typically been included at least once in the national plan. Parliament is involved earlier in the decision-making process in the case of public toll roads, which must be approved by a vote in parliament. The share of national road investments financed by toll revenues has increased from 5 percent in 1982 to 45 percent in 2010 (Lauridsen, 2011). To identify the local effect of national road policies, we use detailed data on constructions on national roads.15 More specifically, our data set includes information on all bridges built on national roads over the 1953-2013 period, and is collected from the BRUTUS database of the National Public Roads Administration (Statens vegvesen, 2014).16 The database is used for planning and conducting inspections of bridges, and includes the location and physical characteristics of each bridge. Given the topology of Norway, with its many fjords and mountains, bridges are a major component of infrastructure investments. In 2001, for example, there were more than 17,000 bridges across Norway, with an estimated value of approximately EUR 6 billion (Stensvold and Rønnestad, 2001). Data on the investment costs of road projects is not available at the municipality level. 14
Road investments made by one level of government are sometimes co-financed by other levels of government. 15 An alternative would be to use map data to identify expansions of the road network. This is less relevant for the period we study, in which the network was more or less already established. 16 We only include constructions on national roads, although the central government sometimes grants support to projects on the sub-national level. There are also some cases in the database where the bridge is part of a national road, but listed as part of the local or regional road which it crosses. Data on other types of constructions (e.g., tunnels) is incomplete and is therefore not used in our analysis. Seven municipalities have no national roads, and are excluded from our analysis.
10
Helland and Sørensen (2009) analyze aggregate road investments at the election district level. In Figure 2, we compare their data on investments with our data on constructions at the district level, both cross-sectionally (left-hand panel) and over time within each district (right-hand panel). The relationship is positive and close to proportional, indicating that bridge constructions are a reasonable proxy for local road investments. Figure 2: Bridges on national roads and total road investments in the election district Total (1964-2000)
Each year
25000
800
600 Constructions (m)
Constructions (m)
20000
15000
10000
400
200
5000
0
0 0
10000 20000 30000 Investments (million NOK)
0
200 400 600 Investments (million NOK)
800
Note: The vertical axis reports the total meters of new or rebuilt bridges on national roads within the election district. The horizontal axis reports national road investments in the district. The left-hand panel compares total constructions and investments over all years 1964-2000. Each marker (x) in this panel represents one district. The right-hand panel compares constructions and investments per year, controlling for district fixed effects. Each marker (dot) in this panel is a binned scatterpoint containing roughly the same number of observations. The linear regression line is based on the underlying data, not the binned scatterpoints.
Central government jobs The core government ministries and many of the central government agencies are located in the capital, Oslo. However, other central government agencies are located, or have local offices, in other parts of the country. In some cases, the location of a central government agency in a peripheral region is intended to ameliorate lower economic activity in the local private sector due to, for example, structural changes in specific industries. A prominent example is the National Library of Norway, which established a division in the 11
northern steel industry city of Mo i Rana in 1989 that today accounts for about half of the library’s employees.17 Mo i Rana, with a population of about 18,000, is also home to the fee-collecting office of the public broadcaster NRK, and the central government agency that collects fines and debts to the central government (Statens Innkrevingssentral).18 Information on the localization of central government jobs is attached to the national budget documents, and is provided by the Norwegian Centre for Research Data (NSD). The data cover all years from 1974 to 2012, which allows us to measure the growth in central government employment during ten of the election periods in our sample.19
Investment funding from the central government Finally, we explore the impact of local representation on fiscal transfers from the central government. The financing of the local governments is highly centralized, and more than 80% of the revenues are generated from central government grants and regulated income taxes. The grants are distributed as block grants and are primarily based on objective criteria, partly as tax equalization and partly as spending equalization. We focus on a type of grant where the central government has quite a bit of discretion: funding for local public investments. Based on all local government accounting sheets for each year from 1973-2013, we calculate investment funding per capita during each four-year election period starting with 1974-1977 and ending with 2010-2013. In sum, all three measures capture distributive policies which are likely to matter for local welfare in an area. Table 1 gives descriptive statistics on these measures. We see 17
Mo i Rana was home to the Norsk Jernverk public steel company until 1988, when it was divided and privatized. 18 Another example is Statistics Norway, which employs over a third of its workers in the city of Kongsvinger, 93 kilometers away from the main office in Oslo. In 2015, Kongsvinger hosted 334 of 877 total employees of Statistics Norway. Kongsvinger also has a population of about 18,000. 19 Up until 1996, government positions were registered in October. From 1998 onwards, they have been registered in March. Due to data availability issues, our first period of analysis runs from October 1974 to October 1977; the 1993-1997 period runs from October 1993 to March 1998; the 1997-2001 period runs from March 1998 to March 2001; and the last period runs from March 2009 to March 2012. The left-hand panel of Figure A.3 shows that most municipalities have at least one central government position per 100 inhabitants, and some have many more. The right-hand panel shows that the change during an election period is small in most municipalities, but that there are some municipalities that have experienced large decreases or increases. The distribution is highly symmetric.
12
that road constructions have a very skewed distribution. In most municipalities, there are no new constructions during an election period, but a few have some constructions which are large relative to the population. Investment funding is also skewed, but not as dramatically as road constructions. Table 1: Descriptive statistics, policy outcomes Median 90th pctile. 99th pctile. N Road constructions (meter/100 inhab.) 0.00 1.71 13.30 5992 Government jobs (change/100 inhab.) 0.00 0.52 2.17 4375 Investment funding (NOK 2015/inhab.) 1696.9 5482.2 13939.7 4227 Note: The variables are road constructions on national roads, central government jobs, and investment funding from the central to the local government, measured at the municipality level. Road constructions are measured based on the municipality structure of 2014.
4
Impact on electoral politics
To assess the importance of within-district variation in political representation, we first investigate whether party support and voter turnout is higher in the hometown of elected representatives. We construct a variable of local electoral support, LocalSupport, for party p in municipality m in election district d at time t defined as
LocalSupport pdtm = VoteShare pdtm − VoteShare pdt,−m
(1)
A positive value for LocalSupport thus indicates that the party receives above districtaverage vote share support, i.e., the municipality is a “party stronghold” in the district. We are interested in how the change in LocalSupport from one election to the next, ∆LocalSupport pmd,t+4 , depends on whether municipality m has a local candidate who is elected to parliament at time t.20 Even though parties assemble their tickets strategically, 20
Norwegian elections take place every four years. Because the distributive politics analyses rely on yearly observations, we here use t + 4 to denote variables referring to the next election.
13
anticipating the reactions of voters, they cannot control exactly which candidates ultimately get elected. We identify the effect of local representation using quasi-experimental variation stemming from the electoral rules. More specifically, we use two exogenous sources of variation: (1) candidates who win first-tier seats in close races and (2) candidates who win second-tier seats.21 Without (2), our approach would constitute a standard regression discontinuity (RD) design. Taking second-tier seats into account as well, our model is:
∆LocalSupport pmd,t+4 = αp + θt + δd + β(Win1st pmdt + Win2nd pmdt ) + λ1 WinMargin pmdt + λ2 WinMargin pmdt · Win1st pmdt + εpmd,t+4 (2)
where Win1st pmdt and Win2nd pmdt are dummy variables for whether the candidate wins a first-tier and second-tier seat, respectively. WinMargin pmdt measures how far the local candidate is from winning a first-tier seat, using Folke’s (2014) distance measure which Fiva and Smith (2018) adapt to the case of Norway. In our baseline results, we limit the sample to candidates who are at most 5 percentage points away from winning or losing a first-tier seat. In later robustness checks, we verify that the results hold for other choices of bandwidths around the seat threshold. Figure 3 shows how local electoral support changes when crossing the threshold for winning a first-tier seat, without taking second-tier seats into account. The upper lefthand panel shows that the effect in the current election is close to zero, indicating that there is no selection around the threshold with respect to local support. The upper middle panel, however, shows that parties appear to do better in the next election in municipalities where a local candidate from those parties narrowly wins election. When taking the first-difference in local support, we gain precision, as reflected by the smaller confidence intervals in the top-right panel of Figure 3. These estimates indicate that local party support increases by slightly above one percentage point at the cutoff. This may 21
We do not take into account that a losing candidate might serve as a deputy MP if an MP from the same party and election district is promoted to cabinet or resigns.
14
Figure 3: RD plots showing the effect of local representation in parliament on party support and turnout Local support
-.05 -.03 -.01 .01 .03 .05 Win margin
Next vs. current election Vote share (hometown vs. rest) -.03 -.02 -.01 0 .01 .02 .03
Next election Vote share (hometown vs. rest) 0 .01 .02 .03 .04 .05 .06
Vote share (hometown vs. rest) 0 .01 .02 .03 .04 .05 .06
Current election
-.05 -.03 -.01 .01 .03 .05 Win margin
-.05 -.03 -.01 .01 .03 .05 Win margin
Voter turnout
-.05 -.03 -.01 .01 .03 .05 Win margin
Next vs. current election Turnout (hometown vs. rest) -.02 -.01 0 .01 .02
Next election Turnout (hometown vs. rest) -.02 -.01 0 .01 .02
Turnout (hometown vs. rest) -.02 -.01 0 .01 .02
Current election
-.05 -.03 -.01 .01 .03 .05 Win margin
-.05 -.03 -.01 .01 .03 .05 Win margin
Note: The vertical axis in the top (bottom) left panel shows the party’s vote share (turnout) in the municipality minus its vote share (turnout) at the electoral district level in the current national election. The vertical axis in the right panels shows the changes in the corresponding variable from the current to the next election. The horizontal axis shows the margin by which the candidate wins a first-tier seat in the current national election. The dependent variable is voter turnout in the municipality minus turnout at the district level. The sample is limited to marginal candidates, defined as those within 5 percentage points from winning a first-tier seat (N=1469). Losing candidates who win second-tier seats are excluded. In the lower panels, the sample is limited to municipalities with exactly one marginal candidate (N=951). Each bin represents an interval of half a percentage point. Separate linear regression lines are estimated to the left and right of the discontinuity using the underlying data, not the binned scatterpoints.
15
signify that voters reward parties with local MPs, or alternatively, that local incumbents are better able to mobilize voters than local newcomers. There is, however, no indication that overall voter turnout is affected by having a local MP (see the bottom panels of Figure 3). This suggests that the presence of a local incumbent serves to mobilize the erstwhile supporters of other parties, rather than to mobilize previous abstainers. Panel A of Table 2 shows the results from the estimation of equation (2), which also takes into account that, since 1989, marginal candidates can also win a seat through the second-tier. As in the graphical evidence, column (1) shows that winning a marginal first-tier or second-tier seat increases local party support by about a percentage point. This corresponds to about a third of a standard deviation increase in the dependent variable. When combining first-tier and second-tier seats (column 2), we find that local party support increases by about 1.1 percentage points when a local candidate from that party wins a seat in parliament. This effect is statistically significant and robust to the inclusion of various fixed effects (columns 3-6) or to using a triangular kernel (column 7). In Appendix Figure A.4, we show that the results also hold for other choices of bandwidths around the electoral threshold. Panel B of Table 2 shows the corresponding results when using local turnout (relative to turnout at the district level) as the outcome variable. There are no indications that turnout is affected positively or negatively.
Mechanisms In an earlier study using the same data set, Fiva and Smith (2018) document a strong incumbency advantage for Norwegian MPs. Once a candidate is elected, he or she appears to get renominated to list positions that are high enough (lower numerically) to secure a seat again in the next election. While Fiva and Smith (2018) emphasize outcomes at the candidate level, we investigate below how winning a seat affects nomination outcomes at the municipality level. In particular, we look at the probability of having a local top candidate. We have already seen that local party support is higher for marginal candidates at both 16
Table 2: The effects of local representation in parliament on party support and turnout
1st tier seat
Panel A: Change in local party support (1) (2) (3) (4) 0.011*** (0.003)
2nd tier seat
(6)
(7)
0.011*** (0.003)
1st or 2nd tier seat Mean of outcome var. SD of outcome var. R-squared Observations
1st tier seat
(5)
-0.009 0.034 0.02 1244
0.011*** 0.011*** 0.012*** 0.011*** 0.012*** 0.008*** (0.002) (0.002) (0.002) (0.002) (0.002) (0.003) -0.009 -0.009 -0.009 -0.009 -0.009 -0.008 0.034 0.034 0.034 0.034 0.034 0.033 0.02 0.03 0.05 0.10 0.10 0.02 1244 1244 1244 1244 1244 1244
Panel B: Change in local voter turnout (1) (2) (3) (4) -0.000 (0.003)
2nd tier seat
(6)
(7)
0.006** (0.002)
1st or 2nd tier seat Mean of outcome var. SD of outcome var. R-squared Observations Time fixed effects Party fixed effects District fixed effects Rank fixed effects Kernel
(5)
-0.001 0.019 0.01 602 No No No No Unif.
0.001 (0.003) -0.001 0.019 0.01 602 No No No No Unif.
0.001 (0.003) -0.001 0.019 0.03 602 Yes No No No Unif.
0.000 (0.003) -0.001 0.019 0.04 602 Yes Yes No No Unif.
-0.000 (0.003) -0.001 0.019 0.08 602 Yes Yes Yes No Unif.
-0.000 (0.003) -0.001 0.019 0.09 602 Yes Yes Yes Yes Unif.
0.001 (0.003) -0.001 0.018 0.01 602 No No No No Tria.
Note: In panel A, the dependent variable is the party’s vote share in the municipality minus its vote share at the district level. In panel B, the dependent variable is turnout in the municipality minus turnout at the district level. The sample is limited to marginal candidates, defined as those within 5 percentage point distance from winning a first-tier seat. In Panel B, the sample is limited to municipalities with exactly one marginal candidate and no safe candidates. All specifications include a linear control function on both sides of the electoral threshold and dummies for the periods 1989-2001 and 20052009, during which two different systems for allocating second-tier seats are in place. Standard errors and corresponding significance stars are based on a cluster-robust covariance matrix, with clustering on the district level. * p < 0.10,** p < 0.05, *** p < 0.01.
17
sides of the cut-off for a first-tier seat (top-left panel of Figure 3). This may either indicate that parties nominate candidates from municipalities that are ex ante party strongholds, or that support increases when the party has a local candidate with a chance of winning a seat. Interestingly, Figure 3 (top-right panel) shows that local party support tends to fall in hometowns with a candidate just barely missing out on a seat, in comparison to hometowns with candidates just barely winning a seat. The top-left panel of Figure 4 shows that in about half of the cases, having a local marginal candidate implies having a local top candidate. The top-right panel shows that, even if the local candidate wins, the probability of having a top-ranked local candidate is slightly lower in the next election. However, if a local candidate loses, the probability falls much more. This suggests that renomination of local candidates at the top of the ballot is an important driver of voter mobilization and local party support, and that this contributes to the pattern documented in Figure 3.22 The lower panels of Figure 4 show no effects on the probabilities of a local candidate being ranked second.
5
Impact on distributive politics
One possible explanation for why voters support parties with a local first-ranked candidate is that they expect this candidate to be able to secure pork for the hometown (or, retrospectively, reward parties with local politicians who bring distributive benefits to the local area). Geographical representation is found to be important for the distribution of “pork” in countries using plurality rule (e.g., Ferejohn, 1974; Mayhew, 1974; Ansolabehere, Gerber and Snyder, 2002; Knight, 2008). It is not obvious that the porkbarrel logic applies similarly to closed-list PR settings where voters cast their ballots for parties, rather than individual politicians. In this section, we investigate this possibility using our three measures of distributive policy outcomes. 22
The top-left panel of Figure 4 indicates that candidates who (marginally) win seats are more likely to be top candidates also in the current election. This is somewhat puzzling. However, Appendix Table A.1, column (6), which includes rank-fixed effects, shows that this imbalance is not driving the effect in the next election.
18
Figure 4: RD plots showing the effect of local representation in parliament on nominations for the next election Local candidate ranked first
.8 .6 .4 .2 0
0
.2
.4
.6
.8
1
Next election
1
Current election
-.05
-.03
-.01 .01 Win margin
.03
.05
-.05
-.03
-.01 .01 Win margin
.03
.05
.03
.05
Local candidate ranked second
.8 .6 .4 .2 0
0
.2
.4
.6
.8
1
Next election
1
Current election
-.05
-.03
-.01 .01 Win margin
.03
.05
-.05
-.03
-.01 .01 Win margin
Note: The vertical axis indicates the probability that the candidate, or any other candidate from the same party and municipality, is ranked in the position indicated in the panel heading. The horizontal axis shows the margin by which the candidate wins a first-tier seat in the current national election. The sample is limited to marginal candidates, defined as those within 5 percentage points from winning a first-tier seat. Losing candidates who win second-tier seats are excluded. Each bin represents an interval of half a percentage point. Separate linear regression lines are estimated to the left and right of the discontinuity using the underlying data (N=1,396), not the binned scatterpoints.
19
A challenge with the outcome variables that we have available is that there is likely to be a time lag between the stage at which the MP influences the decision-making process and the observed outcome. We therefore analyze the effect of representation in parliament on policy outcomes both during the current and the next election period. In the case of road constructions, we add another two-year lag to account for the fact that the data are based on the opening year of the construction, not the year when construction starts. Figure 5 shows how winning a first-tier seat affects each of the three policy outcomes, based on a five percentage point bandwidth around the electoral threshold. There is no evidence of a positive effect on any of these policies during the current election period, nor is there an effect in the next period. As seen in the left panels, there is also no evidence that the sample is unbalanced in terms of policy outcomes during the previous period. Appendix Table A.2 confirms the findings from the graphical analysis and documents that we have quite precisely estimated zeros.23 Our results suggest that marginally elected MPs do not influence policies in a direction which benefits their hometowns during the eight years following their election. We cannot rule out that there could be some MPs who are more influential, or that it takes an even longer time in parliament before the effect of representation materializes.24 However, if there is a long-run effect, it would be more difficult to observe for voters as well. It is therefore unlikely that time or experience delays might explain our null finding for distributive politics, particularly in the face of the effect we find on local party support, as documented in the previous section. 23
We calculate 95% confidence intervals based on specification (5) in Appendix Table A.2. We find that the upper bounds on these confidence intervals are 0.04, 0.15, and 0.49, respectively, when standardizing the three policy outcome measures by their standard deviations. 24 In the election period 2001-2005, the parliament approved moving eight central government agencies out of Oslo. According to various sources, this process was completed within the next election period.
20
Figure 5: RD plots showing the effect of local representation in parliament on policy outcomes New road constructions (meter/100 inhabitants)
-.05
-.03
-.01 .01 Win margin
.03
.05
1.5 0
.5
1
1.5 1 .5 0
0
.5
1
1.5
2
Next period
2
Current period
2
Previuos period
-.05
-.03
-.01 .01 Win margin
.03
.05
-.05
-.03
-.01 .01 Win margin
.03
.05
.03
.05
.03
.05
Central government employees (increase/100 inhabitants)
-.05
-.03
-.01 .01 Win margin
.03
.05
.5 -1
-.5
0
.5 0 -.5 -1
-1
-.5
0
.5
1
Next period
1
Current period
1
Previuos period
-.05
-.03
-.01 .01 Win margin
.03
.05
-.05
-.03
-.01 .01 Win margin
Investment funding from central government (NOK/inhabitants)
-.05
-.03
-.01 .01 Win margin
.03
.05
2000 0
2000 0
0
2000
4000
Next period
4000
Current period
4000
Previuos period
-.05
-.03
-.01 .01 Win margin
.03
.05
-.05
-.03
-.01 .01 Win margin
Note: Policy outcomes are measured at the hometown (municipality) level. In the top panels, the hometowns of candidates are mapped into the municipality structure of 2014. The horizontal axis shows the margin by which the candidate wins a first-tier seat in the current national election. The sample in the top panel consists of all elections from 1953 to 2009. The sample in the two bottom panels consists of elections from 1973 to 2009. Road constructions are regarded as built in an election period if they are completed two years after the years included in the period (e.g., between 2008 and 2011 for the 2006-2009 period). The sample is limited to municipalities with exactly one candidate who is within 5 percentage points from winning a first-tier seat, no candidate who wins a second-tier seat, and no candidates winning a first-tier seat by a larger margin. Each bin represents an interval of half a percentage point. Separate linear regression lines are estimated to the left and right of the discontinuity using the underlying data, not the binned scatterpoints.
21
6
Discussion
In single-member district electoral contexts, there is a clear link between geography and representation. In multimember districts, and especially under closed-list PR, the electoral and policy impacts of local representation in the national legislature are less understood. In this study, we have made a first attempt at assessing the impact of local representation on voter behavior and distributive policy outcomes, using detailed candidate-level data on nominations and municipality-level data on policy outcomes from the closed-list PR case of Norway. Our results on voting behavior provide credible evidence that local representation within election districts matters. Voters reward parties with an MP from their hometown, even though individual MPs appear not to use their time in office to provide benefits to their hometown. This could imply that voters give their local MPs credit for benefits which they would have received anyway, or that they prefer local politicians for other reasons. If the effect of representation on party support in the next election is driven solely by the (re)nomination of a local top candidate, our results imply that a local top candidate increases a local party’s vote share by about 4-5 percentage points. This is comparable to the home county advantage documented by Rice and Macht (1987) in gubernatorial races in the United States, and also similar to the advantage enjoyed by local Norwegian candidates in an earlier period from 1906 to 1918 when a two-round SMD system was in place rather than PR (Fiva and Smith, 2017a). Given that closed-list PR systems are regarded as less candidate-centered, this finding of a local representation effect on voting is somewhat striking. A feature which might explain this pattern is that each party often wins only one seat per election district, which gives the top candidate a prominent position. In contrast to previous studies, we find no evidence that the hometown advantage is driven by higher voter turnout (mobilization by a local candidate of erstwhile abstainers).
22
This suggests that the hometowns of candidates affect the party choice of voters who have decided to vote, but who have weak preferences over parties. Since candidates’ hometowns are reported on the ballot, some voters might use this information to make their decision when already inside the voting booth. However, we cannot rule out that local mobilization effort during the election campaign might also matter (e.g., Crisp and Desposato, 2004). According to our results, representation within the election district does not matter for the allocation of public resources in this electoral setting. An open question is whether representation affects the allocation between districts under closed-list PR. For example, Helland and Sørensen (2009) find that Norwegian election districts that have more parliamentary seats relative to the population receive more national road investments. This question cannot be addressed within the research design we have used in this paper, but is an interesting topic for future research.
23
References Ansolabehere, Stephen, Alan Gerber and James Snyder. 2002. “Equal votes, equal money: Court-ordered redistricting and public expenditures in the American states.” American Political Science Review 96(4):767–778. Arzheimer, Kai and Jocelyn Evans. 2012. “Geolocation and voting: Candidate–voter distance effects on party choice in the 2010 UK general election in England.” Political Geography 31(5):301–310. Arzheimer, Kai and Jocelyn Evans. 2014. “Candidate geolocation and voter choice in the 2013 English County Council elections.” Research & Politics 1(2):1–9. Bengtsson, ˚ Asa, Kasper Hansen, Olafur Th. Hardarson, Hanne Marthe Narud and Henrik Oscarsson. 2013. The Nordic Voter: Myths of Exceptionalism. Colchester, U.K.: ECPR Press. Blais, Andr´e, Elisabeth Gidengil, Agnieszka Dobrzynska, Neil Nevitte and Richard Nadeau. 2003. “Does the Local Candidate Matter? Candidate Effects in the Canadian Election of 2000.” Canadian Journal of Political Science 36(3):657–664. Campbell, Rosie and Philip Cowley. 2014. “What Voters Want: Reactions to Candidate Characteristics in a Survey Experiment.” Political Studies 62(4):745–765. Carey, John M. and Matthew S. Shugart. 1995. “Incentives to Cultivate a Personal Vote: A Rank Ordering of Electoral Formulas.” Electoral Studies 14:417–440. Carozzi, Felipe and Luca Repetto. 2016. “Sending the pork home: Birth town bias in transfers to Italian municipalities.” Journal of Public Economics 134:42–52. Crisp, Brian F and Scott W Desposato. 2004. “Constituency building in multimember districts: Collusion or conflict?” Journal of Politics 66(1):136–156.
24
Esp´ırito-Santo, Ana and Edalina Rodrigues Sanches. 2018. “Looking for locals under a closed-list proportional representation system: The case of Portugal.” Electoral Studies 52:117–127. Ferejohn, John A. 1974. Pork barrel politics: Rivers and harbors legislation, 1947-1968. Stanford University Press. Fiva, Jon H. and Askill H. Halse. 2016. “Local Favoritism in At-large Proportional Representation Systems.” Journal of Public Economics 143:15 – 26. Fiva, Jon H. and Daniel M. Smith. 2017a. “Local Candidates and Voter Mobilization: Evidence from Historical Two-round Elections in Norway.” Electoral Studies 45:130 – 140. Fiva, Jon H. and Daniel M. Smith. 2017b. “Norwegian parliamentary elections, 1906-2013: Representation and turnout across four electoral systems.” West European Politics 40(6):1373–1391. Fiva, Jon H and Daniel M Smith. 2018. “Political dynasties and the incumbency advantage in party-centered environments.” American Political Science Review forthcoming. Folke, Olle. 2014. “Shades of Brown and Green: Party Effects in Proportional Election Systems.” Journal of the European Economic Association 12(5):1361–1395. Funk, Patricia and Christina Gathmann. 2013. “How do electoral systems affect fiscal policy? Evidence from cantonal parliaments, 1890–2000.” Journal of the European Economic Association 11(5):1178–1203. Gagliarducci, Stefano, Tommaso Nannicini and Paolo Naticchionia. 2011. “Electoral rules and politicians’ behavior: A micro test.” American Economic Journal: Economic Policy 3(3):144–174.
25
G´orecki, Maciej A and Michael Marsh. 2012. “Not just ‘friends and neighbours’: Canvassing, geographic proximity and voter choice.” European journal of political research 51(5):563–582. G´orecki, Maciej A and Michael Marsh. 2014. “A decline of ‘friends and neighbours voting’ in Ireland? Local candidate effects in the 2011 Irish ‘earthquake election’.” Political Geography 41:11–20. Hansen, Christian B. 2007. “Asymptotic properties of a robust variance matrix estimator for panel data when T is large.” Journal of Econometrics 141(2):597–620. Helland, Leif and Rune J Sørensen. 2009. “Geographical redistribution with disproportional representation: a politico-economic model of Norwegian road projects.” Public Choice 139(1-2):5–19. Horiuchi, Yusaku, Daniel M. Smith and Teppei Yamamoto. 2018. “Identifying Voter Preferences for Politicians’ Personal Attributes: A Conjoint Experiment in Japan.” Political Science Research and Methods forthcoming. Jankowski, Michael. 2016. “Voting for locals: Voters’ information processing strategies in open-list PR systems.” Electoral Studies 43:72–84. Key, V.O., Jr. 1949. Southern Politics in State and Nation. New York: Alfred A. Knopf. Knight, Brian. 2008. “Legislative Representation, Bargaining Power and the Distribution of Federal Funds: Evidence from the US Congress.” The Economic Journal 118(532):1785–1803. Latner, Michael and Anthony McGann. 2005. “Geographical representation under proportional representation: The cases of Israel and the Netherlands.” Electoral Studies 24(4):709–734. Lauridsen, Henning. 2011. “The impacts of road tolling: A review of Norwegian experience.” Transport Policy 18(1):85–91. 26
Lewis-Beck, Michael S. and Tom W. Rice. 1983. “Localism in Presidential Elections: The Home State Advantage.” American Journal of Political Science 27(3):548–556. Mayhew, D.R. 1974. Congress: the electoral connection. Yale studies in political science Yale University Press. Meredith, Marc. 2013. “Exploiting Friends-and-Neighbors to Estimate Coattail Effects.” American Political Science Review 107(04):742–765. Milesi-Ferretti, Gian Maria, Roberto Perotti, Massimo Rostagno et al. 2002. “Electoral Systems and Public Spending.” The Quarterly Journal of Economics 117(2):609–657. Narud, Hanne Marthe and Kaare Strøm. 2011. Norway: From Hønsvaldian Parliamentarism Back to Madisonian Roots. In The Madisonian Turn: Political Parties and Parliamentary Democracy in Nordic Europe, ed. Torbj¨orn Bergman and Kaare Strøm. University of Michigan Press pp. 200–250. Nemoto, Kuniaki and Matthew S. Shugart. 2013. “Localism and coordination under three different electoral systems: The national district of the Japanese House of Councillors.” Electoral Studies 32(1):1–12. Panagopoulos, Costas, Jan E. Leighley and Brian T. Hamel. 2017. “Are Voters Mobilized by a ‘Friend-and-Neighbor’ on the Ballot? Evidence from a Field Experiment.” Political Behavior 39:865–882. Pekkanen, Robert, Ellis S. Krauss and Benjamin Nyblade. 2006. “Electoral Incentives in Mixed Member Systems: Party, Posts, and Zombie Politicians in Japan.” American Political Science Review 100(2):183–193. Persson, Torsten and Guido Enrico Tabellini. 2003. The economic effects of constitutions. MIT press.
27
Put, Gert-Jan, Bart Maddens and Frederik Verleden. 2015. “The within-district distribution of party candidates: A geographical analysis of party lists for Belgian lower house elections.” Acta Politica . Rice, Tom W. and Alisa A. Macht. 1987. “Friends and Neighbors Voting in Statewide General Elections.” American Journal of Political Science 31(2):448–452. Saarimaa, Tuukka and Janne Tukiainen. 2016. “Local Representation and Strategic Voting: Evidence from Electoral Boundary Reforms.” European Journal of Political Economy 41:31–45. Shugart, Matthew Soberg. 2001. “Electoral “Efficiency” and the Move to Mixed-Member Systems.” Electoral Studies 20(1):173–193. Shugart, Matthew Søberg, Melody Ellis Valdini and Kati Suominen. 2005. “Looking for Locals: Voter Information Demands and Personal Vote-Earning Attributes of Legislators under Proportional Representation.” American Journal of Political Science 49(2):pp. 437–449. Statens vegvesen. 2014. H˚ andbok V440 Bruregistrering. Statens vegvesen, Vegdirektoratet. Stensvold, B. and O. Rønnestad. 2001. The Norwegian Bridge Management System named BRUTUS. In Strait Crossings 2001, ed. J. Krokeborg. Swets and Zeitlinger Publishers Lisse pp. 215–220. Stratmann, Thomas and Martin Baur. 2002. “Plurality Rule, Proportional Representation, and the German Bundestag: How Incentives to Pork-Barrel Differ across Electoral Systems.” American Journal of Political Science 46(3):pp. 506–514. Strøm, Kaare and Jørn Y. Leipart. 1993. “Policy, Institutions, and Coalition Avoidance: Norwegian Governments, 1945-1990.” The American Political Science Review 87:870– 887. 28
Tavits, Margit. 2010. “Effect of local ties on electoral success and parliamentary behaviour. The case of Estonia.” Party Politics 16(2):215–235. Valen, Henry, Hanne Marthe Narud and Audun Skare. 2002. Norway: Party Dominance and Decentralized Decision-Making. In Party Sovereignty and Citizen Control: Selecting Candidates for Parliamentary Elections in Denmark, Finland, Iceland and Norway, ed. Hanne Marthe Narud, Mogens N. Pedersen and Henry Valen. University Press of Southern Denmark pp. 169–215.
29
Appendix A: Supplementary figures and tables
0
10
20
30
40
Figure A.1: Density of observations, marginal candidates
−.04
−.02 0 .02 Distance to seat threshold
.04
Note: The horizontal axis shows by which margin the candidate wins a first-tier seat in the current national election. The sample is limited to marginal candidates, defined as being within 5 percentage points from winning a first-tier seat.
30
Figure A.2: Balance of hometown characteristics around the electoral threshold for winning a 1st-tier seat Longitude
8
60
9
61
10
62
11
63
12
64
Latitude
-.05
-.03
-.01 .01 Win margin
.03
.05
-.05
-.03
-.05
-.03
-.01 .01 Win margin
.03
.05
.03
.05
Population
.03
4000 6000 8000 10000
400 600 800 1000 1200
Area
-.01 .01 Win margin
.05
-.05
-.01 .01 Win margin
National roads (km)
0
50
60
.1
70
.2
80
.3
90
Regional capital
-.03
-.05
-.03
-.01 .01 Win margin
.03
.05
-.05
-.03
-.01 .01 Win margin
.03
.05
Note: The horizontal axis shows by which margin the candidate wins a first-tier seat in the current national election. The sample is limited to marginal candidates, defined as being within 5 percentage points from winning a first-tier seat (N=1469). Losing candidates who win second-tier seats are excluded. In the lower panels, the sample is limited to municipalities with exactly one marginal candidate (N=951). Each bin represents an interval of half a percentage point. Separate linear regression lines are estimated to the left and right of the discontinuity using the underlying data, not the binned scatterpoints.
31
Figure A.3: Central government jobs in the municipality
1000 500 0
0
500
1000
1500
Increase per 100 inhabitants
1500
Positions per 100 inhabitants
0
10
20
30
−20
−10
0
10
20
Note: The left panel shows the frequencies by the number of jobs per 100 inhabitants by the beginning of the election period. The right panel shows the change in the same measure from the beginning of the election period to the beginning of the next election period. Each bar has a width of 0.5. The sample consists of election periods from 1973-1977 to 2009-2013.
32
Figure A.4: Effect of a local MP on local party support: Sensitivity to bandwidth choice
.02 .01 0 -.01 -.02 -.03
-.03
-.02
-.01
0
.01
.02
.03
Triangular kernel
.03
Uniform kernel
0
.02
.04
Bandwidth
.06
.08
.1
0
.02
.04
Bandwidth
.06
.08
.1
Note: The graphs shows the results from the model reported in Table 2 for different bandwidths on both sides of the electoral threshold. The bandwidth is indicated on the horizontal axis. The solid line represent the point estimates. The dashed lines represent 90 percent confidence intervals based on a t-distribution with 16 degrees of freedom, as advocated by Hansen (2007). The left panel shows the results when using a uniform kernel (column (1) of Table 2), while the right panel shows the results when using a triangular kernel (column (7) of Table 2).
33
Table A.1: The effects of local representation in parliament on the probability of having a local first candidate 1st tier seat
2nd tier seat
(1) 0.296*** (0.056)
(3)
(4)
(5)
(6)
(7)
0.457*** (0.057)
1st or 2nd tier seat Mean of outcome var. SD of outcome var. R-squared Observations Time fixed effects Party fixed effects District fixed effects Rank fixed effects Kernel
(2)
0.306 0.461 0.10 1249 No No No No Unif.
0.340*** 0.343*** 0.287*** 0.294*** 0.267*** 0.317*** (0.055) (0.057) (0.053) (0.051) (0.055) (0.055) 0.306 0.306 0.306 0.306 0.306 0.323 0.461 0.461 0.461 0.461 0.461 0.468 0.09 0.11 0.20 0.22 0.28 0.10 1249 1249 1249 1249 1249 1249 No Yes Yes Yes Yes No No No Yes Yes Yes No No No No Yes Yes No No No No No Yes No Unif. Unif. Unif. Unif. Unif. Tria.
Note: The sample is limited to marginal candidates, defined as being within 5 percentage point distance from winning a first-tier seat. All specifications include a linear control function on both sides of the electoral threshold and dummies for the periods 1989-2001 and 2005-2009, during which two different systems for allocating second-tier seats are in place. Standard errors and corresponding significance stars are based on a cluster-robust covariance matrix, with clustering on the district level. * p < 0.10,** p < 0.05, *** p < 0.01.
34
Table A.2: The effects of local representation in parliament on policy outcomes Panel A: New road constructions (meter/100 inhabitants) (1) (2) (3) (4) (5) (6) Prev. Prev. Curr. Curr. Next Next 1st or 2nd tier seat 0.155 0.103 -0.051 0.062 -0.433 -0.553 (0.261) (0.208) (0.210) (0.191) (0.273) (0.359) Mean of outcome var. 0.546 0.502 0.532 0.570 0.626 0.590 SD of outcome var. 1.926 1.742 1.469 1.528 2.641 2.358 R-squared 0.01 0.09 0.01 0.11 0.01 0.08 Observations 635 635 597 597 560 560 Panel B: Central government jobs (increase 100/inhabitants) (1) (2) (3) (4) (5) (6) Prev. Prev. Curr. Curr. Next Next 1st or 2nd tier seat -0.154 -0.156 -0.041 -0.033 0.047 0.023 (0.115) (0.123) (0.079) (0.073) (0.067) (0.097) Mean of outcome var. -0.033 -0.015 0.043 0.006 -0.068 -0.047 SD of outcome var. 0.589 0.549 1.090 0.788 1.171 0.831 R-squared 0.10 0.31 0.03 0.19 0.03 0.14 Observations 368 368 412 412 370 370 Panel C: Investment funding (NOK 2015/inhabitant) (1) (2) (3) (4) (5) (6) Prev. Prev. Curr. Curr. Next Next 1st or 2nd tier seat 144.1 358.9 -82.8 -213.8 121.9 230.4 (444.4) (539.0) (411.1) (620.4) (418.5) (333.0) Mean of outcome var. 2273 2168 2220 2217 1874 1871 SD of outcome var. 2561 2325 2856 2783 1935 1846 R-squared 0.01 0.31 0.02 0.15 0.01 0.20 Observations 354 354 395 395 355 355 YearFE No Yes No Yes No Yes PartyFE No Yes No Yes No Yes DistrictFE No Yes No Yes No Yes RankFE No Yes No Yes No Yes Kernel Unif. Tria. Unif. Tria. Unif. Tria. Note: “Prev.”, “Curr.” and “Next” refer to the previous, current and next election period, respectively. Policy outcomes are measured at the hometown (municipality) level. In the top panel, the hometowns of candidates are mapped to the municipality structure of 2014. The sample is limited to municipalities with exactly one candidate who is within 5 percentage points from winning a first-tier seat, and no candidate who wins a second-tier seat or who wins a seat by a margin larger than 5 percentage points. All specifications include a linear control function on both sides of the electoral threshold and dummies for the periods 1989-2001 and 2005-2009. Standard errors and corresponding significance stars are based on a cluster-robust covariance matrix, with clustering on the district level. * p < 0.10,** p < 0.05, *** p < 0.01.
35