Molecular Ecology (2009) 18, 782–791
doi: 10.1111/j.1365-294X.2008.04069.x
Isotopic and genetic evidence for culturally inherited site fidelity to feeding grounds in southern right whales (Eubalaena australis) Blackwell Publishing Ltd
L U C I A N O O . VA L E N Z U E L A ,*† M A R I A N O S I R O N I ,†‡ V I C T O R I A J . R O W N T R E E *§ and J O N S E G E R * *Department of Biology, University of Utah, 257 South 1400 East, Salt Lake City, UT 84112, USA, †Instituto de Conservación de Ballenas, Miñones 1986, CP 1428, Ciudad de Buenos Aires, Argentina, ‡Cátedra de Diversidad Animal II, Universidad Nacional de Córdoba, Av. Vélez Sársfield 299, 5000 Córdoba, Argentina, §Ocean Alliance/Whale Conservation Institute, 191 Weston Rd, Lincoln, MA 01773, USA
Abstract Ocean warming will undoubtedly affect the migratory patterns of many marine species, but specific changes can be predicted only where behavioural mechanisms guiding migration are understood. Southern right whales show maternally inherited site fidelity to near-shore winter nursery grounds, but exactly where they feed in summer (collectively and individually) remains mysterious. They consume huge quantities of copepods and krill, and their reproductive rates respond to fluctuations in krill abundance linked to El Niño Southern Oscillation (ENSO). Here we show that genetic and isotopic signatures, analysed together, indicate maternally directed site fidelity to diverse summer feeding grounds for female right whales calving at Península Valdés, Argentina. Isotopic values from 131 skin samples span a broad range (–23.1 to –17.2‰ δ13C, 6.0 to 13.8‰ δ15N) and are more similar than expected among individuals sharing the same mitochondrial haplotype. This pattern indicates that calves learn summer feeding locations from their mothers, and that the timescale of culturally inherited site fidelity to feeding grounds is at least several generations. Such conservatism would be expected to limit the exploration of new feeding opportunities, and may explain why this population shows increased rates of reproductive failure in years following elevated sea-surface temperature anomalies off South Georgia, the richest known feeding ground for baleen whales in the South Atlantic. Keywords: baleen whales, genetic structure, mitochondrial DNA, philopatry, stable isotopes Received 13 October 2008; revision revised 23 November 2008; accepted 29 November 2008
Introduction Might an animal population fail to use all of its available food resources for many generations because cultural traditions direct its foraging to a subset of the suitable locations? Southern right whales (Eubalaena australis) had six known feeding grounds in the South Atlantic, based on the locations of catches recorded by 19th and 20th century whalers (IWC 2001). Today, the only known feeding ground used in the western South Atlantic is South Georgia (Moore et al. 1999; IWC 2001), despite the species’ sustained recovery from near extinction in the early 20th century to a population Correspondence: Luciano O. Valenzuela, Fax: (801) 581-4668; E-mail:
[email protected] Data deposition: GenBank Accession nos EU290462–EU290592.
that probably exceeds 19 000 in 2008 (by extrapolation from population size and growth rate estimates for all Southern Ocean breeding grounds in 1990; IWC 2001). Right whales make long annual migrations between mid-latitude coastal winter nursery grounds and mostly high-latitude offshore summer feeding grounds (IWC 2001). If calves learn these routes from their mothers and then follow them faithfully for life, matrilines will continue to use the same feeding grounds for many generations, despite the availability of better foraging opportunities elsewhere. Here we combine genetic and stable-isotopic analyses of the population calving at Península Valdés, Argentina, to show that such cultural conservatism may help to explain why southern right whales, although recovering numerically, have appeared slow to return to many parts of their historic range throughout the southern hemisphere. © 2009 The Authors Journal compilation © 2009 Blackwell Publishing Ltd
F I D E L I T Y T O F E E D I N G G R O U N D S I N R I G H T W H A L E S 783 In baleen whales, site fidelity is thought to be maternally transmitted with calves learning the location of nursery and feeding grounds during their first annual migration (Hoelzel 1998). Over many generations, maternally directed site fidelity can result in genetic differentiation among seasonal subpopulations (Hoelzel 1998). In the most intensely studied species, humpback whales (Megaptera novaeangliae, Palsbøll et al. 1997; Baker et al. 1998a, b) and North Atlantic right whales (Eubalaena glacialis, Schaeff et al. 1993; Malik et al. 1999), genetic differentiation of mitochondrial DNA (mtDNA) markers has been found among feeding grounds and among nursery grounds (the latter only in humpback whales in the North Pacific and Southern Hemisphere), consistent with female directed fidelity. Southern right whales show site fidelity to nursery grounds off the coasts of South America, South Africa, Australia and New Zealand (IWC 2001). Patenaude et al. (2007) detected mtDNA differentiation among these four nursery grounds and between feeding grounds off South Georgia and off south-western Australia. However, within ocean basins, mtDNA haplotypes from the feeding grounds were shared with two different nursery grounds (for example, haplotypes from South Georgia were shared with Península Valdés and South Africa). Thus, Patenaude et al. (2007) confirmed southern right whale site fidelity to nursery grounds and suggested that whales from different breeding populations within an ocean basin mix on common feeding grounds. The difficulty of obtaining samples representing the whales’ entire feeding range has prevented a thorough intra-oceanic feeding ground comparison. Despite genetic evidence linking southern right whale nursery grounds to shared feeding grounds, the population genetic structure (if any) on the feeding grounds remains unknown. Leaper et al. (2006) recently showed that the reproductive success of southern right whales breeding at Península Valdés, Argentina is affected by sea surface temperature (SST) anomalies off South Georgia. High-SST anomalies at South Georgia have been correlated with periods of low krill abundance (Trathan et al. 2003). Although southern right whale populations are recovering well from their former exploitation (IWC 2001), reproductive failures resulting from food stress are cause for concern (Leaper et al. 2006). The correlation between breeding failures, SST anomalies and low krill abundance also suggests that a large proportion of whales that use the Península Valdés nursery ground may feed near South Georgia, which is only one of six major historic feeding grounds for right whales in the South Atlantic (IWC 2001). Furthermore, whaling records show that southern right whales killed south of 50°S had stomachs filled with krill, north of 40°S had stomachs filled with copepods, and between these latitudes had stomachs filled with a mix of krill and copepods (Tormosov et al. 1998). The exact number and location of current feeding grounds, and the © 2009 The Authors Journal compilation © 2009 Blackwell Publishing Ltd
proportion of whales associated with each has not been documented (IWC 2001). Understanding a species’ migratory connections and genetic structure is critical to understanding the impact that fluctuations in food availability may have on it. If a species shows site fidelity to feeding areas, then the effects of changes in food abundance in one feeding ground may not spread throughout the entire breeding population, but be focused instead on particular genetic lineages. Intrinsic markers such as stable isotopes and genetic variability have been used with varying degrees of success to study migratory biology (Webster et al. 2002; Rubenstein & Hobson 2004). Stable carbon and nitrogen isotope ratios in animal tissues are good indicators of food sources and have been used to study animal movements in a broad range of species including butterflies, birds, fish and mammals (Hobson 1999; Rubenstein & Hobson 2004). Predictable patterns of isotope ratios across landscapes provide the basis for their use as tracers of migration (Hobson 1999; Rubenstein & Hobson 2004; West et al. 2006). In marine ecosystems, carbon isotope ratios (13C/12C) decline with increasing latitude, and coastal waters have higher ratios than pelagic waters (Rau et al. 1982; Hobson 1999; Kelly 2000; Rubenstein & Hobson 2004). Population-specific genetic markers have been widely used to study animal movements, particularly bird migration (Bensch & Hasselquist 1999; Wennerberg 2001). However, few studies have combined genetic and isotopic markers to study animal migration (Clegg et al. 2003; Kelly et al. 2005). In one such study, Clegg et al. (2003) used a combination of hydrogen isotope ratios and genetic markers to study the migratory patterns and connectivity of Wilson’s warbler (Wilsonia pusilla). These authors found a north–south structure of hydrogen isotope values and an east–west structure of genetic markers in breeding areas, confirming a previously suspected migratory pattern and population structure across North America (Clegg et al. 2003). Here we describe the population genetic structure of southern right whales on their feeding grounds by using a novel combination of genetic and stable-isotopic analyses of skin samples collected from live whales at Península Valdés, Argentina. Each skin sample provides the maternal lineage of the whale and information on its feeding location several months before sampling. We find that individuals from a given maternal lineage tend to have similar carbon and nitrogen isotopic values. These associations suggest that, throughout life, individuals tend to follow the migratory routes that they learned from their mothers during their first year.
Materials and methods Fieldwork and sample collection Skin samples were collected by biopsy darting adult female southern right whales on their nursery ground off Península
784 L . O . VA L E N Z U E L A E T A L . Valdés (42°30′S, 64°10′W), Argentina. Sample collection took place over four consecutive years (2003–2006) at the time of peak whale abundance (September and October, Payne 1986). Whales sampled in 2003 and 2006 correspond to the same calving cohort (Payne 1986). Adult females were recognized by the presence of an accompanying calf. To avoid including resampled whales, individuals were photographed for later identification based on callosity patterns (Payne et al. 1983). Each skin sample was divided into two subsamples in the field. One subsample was dried in preparation for stable carbon and nitrogen isotope analysis and the other was preserved in saturated sodium chloride with 20% dimethyl sulphoxide for genetic analysis (Amos & Hoelzel 1991). Samples were frozen on return to the laboratory at the University of Utah.
Stable carbon and nitrogen isotope analysis Dried samples were ground to a fine powder and lipid extracted following Todd et al. (1997). Approximately 1 mg of material per sample was analysed in a Carlo Erba 1108 elemental analyser coupled to a Thermo Finnigan Delta S Isotope Ratio Mass Spectrometer at the Stable Isotope Ratio Facility for Environmental Research (SIRFER) at the University of Utah. Isotope ratios are expressed as δ13C or δ15N (‰) = [(Rsample/Rstandard) − 1] × 1000, where R is 13C/12C or 15N/ 14 N, for δ13C or δ15N, respectively. Standards were referenced to Pee Dee Belemnite for carbon and to atmospheric air for nitrogen. The reproducibility of these measurements was 0.2‰ for both δ13C and δ15N after repeated analyses of an internal laboratory standard.
Genetic analysis DNA was extracted using standard protocols for cetacean skin described in Amos & Hoelzel (1991). Six hundred and thirty base pairs of the mitochondrial control region were amplified by polymerase chain reaction (PCR) using primers AB6617 and H00034 (Malik et al. 1999). The purified PCR product was then directly sequenced in both directions either at the DNA Sequencing Core Facility at the University of Utah Health Science Center or at the High-Throughput Genomics Unit, University of Washington. Sequences were assembled using Sequencher 4.5 software (Gene Codes Corp.). Haplotype (h) and nucleotide (π) diversity (Nei 1987) were estimated using Arlequin 2.0 (Schneider et al. 2000). The degree of differentiation among years was estimated by analysis of molecular variance (amova; Excoffier et al. 1992) as implemented in Arlequin 2.0.
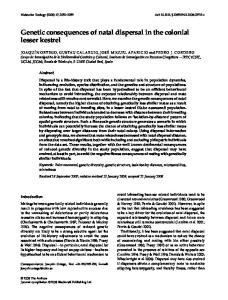
Statistical analysis The δ13C and δ15N distributions were significantly nonnormal (Shapiro–Wilk W-test: N = 131; P < 0.001; Fig. 1).
Fig. 1 Scatter plot and histograms of stable carbon and nitrogen isotope values for 131 adult female southern right whales sampled at Península Valdés, Argentina from 2003 to 2006. δ13C and δ15N values are not normally distributed (Shapiro–Wilk W test; P < 0.001).
Nonparametric statistics (Kruskal–Wallis analysis of variance by ranks and Dunn’s multiple comparisons test) were used to test for differences of isotopic values among years and among haplotypes (Dunn 1964; Sokal & Rohlf 1981). α was set at 5% for all tests, which were conducted in R (R Development Core Team 2005) and JMP (SAS Institute Inc. 2005). Under the null hypothesis of no site fidelity, it is expected that the isotopic variation within matrilines will be as great as the isotopic variation between matrilines. The standard way to test such a hypothesis would be by anova with haplotypes as factors. This straightforward approach is inappropriate here, however, owing to the lack of normality and the small sample sizes within some haplotypes. Instead, we used a randomization test (Manly 1997) to ask whether the isotopic variation within matrilines is as great as the isotopic variation between matrilines. As in a traditional one-factor anova, we estimated F as the ratio of between-group to within-group mean squares, but we compared this observed F-ratio to a sampling distribution constructed by randomization of the data, rather than to tabled values of the standard theoretical F-distribution (Manly 1997). This procedure involved scrambling the isotopic values and randomly assigning them to haplotypes, while maintaining the original distributions of isotopic values and haplotype frequencies. For each such randomized data set, we estimated the F-ratio exactly as for the real, nonrandomized data. We generated test-specific F-distributions by conducting 10 000 randomizations of the data under consideration. The significance © 2009 The Authors Journal compilation © 2009 Blackwell Publishing Ltd
F I D E L I T Y T O F E E D I N G G R O U N D S I N R I G H T W H A L E S 785 level for any given randomization test was the proportion of randomly generated F-ratios that were greater than or equal to the F-ratio for the real, nonrandomized data (Manly 1997). We also conducted a variation of this test that is directly suggested by the working hypothesis. If site fidelity is maternally directed, then we would predict that the isotopic difference between two whales from the same matriline should be smaller, on average, than the distance between two whales from different matrilines. We used the unsigned magnitudes of the isotopic differences between whales as a metric referred to as pairwise difference. We calculated the pairwise difference for each possible combination of individual whales and then separated the values into two groups: a group where both members of the pair had the same haplotype (difference within haplotypes, ΔWH) and a group where members had different haplotypes (difference between haplotypes, ΔBH). Under the null hypothesis, the mean values of ΔWH and ΔBH are equal. Under the alternative hypothesis, the mean difference within haplotypes (ΔWH) should be smaller than that between haplotypes (ΔBH). Because each sample appears in many pairwise comparisons, the assumption of independence for a two-way comparison (e.g. a t-test of ΔWH vs. ΔBH) is violated (Sokal & Rohlf 1981). For this reason, we used randomization, as described above, to generate sampling distributions of the test statistic D = ΔWH – ΔBH under the null hypothesis. We randomly associated observed isotopic values with observed haplotypes and then calculated values of D for the randomized data, repeating the randomization 1000 times for any given data set. The significance level was the proportion of randomly generated values of D that were smaller than or equal to the value of D for the original, nonrandomized data (Manly 1997).
Results Stable carbon and nitrogen isotopes Skin samples collected in September and October from 131 adult female southern right whales from 2003 to 2006 show a wide range of stable carbon and nitrogen isotope values (Fig. 1, Table 1), with δ13C ranging from –23.1 to –17.2‰ (mean = –20.8‰, SD = 1.3‰) and δ15N ranging from 6.0 to 13.8‰ (mean = 8.0‰, SD = 1.9‰). δ13C values differ among years (Kruskal–Wallis χ2 = 13.4; P = 0.004), with values in 2006 (median = –20.2‰) being significantly higher than those in 2004 and 2005 (median = –21.4 and –21.4‰ respectively; Dunn’s multiple comparisons tests; P < 0.05 for both comparisons). δ15N values also differ among years (Kruskal–Wallis χ2 = 8.2; P = 0.041), with values in 2006 (median = 7.8‰) being higher than those in 2005 (median = 7.1‰; Dunn’s multiple comparisons test; P < 0.05). © 2009 The Authors Journal compilation © 2009 Blackwell Publishing Ltd
Table 1 Mean (SD), range and median δ13C and δ15N of southern right whale skin samples by year of collection and for all years combined Year
Statistic
δ13C (‰)
δ15N (‰)
2003 (N = 12)
Mean ± SD Range Median Mean ± SD Range Median Mean ± SD Range Median Mean ± SD Range Median Mean ± SD Range Median
–20.9 ± 1.0 –22.3 to –19.2 –21.1a,b –21.1 ± 1.3 –23.1 to –17.9 –21.4a –21.1 ± 1.3 –23.0 to –18.3 –21.4a –20.1 ± 1.3 –22.0 to –17.2 –20.2b –20.8 ± 1.3 –23.1 to –17.2 –21.1
7.7 ± 1.5 6.7 to 12.3 7.2a,b 8.0 ± 1.8 6.1 to 13.7 7.3a,b 7.8 ± 1.9 6.0 to 13.5 7.1a 8.7 ± 2.2 6.4 to 13.8 7.8b 8.0 ± 1.9 6.0 to 13.8 7.3
2004 (N = 39) 2005 (N = 49) 2006 (N = 31) All years (N = 131)
Nonsignificant differences (Dunn’s multiple comparisons test; P < 0.05) between years are indicated by the same letter next to the medians. N is sample size.
Mitochondrial DNA sequence data Sequence analysis of a 630 bp region of the mitochondrial control region revealed 49 polymorphic sites defining 31 unique sequences or haplotypes (Table 2). The haplotypes are not equally represented in the sample. Six haplotypes account for 53% of the sample while ten occur only once (singletons, Table 2). Levels of haplotype and nucleotide diversity are similar across all four years (overall haplotype diversity h = 0.94 and nucleotide diversity π = 1.6%, Table 2). A modest but almost significant differentiation is detected by amova among years at the haplotype level (overall FST = 0.01; P = 0.06), and a similarly slight differentiation is significant at the nucleotide level (overall ΦST = 0.01; P = 0.02).
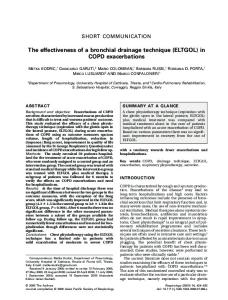
Isotopic values of individual haplotypes Isotopic values are not independent of haplotypes (Figs 2 and 3), and this effect is significant under all three of the tests that we used to examine it statistically. The most conservative is the nonparametric Kruskal–Wallis test, which rejects the null hypothesis both for δ13C (X2 = 41.1; P = 0.004) and for δ15N (X2 = 34.3; P = 0.024). The most liberal is the analogous one-way anova with significance estimated by randomization (δ13C: F = 3.02, P = 0.0004; δ15N: F = 3.64, P = 0.0002). The mean pairwise difference test yields intermediate significance levels (Table 3). The data for δ13C are shown graphically in Fig. 3a, which organizes them by haplotype and year. Some haplotypes show mostly low δ13C values (e.g. haplotype X), some show
786 L . O . VA L E N Z U E L A E T A L . Table 2 Frequency of mtDNA haplotypes and diversity indices by year of collection and for all years combined. Singletons are haplotypes observed in only one whale Haplotype
2003
2004
2005
2006
M F K E J B I A Q O W P H D C N L X Y Z BB Singletons h (SD) π (%) (SD) N
3 3
3 2 5 4 1 1 6 2 2 1
9 4 6 3 7 2
2 3 1 3
1 1
1 1 1
2 1 1 1 2 1
1
0.91 (0.06) 1.6 (0.97) 12
4 0.95 (0.02) 1.7 (0.88) 39
5 1 2 3 1 2
1 1 1 1 2 2 1
1 1
1 2 2 1 1 3 0.93 (0.02) 1.6 (0.84) 49
1 1 3 0.95 (0.02) 1.4 (0.72) 31
All years 17 12 12 11 9 8 7 6 6 4 4 4 4 3 2 2 2 2 2 2 2 10 0.94 (0.01) 1.6 (0.82) 131
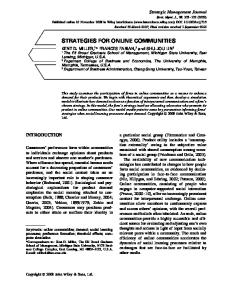
Fig. 2 Scatter plot of mean (± SE) carbon and nitrogen isotopic values for the 21 haplotypes with two or more individuals (nonsingletons). Haplotypes are not randomly distributed over the observed isotopic ranges (see text for statistical analyses).
with two or more individuals, the correlation between sample size and variance of δ13C is weak (r = 0.10, P = 0.37 by randomization). The data for nitrogen show similar patterns (Fig. 3b), but the correlation between sample size and within-haplotype variance appears to be stronger (r = 0.40, P = 0.06). Substantial fractions of the overall variance are explained by haplotype both for δ13C (intraclass correlation coefficient rI = 0.27) and for δ15N (rI = 0.32). The effect does not arise from just a few extreme haplotypes. Most, including the common ones, are less variable than expected. Nor does the effect arise from just one year. The mean pairwise difference in isotope values within haplotypes (ΔWH) is smaller than the mean pairwise difference between haplotypes (ΔBH), both for carbon and for nitrogen, in all years except 2004, and these yearly differences are individually significant in several cases (Table 3).
Haplotype (h) and nucleotide diversity (π) indices were indistinguishable across years. N is sample size.
relatively average values (e.g. haplotypes N and B), and some show mainly high values (e.g. haplotype BB). Not surprisingly, the more abundant haplotypes tend to show broader ranges of δ13C, but over all of the 21 haplotypes
Table 3 Mean pairwise difference in isotopic values within haplotypes (ΔWH) and between haplotypes (ΔBH) for δ13C and δ15N, for all samples combined (total) and for each sampling year. Singletons have been removed in each analysis δ13C
δ15N
Year
N
ΔWH (‰)
ΔBH (‰)
W < B?
P
ΔWH (‰)
ΔBH (‰)
W < B?
P
Total 2003 2004 2005 2006
121 6 32 43 25
1.19 0.88 1.66 0.85 0.91
1.47 1.65 1.59 1.43 1.42
Y Y N Y Y
0.002** 0.10 0.81 0.002** 0.023*
1.45 1.85 2.51 0.82 1.28
1.80 1.93 1.865 1.71 1.80
Y Y N Y Y
0.001** 0.19 0.987 0.005** 0.16
W < B? indicates whether (Y, N) ΔWH is smaller than ΔBH. P is the significance level of the randomization test (**P < 0.01, *P < 0.05) and indicates the proportion of randomly generated values of the difference (D) between ΔWH and ΔBH smaller than or equal to the observed D. N is sample size. © 2009 The Authors Journal compilation © 2009 Blackwell Publishing Ltd
F I D E L I T Y T O F E E D I N G G R O U N D S I N R I G H T W H A L E S 787
Fig. 3 δ13C (a) and δ15N (b) values of individual haplotypes. For each haplotype, the filled circle represents the mean isotopic value and the vertical lines (below haplotype means) represent the raw values. Raw isotopic values are organized vertically by year, with 2003 at the bottom and 2006 at the top (see haplotype M). Haplotypes are ordered from low (bottom of figure) to high (top) mean δ13C values. Only haplotypes sampled more than once are presented.
Discussion Southern right whale mitochondrial haplotype diversity is structured with respect to stable isotope values. Three independent statistical tests show that the isotope values are influenced by the haplotypes. The non-normal distributions of the isotope ratios (both carbon and nitrogen) prevented us from using parametric tests with greater statistical power (Sokal & Rohlf 1981). However, the results from our three alternative tests indicate a significant influence of maternal lineages on isotope ratios. This pattern is most simply explained by maternally directed site fidelity to feeding areas. Individual haplotypes show isotopic values that are more similar than expected, indicating that whales from © 2009 The Authors Journal compilation © 2009 Blackwell Publishing Ltd
the same matriline tend to consume isotopically similar food. Some haplotypes show larger ranges and more variation within and between years than others. Haplotypes with broad ranges may represent distinct but closely related matrilines that use different feeding grounds; these might be distinguished by longer mtDNA sequences, and work is under way to test this hypothesis. Nitrogen isotope values show larger variation than carbon, possibly because physiological processes and trophic position have a greater effect on δ15N than on δ13C (Hobson & Clark 1992b). It is well established that isotope values in a consumer’s tissues reflect those of its food (Hobson 1999; Kelly 2000; Rubenstein & Hobson 2004). It is also well established that δ13C (and to some extent δ15N) declines with latitude in
788 L . O . VA L E N Z U E L A E T A L . marine plankton (Rau et al. 1982; Hobson 1999; Kelly 2000; Schmidt et al. 2003). The large isotopic ranges seen in our data therefore appear to indicate a large feeding range. The lowest isotopic values seen in skin samples seem to correspond to isotopic values of krill and copepods around South Georgia and in waters of the Polar Front (Wada et al. 1987; Schmidt et al. 2003), while the highest values seem to correspond to ratios measured in euphausiids and copepods collected on the Patagonian shelf (Rowntree et al. 2001) and off the coast of Uruguay (unpublished data of L.O.V.). However, owing to the currently limited isotopic sampling of zooplankton across the South Atlantic, it is not possible to identify the exact feeding locations of southern right whales using only the stable isotope ratios of their skin. Work is under way to more thoroughly sample zooplankton across the South Atlantic and to use other tracers such as sulphur isotopes and metals in skin, baleen plates, and prey, to more accurately identify right-whale feeding locations. The isotopic values measured in our study fall within the range previously detected along the lengths of baleen plates of southern right whales that were stranded in South Africa (δ13C range = –26.5 to –16.0‰, δ15N range = 4.0 to 12.5‰; Best & Schell 1996) and in Argentina (δ13C range = –26.1 to –15.7‰; Rowntree et al. 2008). Both studies found that the isotopic values of the baleen plates oscillate strongly in what appear to be annual cycles and suggested that these cycles correspond to the whales’ annual migrations between isotopically different areas (Best & Schell 1996; Rowntree et al. 2008). Furthermore, Rowntree et al. (2008) found differences among individuals in both their mean isotopic values and the amplitudes of their annual cycles; the authors hypothesize that these variations reflect distinctive foraging patterns associated with the use of different feeding grounds. For example, one of the baleen plates had a higher mean and range of δ13C values (mean = –18.4‰; range = –19.7 to –15.7‰) than the other plates; three had lower values (mean –22.7‰; range = –26.1 to –19.6‰); and one plate had intermediate values (mean = –20.9‰; range = –23.9 to –16.2‰; Rowntree et al. 2008). Baleen, like hair, is a metabolically inert tissue after formation and provides a continuous record of dietary input (Schell et al. 1989; Rubenstein & Hobson 2004). However, skin is metabolically active and replaces its isotopes over time, thereby integrating food consumed through a window of time (Rubenstein & Hobson 2004). Metabolically active tissues have different isotope turnover rates; some turn over within hours or days (e.g. blood plasma and liver) and provide information on recent diets, while others take weeks (e.g. muscles) or years (e.g. bone collagen) and thereby integrate diets on longer timescales (Rubenstein & Hobson 2004). The residence time of carbon and nitrogen isotopes in cetacean skin is unknown but has been proposed to be somewhere between one and several
months (Todd 1997; Ruiz et al. 2004). Thus, our isotope ratios measured from skin samples probably represent signals from the feeding grounds, as modified to some extent by isotope ratios from more recent feeding events along the whales’ migratory routes from the feeding grounds to Península Valdés. On this interpretation, the isotopic variation of skin samples can be attributed largely to variation in the use of feeding grounds and to variation in the migratory paths of individual whales between the feeding grounds and Península Valdés, even though the relative contributions of these factors cannot yet be estimated. Nondietary factors such as age, nutritional status and reproductive status can influence isotope ratios, especially for nitrogen (Hobson & Clark 1992a, b; Roth & Hobson 2000; Fuller et al. 2004). In our study, the whales sampled were all nursing mothers that had been under similar physiological stresses for at least a year, including 12 months of gestation, migration to the nursery ground and lactation while fasting (Payne 1986; Cooke et al. 2001). To the degree that these stresses affect isotopic values, the effect should be similar for all individuals in the sample. However, the individuals must have varied in age and may also have varied significantly in time since the last major feeding event or time since the onset of lactation. Uncontrolled factors such as these would be expected to add random variation to the isotopic ratios, thereby increasing the variability within haplotypes and weakening any signal of matrilineal structuring of the isotopic variation. Thus, although we cannot say exactly what fraction of the overall isotopic variation arises from isotopic differences in the prey consumed by individuals, the observed differences among haplotypes clearly indicate that matrilineal relatives tend to experience similar effects of one or more factors that influence their isotopic ratios. The major factor seems likely to be prey isotopic ratios which differ substantially among the known and potential feeding grounds, but other factors such as times of return from feeding to breeding grounds could also be involved. The interannual differences in the general distribution of δ13C and δ15N detected in this study are most likely a response to variations in the isotopic composition at the base of the food web produced by changes in ocean circulation or by modification of local biogeochemical processes (Peterson & Fry 1987; Druffel & Griffin 1999; Brix et al. 2004). An alternative explanation is that in 2006 the whales migrated to isotopically distinct feeding regions. If this were true, however, the isotopic values of the samples from 2006 should not show any particular pattern. Instead, they tend to be higher than values for the same haplotype in other years (see Fig. 3). For example, 9 of the 15 haplotypes sampled in 2006 showed the highest δ13C values for that haplotype, and 7 of the 15 haplotypes had their highest δ15N values. In addition, the lack of genetic differentiation among years at the haplotype level indicates that the 2006 whales were not a genetically distinct subset of whales. © 2009 The Authors Journal compilation © 2009 Blackwell Publishing Ltd
F I D E L I T Y T O F E E D I N G G R O U N D S I N R I G H T W H A L E S 789 Our results show a pattern of fine-scale, long-term genetic substructuring within a breeding population that is most simply explained by maternally directed fidelity to different feeding sites. North Atlantic right whales (Eubalaena glacialis) and humpback whales (Megaptera novaeangliae) show similar site fidelity to feeding grounds but mix on common breeding grounds (Schaeff et al. 1993; Palsbøll et al. 1995; Larsen et al. 1996; Malik et al. 1999). In contrast, Patenaude et al. (2007) suggest that southern right whales from different breeding populations within an ocean basin mix on common feeding grounds. For whale species that feed in the Southern Ocean, where there are no land barriers to circumpolar migration, Hoelzel (1998) suggested that animals from different breeding grounds should form mixed genetic assemblages on widely dispersed feeding areas. We suggest that the assemblages detected by Patenaude et al. (2007) represent mixed subsets of maternal lineages with site fidelity to specific feeding grounds rather than an unstructured mix of animals migrating randomly from different nursery grounds. Therefore, southern right whale population structure may mirror that of humpback whales in the North Pacific, where the whales are genetically segregated on both the nursery and feeding grounds (Baker et al. 1998b). The correlation of SST anomalies off South Georgia and reduced calf output at Península Valdés (Leaper et al. 2006) suggests a strong migratory connection between these two areas, but our isotopic data imply that the Valdés whales feed in many different locations distributed over a large geographical range. We see two possible explanations for this apparent disagreement: (i) the SST anomalies detected at South Georgia might affect many other feeding locations, and therefore stress most of the whales that visit Península Valdés; or (ii) the SST anomalies might affect only the whales that visit South Georgia, but so strongly that calf production is reduced detectably for the population as a whole. These alternatives could be distinguished by analysing the individual reproductive histories of females using Península Valdés to see whether particular matrilines fail to reproduce in years following SST anomalies and low krill abundance near South Georgia. On short ecological timescales, strong site fidelity could restrict a population to a set of culturally inherited areas and migratory patterns that represent only a portion of its potential range (Matthiopoulos et al. 2005; Clapham et al. 2008). The pattern described here suggests that the timescale of matrilineal site fidelity to feeding areas is at least several generations. The finding of Leaper et al. (2006) raises concern about the future of southern right whales if krill fisheries and climate change turn out to have a significant impact on krill abundance (Atkinson et al. 2004). If whales follow foraging strategies and migratory patterns learned from their mothers, will they be flexible enough to change their strategies and switch to other prey types with different spatial and temporal distributions? Some © 2009 The Authors Journal compilation © 2009 Blackwell Publishing Ltd
mitochondrial lineages show relatively large stable isotope ranges, suggesting that a few members of those lineages experimented with different locations or prey types in the relatively recent past. If we can better understand the causes and consequences of this limited plasticity, then we might be better able to predict the responses of southern right whales and other marine migrants to global climate change.
Acknowledgements We thank Fred Adler, Denise Dearing, James Ehleringer, David Podlesak and Sydney Stringham for helpful comments and discussions. We thank B. Amos and an anonymous reviewer for their comments. We thank the following individuals for their invaluable contribution to sample collection: Rafael Benegas, Moira Brown, Carole Carlson, Jose Carracedo, Sarah Haney, Julieta Martino, Maximiliano Oro, Martin Quadro, Roxana Schteinbarg, Sydney Stringham, Diego Taboada and Alejandra Varisco. We also thank R. Schteinbarg, D. Taboada and all Instituto de Conservación de Ballenas volunteers for their logistic and institutional support. We thank Armada Argentina and Guillermo Harris of Wildlife Conservation Society for permission to use the research station. SIRFER members (especially C. Cook) and Zofia A. Kaliszewska provided invaluable technical assistance. This work was supported by funding from Ocean Alliance/Whale Conservation Institute (OA/WCI), Canadian Whale Institute, Modeling the Dynamics of Life Fund (University of Utah), Department of Biology (University of Utah) and Associated Students of the University of Utah (ASUU) Senate Contingency Fund. Field work was conducted under permits from Dirección de Fauna y Flora Silvestre and Secretaria de Turismo y Areas Protegidas del Organismo Provincial de Turismo, Chubut Province. Samples were imported under permits NMFS #751-1614 to OA/WCI and CITES #03US819824/9, #04US082589/9, #05US819824/9 to OA/WCI. This research was approved by the University of Utah Institutional Animal Care and Use Committee (IACUC) under assigned protocol number 05-01003.
References Amos B, Hoelzel AR (1991) Long-term preservation of whale skin for DNA analysis. Report of the International Whaling Commission, Special Issue 13, 99–103. Atkinson A, Siegel V, Pakhomov E, Rothery P (2004) Long-term decline in krill stock and increase in salps within the southern ocean. Nature, 432, 100–103. (doi:10.1038/nature02996). Baker CS, Florez-Gonzalez L, Abernethy B et al. (1998a) Mitochondrial DNA variation and maternal gene flow among humpback whales of the southern hemisphere. Marine Mammal Science, 14, 721–737. (doi:10.1111/j.1748-7692.1998.tb00758.x). Baker CS, Medrano-Gonzalez L, Calambokidis J et al. (1998b) Population structure of nuclear and mitochondrial DNA variation among humpback whales in the north pacific. Molecular Ecology, 7, 695–707. (doi:0.1046/j.1365-294X.1998.00384.x). Bensch S, Hasselquist D (1999) Phylogeographic population structure of great reed warblers: an analysis of mtDNA control region sequences. Biological Journal of the Linnean Society, 66, 171–185. (doi:10.1111/j.1095-8312.1999.tb01882.x). Best P, Schell D (1996) Stable isotopes in southern right whale
790 L . O . VA L E N Z U E L A E T A L . (Eubalaena australis) baleen as indicators of seasonal movements, feeding and growth. Marine Biology, 124, 483– 494. (doi: 10.1007/BF00351030). Brix H, Gruber N, Keeling CD (2004) Interannual variability of the upper ocean carbon cycle at station aloha near Hawaii. Global Biogeochemical Cycles, 18, GB4019. (doi:10.1029/2004GB002245). Clapham PJ, Aguilar A, Hatch LT (2008) Determining spatial and temporal scales for management: lessons from whaling. Marine Mammal Science, 24, 183–201. (doi:10.1111/j.17487692.2007.00175.x). Clegg SM, Kelly JF, Kimura M, Smith TB (2003) Combining genetic markers and stable isotopes to reveal population connectivity and migration patterns in a Neotropical migrant, Wilson’s warbler (Wilsonia pusilla). Molecular Ecology, 12, 819– 830. (doi:10.1046/j.1365-294X.2003.01757.x). Cooke J, Payne R, Rowntree V (2001) Estimates of demographic parameters for southern right whales (Eubalaena australis) observed off Península Valdés, Argentina. Journal of Cetacean Research and Management, Special Issue 2, 125–132. Druffel ERM, Griffin S (1999) Variability of surface ocean radiocarbon and stable isotopes in the southwestern pacific. Journal of Geophysical Research, 104, 23,607–23,623,613. Dunn DJ (1964) Multiple comparisons using rank sums. Technometrics, 5, 241–252. Excoffier L, Smouse PE, Quattro JM (1992) Analysis of molecular variance inferred from metric distances among DNA haplotypes: application to human mitochondrial DNA restriction data. Genetics, 131, 479–491. Fuller BT, Fuller JL, Sage NE, Harris DA, O’Connell TC, Hedges RE (2004) Nitrogen balance and δ15N: why you’re not what you eat during pregnancy. Rapid Communications in Mass Spectrometry, 18, 2889–2896. (doi:10.1002/rcm.1708). Hobson K (1999) Tracing origins and migration of wildlife using stable isotopes: a review. Oecologia, 120, 314–326. (doi:10.1007/ s004420050865). Hobson KA, Clark RG (1992a) Assessing avian diets using stable isotopes I: turnover of 13C in tissues. Condor, 94, 181–188. Hobson KA, Clark RG (1992b) Assessing avian diets using stable isotopes II: factors influencing diet-tissue fractionation. Condor, 94, 189–197. Hoelzel A (1998) Genetic structure of cetacean populations in sympatry, parapatry, and mixed assemblages: implications for conservation policy. Journal of Heredity, 89, 451–458. (doi:10.1093/jhered/89.5.451). International Whaling Commission (2001) Report of the workshop on the comprehensive assessment of right whales: a worldwide comparison. Journal of Cetacean Research and Management, Special Issue, 2, 1–60. Kelly JF (2000) Stable isotopes of carbon and nitrogen in the study of avian and mammalian trophic ecology. Canadian Journal of Zoology, 78, 1–27. (doi:10.1139/cjz-78-1-1). Kelly JF, Ruegg K, Smith TB (2005) Combining isotopic and genetic markers to identify breeding origins of migrant birds. Ecological Applications, 15, 1487–1494. (doi:10.1890/ 04-1704). Larsen AH, Sigurjonsson J, Øien N, Vikingsson G, Palsbøll P (1996) Population genetic analysis of nuclear and mitochondrial loci in skin biopsies collected from central and northeastern North Atlantic humpback whales (Megaptera novaeangliae): population identity and migratory destinations. Proceedings of the Royal Society B: Biological Sciences, 263, 1611–1618. (doi: 10.1098/rspb 1996.0236).
Leaper R, Cooke J, Trathan P, Reid K, Rowntree VJ, Payne R (2006) Global climate drives southern right whale (Eubalaena australis) population dynamics. Biology Letters, 2, 289–292. (doi:10.1098/ rsbl.2005.0431). Malik S, Brown MW, Kraus S, Knowlton A, Hamilton P, White B (1999) Assessment of mitochondrial DNA structuring and nursery use in the North Atlantic right whale (Eubalaena glacialis). Canadian Journal of Zoology, 77, 1217–1222. (doi:10.1139/ cjz-77-8-1217). Manly BF (1997) Randomisation, Bootstrap and Monte Carlo Methods in Biology, 2nd edn. Chapman & Hall, London, UK. Matthiopoulos J, Harwood J, Thomas L (2005) Metapopulation consequences of site fidelity for colonially breeding mammals and birds. Journal of Animal Ecology, 74, 716–727. (doi:10.1111/ j.1365-2656.2005.00970.x). Moore M, Berrow S, Jensen B et al. (1999) Relative abundance of large whales around South Georgia (1979–1998). Marine Mammal Science, 15, 1287–1302. (doi:10.1111/j.17487692.1999.tb00891.x). Nei M (1987) Molecular Evolutionary Genetics. Columbia University Press, New York. Palsbøll PJ, Clapham PJ, Mattila DK et al. (1995) Distribution of mtDNA haplotypes in North Atlantic humpback whales: the influence of behaviour on population structure. Marine Ecology Progress in Series, 116, 1–10. Palsbøll PJ, Allen J, Berubé M et al. (1997) Genetic tagging of humpback whales. Nature, 388, 767–769. Patenaude NJ, Portway VA, Schaeff CM et al. (2007) Mitochondrial DNA diversity and population structure among southern right whales (Eubalaena australis). Journal of Heredity, 98, 147– 157. (doi:10.1093/jhered/esm005). Payne R (1986) Long term behavioural studies of the southern right whale (Eubalaena australis). Report of the International Whaling Commission, Special Issue 10, 161–167. Payne R, Brazier O, Dorsey E, Perkins J, Rowntree V, Titus A (1983) External features in southern right whales (Eubalaena australis) and their use in identifying individuals. In: Communication and Behavior of Whales, Volume AAAS Selected Symposia Series 76, pp. 371–445. Westview Press, Boulder, Colorado. Peterson BJ, Fry B (1987) Stable isotopes in ecosystem studies. Annual Review of Ecology and Systematics, 18, 293–320. (doi:10.1146/annurev.es.18.110187.001453). R Development Core Team (2008) R: A language and environment for statistical computing. R Foundation for Statistical Computing, Vienna, Austria. ISBN 3-900051-07-0, http://www.R-project.org. Rau G, Sweeney R, Kaplan I (1982) Plankton 13C:12C ratio changes with latitude: differences between northern and southern oceans. Deep-Sea Research, 29, 1035–1039. Roth JD, Hobson KA (2000) Stable carbon and nitrogen isotopic fractionation between diet and tissue of captive red fox: implications for dietary reconstruction. Canadian Journal of Zoology, 78, 848–852. (doi: 10.1139/cjz-78-5-848). Rowntree VJ, Payne R, Schell D (2001) Changing patterns of habitat use by southern right whales (Eubalaena australis) on their nursery ground at Península Valdés, Argentina, and in their long-range movements. Journal of Cetacean Research and Management, Special Issue 2, 133–143. Rowntree VJ, Valenzuela LO, Fraguas PF, Seger J (2008) Foraging behaviour of southern right whales (Eubalaena australis) inferred from variation of carbon stable isotope ratios in their baleen. Report to the International Whaling Commission, SC/60/ BRG23. © 2009 The Authors Journal compilation © 2009 Blackwell Publishing Ltd
F I D E L I T Y T O F E E D I N G G R O U N D S I N R I G H T W H A L E S 791 Rubenstein D, Hobson K (2004) From birds to butterflies: animal movement patterns and stable isotopes. Trends in Ecology & Evolution, 19, 256–263. (doi:10.1016/j.tree.2004.03.017). Ruiz-Cooley RI, Gendron D, Aguíñiga S, Mesnick S, Carriquiry J (2004) Trophic relationships between sperm whales and jumbo squid using stable isotopes of C and N. Marine Ecology Progress in Series, 277, 275–283. SAS Institute Inc (2005) JMP, version 7. 1989–2005. Cary, NC. Schaeff C, Kraus S, Brown MW, White B (1993) Assessment of the population structure of western North Atlantic right whales (Eubalaena glacialis) based on sighting and mtDNA data. Canadian Journal of Zoology, 71, 339–345. (doi:10.1139/cjz-71-2-339). Schell D, Saupe S, Haubenstock N (1989) Bowhead whale (Balaena mysticetus) growth and feeding as estimated by δ13C techniques. Marine Biology, 103, 433–443. Schmidt K, Atkinson A, Stubing D, McClelland JW, Montoya JP, Voss M (2003) Trophic relationships among southern ocean copepods and krill: some uses and limitations of a stable isotope approach. Limnology and Oceanography, 48, 277–289. Schneider S, Roessli D, Excoffier L (2000) Arlequin: A Software for Population Genetics Data Analysis, Ver 2.000. Genetics and Biometry Lab, Dept. of Anthropology, University of Geneva, Switzerland. Sokal R, Rohlf F (1981) Biometry: The Principles and Practice of Statistics in Biological Research, 2nd edn. W.H. Freeman and Company, New York. Todd S (1997) Dietary patterns of humpback whales (Megaptera novaeangliae) in the northwest Atlantic: Evidence from 13C and 15 N stable isotopes. PhD thesis. Memorial University of Newfoundland, Newfoundland, Canada. Todd S, Ostrum P, Lien J, Abrajano J (1997) Use of biopsy samples of humpback whale (Megaptera novaeangliae) skin for stable isotope (δ13C) determination. Journal of Northwest Atlantic Fishery Science, 22, 71–76. Tormosov D, Mikhaliev Y, Best P, Zemsky V, Sekiguchi K, Brownell RJ (1998) Soviet catches of southern right whales Eubalaena australis, 1951–1971. Biological data and conservation implications. Biological Conservation, 86, 185–197. (doi:10.1016/ S0006-3207(98)00008-1).
© 2009 The Authors Journal compilation © 2009 Blackwell Publishing Ltd
Trathan PN, Brierley AS, Brandon MA et al. (2003) Oceanographic variability and changes in Antarctic krill (Euphausia superba) abundance at South Georgia. Fisheries Oceanography, 12, 569– 583. (doi:10.1046/j.1365-2419.2003.00268.x). Wada E, Terazaki M, Kabaya Y, Nemoto T (1987) 15N and 13C abundances in the Antarctic Ocean with emphasis on the biogeochemical structure of the food web. Deep-Sea Research Part A — Oceanographic Research Papers, 34, 829–841. Webster MS, Marra PP, Haig SM, Bensch S, Holmes RT (2002) Links between worlds: unraveling migratory connectivity. Trends in Ecology & Evolution, 17, 76–83. (doi:10.1016/S01695347(01)02380-1). Wennerberg L (2001) Breeding origin and migration pattern of dunlin (Calidris alpina) revealed by mitochondrial DNA analysis. Molecular Ecology, 10, 1111–1120. (doi: 10.1046/j.1365294X.2001.01256.x). West JB, Bowen GJ, Cerling TE, Ehleringer JR (2006) Stable isotopes as one of nature’s ecological recorders. Trends in Ecology & Evolution, 21, 408–414.
Luciano O. Valenzuela is currently a postdoctoral fellow in the Department of Biology and in IsoForensics Inc., where he is working with stable isotopes of human and animal hair. This paper is one of the chapters of his doctoral thesis at the University of Utah. Mariano Sironi is the scientific director of the Instituto de Conservacion de Ballenas, an argentine non-profit organization dedicated to protect the whales and their habitat through research, conservation and education activities. Vicky Rowntree directs the long-term study of the Peninsula Valdez population, which was begun by Roger Payne in 1971. The study was the first to use repeated photo-identification of known individuals to estimate demographic and population parameters for a large whale species. Jon Seger studies the evolutionary genetics of the cyamids (whale lice) that live on right whales. Their simple, well-defined ecologies and large, well-mixed populations make them a good system with which to address a number of basic theoretical questions.