b r a z i l i a n j o u r n a l o f m i c r o b i o l o g y 4 7 (2 0 1 6) 18–24
http://www.bjmicrobiol.com.br/
Environmental Microbiology
Isolation and characterization of phenol degrading yeasts from wastewater in the coking plant of Zarand, Kerman Maryam Karimi a,b , Mehdi Hassanshahian c,∗ a b c
Department of Microbiology, Kerman Branch, Islamic Azad University, Kerman, Iran Department of Microbiology, Kerman Sience and Reaserch Branch, Islamic Azad University, Kerman, Iran Department of Biology, Faculty of Sciences, Shahid Bahonar University of Kerman, Kerman, Iran
a r t i c l e
i n f o
a b s t r a c t
Article history:
Phenol and phenolic compounds are environmental pollutants present in industrial wastew-
Received 12 January 2014
aters such as coal tar, oil refineries and petrochemical plants. Phenol removal from industrial
Accepted 15 August 2014
effluents is extremely important for the protection of environment. Usually, phenol degradation is carried out by physicochemical methods that are costly and produce hazardous
Associate Editor: Lara Durães Sette Keywords: Biodegradation Coal tar Coking plant Yeast Zarand
metabolites. Recently, phenol biodegradation has been considered. Yeasts are the most important phenol biodegraders. In this study, the phenol-degrading yeast from environmental samples (soil and wastewater) was isolated from the coking plant of Zarand, Kerman. Then total heterotrophic yeasts were counted. The soil samples had higher rates of yeast degrader, in comparison to wastewater samples. After three passages, four yeasts (K1, K2, K7 and K11) that had the highest growth rate were selected for further study. Also, these yeasts were able to remove phenol measured by Gibbs reagent. The effect of four different concentrations of phenol (50, 125, 200 and 275) mg L−1 was measured and three degradation patterns in these yeasts were observed. The hydrophobicity and emulsification activity were measured in all eleven yeasts. Finally, strong yeasts in phenol degrading yeasts were identified by molecular method using amplification of 18S rRNA gene region. The sequencing results showed that these isolated yeasts belonged to Candida tropicalis strain K1, Pichia guilliermondii strain K2, Meyerozyma guilliermondii strain K7 and C. tropicalis strain K11. © 2015 Sociedade Brasileira de Microbiologia. Published by Elsevier Editora Ltda. This is an open access article under the CC BY-NC-ND license (http://creativecommons.org/licenses/by-nc-nd/4.0/).
Introduction Due to the toxic properties of both phenol and chlorophenol, the efficient removal of these compounds from industrial aqueous effluents is of great practical significance for
∗
environmental protection. Because of the improper treatment of these materials, they have widely contaminated soil and groundwater, and their toxicity seriously affects living organisms. Once wastewater containing phenolic compounds is discharged into the receiving body of water, it endangers fish life, even at a relatively low concentration,
Corresponding author. E-mails:
[email protected],
[email protected] (M. Hassanshahian). http://dx.doi.org/10.1016/j.bjm.2015.11.032 1517-8382/© 2015 Sociedade Brasileira de Microbiologia. Published by Elsevier Editora Ltda. This is an open access article under the CC BY-NC-ND license (http://creativecommons.org/licenses/by-nc-nd/4.0/).
b r a z i l i a n j o u r n a l o f m i c r o b i o l o g y 4 7 (2 0 1 6) 18–24
e.g., 5–25 mg L−1 .1–3 After physical and chemical purification procedures, the phenol concentration is decreased to 0.3–0.4 g L−1 .4 For many years, activated sludge was used to change phenolic contamination.4–6 Beside physical and chemical methods, biological methods for removal play an important role in wastewater management. To treat phenolic compounds, biodegradation techniques have recently been developed for their economical advantages and the low possibility of the production of byproducts.6 Phenol is not readily degradable and can be very toxic to most types of microorganisms at sufficiently high concentration. Phenol can inhibit the growth rate, even among those species that have the metabolic capability of using it as a substrate for growth. Various phenol-degrading microorganisms have been extensively studied to develop and improve the technological processes of biodegradation. A number of studies with prokaryotic microorganisms have been carried out.7–11 However, the use of such technology is confined due to phenolic toxic properties, especially 4-cholorophenol, for microorganisms. Some yeast strains are reported to have the capability of utilizing phenol.4 Only some members of the yeast genera, including Rhodotorula, Trichosporon, and Candida, can metabolize phenolic compounds as the only source of carbon and energy.9 Some Rhodotorula species show a significant capacity to degrade phenol, catechol, cresol, resorcinol, 3-methoxybenzoic acid and hydroquinones.12 Basak et al.,13 worked on the biodegradation of 4-chlorophenol using Candida tropicalis PHB5 by optimizing physicochemical parameters. It was found that the yeast was able to grow on 4-chlorophenol and metabolize this substrate.13 Phalgune et al.14 explained the process of phenol biodegradation by the yeast C. tropicalis NCIM 3556 in aqueous medium using DOSY NMR techniques. This test indicated that the phenol was completely degraded to carbon dioxide and water within approximately 20 h after incubation.14 Hassanshahian et al.,15 described the ability of two different yeast strains, Yarrowia lipolytica PG-20 and PG-32, in decomposing aromatic hydrocarbons.16 Chandran and Das17 isolated C. tropicalis from some oil contaminated soil that had high ability to produce biosurfactants capable of degrading diesel oil during ten days.17 The coking plant of Zarand is located seven kilometers road from Zarand, in the province of Kerman, Iran. This factory has an area of 100 ha. There are many toxic pollutants in the wastewater of this coking plant, such as phenol, Ammonium (NH3), cresol, etc., but the main pollutant of this factory is phenol. The aim of this study was characterization of phenol degrading yeasts from the wastewater of this coking plant in Zarand, Kerman.
Materials and methods Sampling For the isolation of phenol degrading yeasts, soil and wastewater samples were collected from the coking plant of Zarand (Kerman, Iran). The soil and wastewater samples were collected from three regions of this coking plant (37◦ 30, N; 49◦ 15, E). The soil samples were taken from 2 cm below the surface and wastewater samples were obtained from 1 cm below the surface. The samples were collected into sterile jars, placed on
19
ice, and immediately transported to the laboratory for further analysis.
Total count of heterotrophic and degradative yeasts in the collected samples For the enumeration of heterotrophic and degradative yeasts in the collected samples, serial dilutions were performed in PDA (Potato Dextrose Agar) and BHMS (Bushnell Hass Mineral Salt) media, respectively. The plates were incubated at 30 ◦ C. After two days, the numbers of grown colonies were counted.
Isolation of phenol-degrading yeasts A synthetic Bushnell Hass Mineral Salts medium (BHMS) was used for the isolation of degrading yeasts. BHMS medium contained (g L−1 ): KH2 PO4 , 1; K2 HPO4 , 0.2; MgSO4 ·7H2 O, 0.2; CaCl2 , 0.02; NH4 NO3 , 1; NaCl2 ; and 2 droplets of 60% FeCl3 . The pH was adjusted to 5/5–6. The BHMS medium was supplemented with 1% (v/v) phenol as the sole source of carbon and energy. To inhibit the growth of bacteria, 400 L chloramphenicol (0.05% v/v) was added to the BHMS medium. A portion of the soil (5 g) or wastewater (5 mL) sample was added to 250 mL Erlenmeyer flasks containing 100 mL of the BHMS medium; the flasks were incubated for 10 days at 30 ◦ C on a rotary shaker (INFORS AG, Germany) operating at 200 × g. Then, 5 mL aliquots were transferred to fresh BHMS medium. After a series of three further subcultures, inoculums from the flask were streaked out, and phenotypically different colonies were purified on Sabro dextrose agar medium.15
Growth rate and phenol biodegradation by the isolated strains Growth rate of the isolates were routinely assessed indirectly by turbidity measurement (O.D. at 600 nm) in a UV–visible spectrophotometer (Shimadzu UV-160, Japan). The phenol removal assay was carried out using 2,4 dichloro-quinon-4chloroimide dyes (Gibb’s reagent). By this method, 150 mL medium was centrifuged (6000 × g for 10 min), 30 mL Na2 HCO3 and 20 mL Gibb’s reagent were then added to the supernatants, and the colors developed were read at 630 nm.18
Growth of the selected strains on different concentrations of phenol The effect of different concentrations of phenol (50, 125, 200, 275 mg L−1 ) on the growth of selected yeast strains was measured. For this purpose, BHMS medium was supplemented with various concentrations of phenol. The flasks were incubated for 10 days at 30 ◦ C on a rotary shaker operating at 180 rpm. Growth was routinely assessed indirectly by turbidity measurement (O.D. at 600 nm) in a UV–visible spectrophotometer (Shimadzu UV-160, Japan).
Measurement of emulsification activity and bacterial adherence to hydrocarbons (BATH) The emulsification activity (E24 ) was determined by combining equal volumes of hexadecane and cell-free culture
20
b r a z i l i a n j o u r n a l o f m i c r o b i o l o g y 4 7 (2 0 1 6) 18–24
broth, mixing them with a vortex for 2 min and leaving the mixture to stand for 24 h. The emulsification activity was calculated as the percentage of the height of the emulsified layer (mm) divided by the total height of the liquid column (mm). Measurement of the bacterial adhesion to hydrocarbon was performed as described by Pruthi and Cameotra.19
Molecular identification of selected phenol-degrading yeasts strains Analysis of 18S rRNA was performed for the taxonomic characterization of isolated strains. Total genomic DNA was isolated from 20 mL of late-exponential-phase cells using the CTAB miniprep protocol for bacterial genomic DNA preparations.20 PCR amplification of 18S rRNA genes was obtained using the general eukaryotic primers EukA (5-AACCTGGTTGATCCTGCCAGT-3) and EukB (5-TGATCCTTCTGCAGGTTCACCTAC-3).21 The amplification reaction was performed in a total volume of 50 L. It consisted of 50 of template, 1× solution Q (Qiagen, Hilden, Germany), 1× Qiagen reaction buffer, 1 M of each forward and reverse primer, 10 M dNTPs (Gibco, Invitrogen Co., Carlsbad, CA), and 2.0 mL (and 2.0 U of Qiagen Taq Polymerase (Qiagen). Amplification for 35 cycles was performed in a thermacycler GeneAmp 5700 (PE Applied Biosystems, Foster City, CA, USA). The temperature profile for PCR was kept at 95 ◦ C for 5 min (1 cycle), 94 ◦ C for 1 min, 50 ◦ C for 1 min, and 72 ◦ C for 2 min (35 cycles); this was followed by the temperature of 72 ◦ C for 10 min at the end of final cycle. The 18S rRNA amplified was sequenced with a BigDye Terminator v3.1 cycle sequencing kit on an automated capillary sequencer (model 3100 Avant Genetic Analyzer, Applied Biosystems). Analyses of the 18S rRNA gene sequences were performed as previously described by Yakimov et al.22 SIMILARITY RANK from the Ribosomal Database Project (RDP)23 and FASTA Nucleotide Database Query,24 as available through the EMBL-European Bioinformatics Institute, were used to determine partial 18S rRNA sequences and estimate the degree of similarity to other 18S rRNA gene sequences.
Results The quantity of heterotrophic and phenol degrader yeast in the collected samples The quantity of heterotrophic and phenol degrader yeast was determined in wastewater and soil samples. The results are shown in Tables 1 and 2. As shown in these tables, soil samples
Table 1 – Enumeration of heterotrophic and phenol degrader yeast in collected wastewater samples from coking plant of Zarand at Kerman. Wastewater
1 2 3
Quantity of phenol degrader yeast (cfu mL−1 ) 0 17 × 104 50 × 104
Quantity of heterotrophic yeast (cfu mL−1 ) 1 × 10⁵ 28 × 105 1 × 10⁴
Table 2 – Enumeration of heterotrophic and degrading yeasts in collected soil samples from coking plant of Zarand at Kerman. Soil samples
1 2 3
Quantity of phenol degrader yeast (cfu mL−1 ) 6 × 10⁵ 40 × 105 55 × 105
Quantity of heterotrophic yeast (cfu mL−1 ) 50 × 105 6 × 10⁵ 15 × 105
Table 3 – Growth rate and phenol biodegradation by phenol degrading yeast. Isolate yeast strain K1 K2 K3 K4 K5 K6 K7 K8 K9 K10 K11 K12
Growth (O.D. at 600 nm) 0.633 1.674 0.308 0.343 0.315 0.344 1.509 0.241 0.240 0.128 0.509 0.300
The percentage of phenol biodegradation (%) 87 91 52 57 28 48 79 42 38 32 95 54
has a larger number of phenol degrader yeasts in comparison to wastewater samples. All collected samples had phenol degrader, except one wastewater sample (sample No. 1) that had no yeast; this could be attributed to the high toxicity of xenobiotic compounds in this wastewater sample. The highest quantity for phenol degrader yeast was related to soil sample No.3 (50 × 104 CFU mL−1 ).
Isolation and characterization of phenol degrading yeasts Twelve phenol degrader yeasts were isolated from the collected soil and wastewater samples. Growth rate and the percentage of phenol degradation were measured for each isolated yeast. The results are shown in Table 3. As can be seen, the K1, K2, K7 and K11 had the highest growth rate in the presence of phenol as the only energy and carbon source. Also these strains had high percentage of phenol degradation. The strain K11 had the highest phenol degradation among four selected yeast strains.
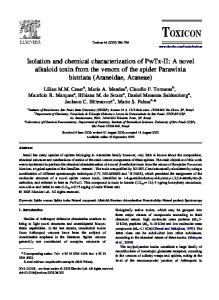
The effect of different concentrations of phenol on the growth rate of the selected yeast strains The effect of different phenol concentrations (50 mg L−1 ), (125 mg L−1 ), (200 mg L−1 ) and (275 mg L−1 ), on the growth rate of selected yeast strains was investigated. The results are illustrated in Fig. 1. As shown, yeasts growth followed an increment pattern until 0.05 g L−1 concentration; then the growth rate was reduced and this reduction was continued to 0.2 g L−1 concentration and the minimum growth appeared
21
b r a z i l i a n j o u r n a l o f m i c r o b i o l o g y 4 7 (2 0 1 6) 18–24
Phenol biodegradation by the selected yeast strains in different concentrations of phenol
1.8 1.6
O.D 600 nm
1.4 K2 K7 K11 K1
1.2 1 0.8 0.6 0.4 0.2 0 0
100
200
300
400
Phenol concentration (mgl-1) Fig. 1 – The effect of different concentrations of phenol on the growth of selected yeast strains.
0.275 g L−1
in concentration. As shown in the Fig. 1, three patterns could be seen in the growth of the selected isolated yeast. The first pattern was related to strain K2, which had the best growth in 0.05 g L−1 concentrations; however, when the concentration of phenol was increased, the growth of yeast was considerably reduced. The second growth pattern was related to the strain K7 and K1, which showed the maximum growth in 0.05 g L−1 concentration. In this model, an impalpable decrease of growth was seen when the concentration of phenol was increased; thus, the increase of phenol concentration had little impact on the growth. The third pattern was related to the strain K11, which had the maximum growth in 0.05 g L−1 concentrations; however, the growth of strain K11 was decreased in the high concentration of phenol; this was like the pattern observed in strain K2, but the slope was not steep decline, as in the case the strain K2. Overall, it could be concluded that by the increase in phenol concentration, the growth rate of yeast strains was decreased.
The effect of the selected yeast strains on the biodegradation of phenol in the increased concentration of phenol was studied. The results are shown in Fig. 2. As can be seen, the strain K11 had the highest phenol degradation (95%) among all selected yeast strains. However, this strain had low efficacy for the biodegradation of phenol in higher concentrations. The strain K2 had 91% degradation of phenol in 125 mg L−1 concentration; also, this strain removed 42% of phenol at 200 mg L−1 , but, similar to strain K11, higher concentrations of phenol were not degraded by this strain. The overall pattern emerging in all four yeasts was that with increasing the concentration of phenol, biodegradation rate of phenol was decreased.
Emulsification activity (E24%) and BATH in the isolated yeasts The emulsification activity and bacterial adhesion to hydrocarbons (BATH) were examined for all isolated yeasts for the selected prevalent strains. The results for these two tests are shown in Table 4. As can be seen, the selected isolated yeast strains had good emulsification and hydrophobicity. The best emulsification activity was related to strain K11, but the best hydrophobicity was seen in the strain K1. Totally, there was a direct relationship between emulsification activity and phenol biodegradation. This was because the yeast having high emulsification activity could act better in phenol biodegradation.
Molecular identification of prevalent phenol-degrading yeast strains Molecular identification of the isolates was performed by amplifying and sequencing the 18S rRNA gene sequences
100 90
Phenol biodegradation (%)
80 70 60 K11 50
K2 K7
40
K1 30 20 10 0 50
125
200
275
Concentration of phenol mgl-1 Fig. 2 – Phenol biodegradation by selected yeast strains in various concentrations of phenol.
22
b r a z i l i a n j o u r n a l o f m i c r o b i o l o g y 4 7 (2 0 1 6) 18–24
are introduced. Chandran and Das25 isolated five species of yeasts including Cryptococcus laurentii, C. tropicalis, Rhodotorula mucilaginosa, Trichosporon asahii and Candida rugosa from hydrocarbon-contaminated soil.25 Jarboui et al.12 isolated R. mucilaginosa from olive mill wastewater in Tunisia.12 Karakaya et al.26 isolated R. mucilaginosa from olive mill wastewater in Turkey.26 In this study, phenol degrading yeasts were isolated from soil and wastewater of the cocking plant from Zarand, Kerman, with the condition of this ecosystem being consistent with ecosystems selected by other researchers. For the identification of phenol degrading yeasts, many methods such as those based on biochemical tests and also, molecular methods based on 18S rRNA gene sequencing have been used. Liu et al.27 identified Trichosporon montevideense PHB5 by DNA sequencing from soil samples oilfield in China.27 Bleve et al.28 isolated 300 species of yeast from olive mill wastewater in Italy and identified them with molecular methods. These yeasts belonged to the species of Rhodotorula, Pichia, Geotrichum, Saccharomyces and Candida. Hassanshahian et al.16 identified two Y. lipolytica strains PG-20 and PG-32 by 18S rRNA sequencing, as isolated from Persian Gulf.16 Jarboui et al.12 identified the yeast R. mucilaginosa as a phenol degrader isolated from Tunisia olive mill wastewater.12 In this study, four phenol degrader yeast strains were isolated from wastewater and soil samples of a coking plant from Zarand, Kerman. These isolated strains belonged to these genera: C. tropicalis strain K1; P. guilliermondii strain K2; M. guilliermondii strain K7 and C. tropicalis strain K11. These isolated genera were in agreement with the results obtained by other researchers.
Table 4 – Emulsification activity and percentage of cell surface hydrophobicity of isolated yeast strains. Yeast strain
K1 K2 K3 K4 K5 K6 K7 K8 K9 K10 K11
BATH (%)
Emulsification activity (E24%)
74 70 8 18 0 0 66 0 0 0 68
48.5 27.2 13.6 9 16.3 18 36.6 18 36 8 63
and comparing them to the database of known 18S rRNA sequences. The results of the identification procedure showed that four isolated yeasts belonged to C. tropicalis strain K1, Pichia guilliermondii strain K2, Meyerozyma guilliermondii strain K7 and C. tropicalis strain K11. All sequences of four yeasts were submitted to the Genetic Sequence Database at the National Center for Biotechnical Information (NCBI). The gene bank IDs of these strains in NCBI are HG798647, HG798648, HG798649 and HG798650. The phylogenic trees of these four isolated strains are illustrated in Fig. 3.
Discussion In a recent review, several yeast strains that can utilize aromatic hydrocarbons as the sources of carbon and energy Candida tropicalis strain HK10b (EF432577.1) Candida tropicalis strain HK32 (EF413003.1)
100 Candida tropicalis strain IY03-5-26-4 (EF120592.1) Candida tropicalis strain HK10b (EF432577.1) Candida tropicalis strain LBB (EF428132.1) Candida tropicalis strain zhuan143 1 (EF408242.1) Candida tropicalis strain K1 (HG798647) Candida tropicalis strain K11 (HG798650)
100 98 45
Pichia guilliermondii strain K2 (HG798648) Meyerozyma guilliermondii strain K7 (HG798649)
Pichia guilliermondii strain W2 (DQ821711.1) Meyerozyma guilliermondii strain SW236 (KC178873.1)
100 Meyerozyma guilliermondii strain NRRL (JQ698913.1) Pichia guilliermondii strain JHSd (DQ534403.1)
61
Pichia guilliermondii strain gao1zhong2 (EF532297.1) Pichia guilliermondii strain HJM (EF194890.1)
0.002 Fig. 3 – Phylogenetic tree of 18S rRNA sequences of the yeast isolates obtained from Persian Gulf. The tree was constructed using sequences of comparable region of the 18S rRNA gene sequences available in public databases. Neighbor-joining analysis using 1000 bootstrap replicates was used to infer tree topology. The bar represents 0.002% sequence divergence. Sequenced data showing the location of isolated yeast strains.
b r a z i l i a n j o u r n a l o f m i c r o b i o l o g y 4 7 (2 0 1 6) 18–24
The effect of different phenol concentrations on the growth of yeast strains showed that when the concentration of phenol was increased, the rate of degradation was decreased. Varma and Gaikwad29 studied the degradation of phenol (200 mg L−1 ) by C. tropicalis strain NCIM 3556, showing that this strain, in 16 h, reached the maximum degradation (96.28%) and after 48 h, the degradation was almost completed (99.88%).29 Kaczorek et al.30 concluded that the yeast strains of Candida and Yarrowia could degrade hydrocarbon (67–68%) without the addition of any surfactant.30 Wang et al.31 showed that increase in the concentration of phenol for C. tropicalis strain JH8 up to 200 mg L−1 caused complete degradation by this strain within 72 h.10 Liu et al.27 concluded that the yeast T. montevideense strain PHE1 well tolerated the toxicity of phenol concentrations above 2500 mg L−1 .27 In this research, the effect of different concentrations of phenol on the growth rate of yeast strains was studied. Three different patterns for maximum phenol degradation by yeast were observed. As in strain K2, when the concentration of phenol was increased, the yeast growth was decreased dramatically. This could be attributed to the toxicity of phenol for this strain. In the second model (strain K7), with increasing the concentration of phenol, the reduction of yeast growth was observed. In the third pattern, the growth was decreased when the concentration of phenol was increased and accommodation was not like the second pattern. The general principle of reducing growth with increasing the concentration of phenol can be seen in the current study. It has been pointed out by other researchers, and our results are also consistent with the results obtained by other researchers. Hassanshahian et al.15 found that two yeasts of Y. lipolytica strains PG-20 and PG-32 had high cell surface hydrophobicity and could dramatically reduce the surface tension. In addition, these strains had the sufficient level for emulsification activity based on hydrocarbon substrates.16 Amaral et al.32 Studied the emulsification activity of a wild Brazilian Y. lipolytica and found this strain had high level of emulsification activity in pH = 3–5.32 Hasanshahian and Emtiazi33–36 described a direct correlation between cell surface hydrophobicity and the degradation of alkanes in crude oil degrading bacteria isolated from the Persian Gulf.33 Kaczorek et al.30 described a relationship between cell surface hydrophobicity of Candida maltose and hydrocarbon degradation.30,37–40 In the present research, cell surface hydrophobicity and emulsification activity of phenol degrading yeasts showed that the yeasts with more cell surface hydrophobicity also had higher phenol degradation capability. On the other hand, these yeasts had more emulsification activity. To conclude, the results of this study showed a direct correlation between cell surface hydrophobicity and emulsification activity, similar to other studies. By using these phenol degrader yeast strains in the wastewater of the coking plant in Zarand, Kerman, it would be possible to decrease phenol contamination in this factory.
Conflicts of interest The authors declare no conflicts of interest.
23
references
1. Chung TP, Tseng HY, Juang RS. Mass transfer effect and intermediate detection for phenol degradation in immobilized Pseudomonas putida systems. Process Biochem. 2003;38:1497–1507. 2. Kibret M, Somitsch W, Robra KH. Characterization of a phenol degrading mixed population by enzyme assay. Water Res. 2000;4:1127–1134. 3. Kumar A, Kumar S, Kumar S. Biodegradation kinetics of phenol and catechol using Pseudomonas putida MTCC 1194. Biochem Eng J. 2005;22:151–159. 4. Godjevargova T, Ivanova D, Alexieva z, Dimova N. Biodegradation of toxic organic components from industrial phenol production wastewater by free and immobilized trichosporon cutaneum R57. Process Biochem. 2003;38: 915–920. 5. Topalova Y, Dimkov R, Ivanov I, Sergieva S, Arsov R. Ortho-nitrophenol removal in two types activated sludge: the role of microbiologycal and enzymological adaptation. Biotechnol Biotechnol. 1992;12:91–95. 6. Zlatka A, Maria G, Plamena Z, Nadejda P. Comparison of growth kinetics and phenol metabolizing enzymes of Trichosporon cutaneum R57 and mutants with modified degradation abilities. Enzyme Microb. 2004;34:242–247. 7. Hinteregger C, Leitner R, Loidl M, Ferschl A, Streichsbier F. Degradation of phenol and phenolic compounds by Pseudomonas putida EKII. Appl Microbiol Biotechnol. 1992;37:252–259. 8. Leonard D, Lindley N. Growth of Ralstonia eutropha on inhibitory concentrations of phenol: diminished growth can be attributed to hydrophobic perturbation of phenol hydroxylase activity. Enzyme Microb Technol. 1999;25:271–277. 9. Piakong MT, Noor Aini AB, Madihah MS. Degradation pathway of phenol through ortho-claevage by Candida tropicalis Rrtl-Cr1. Borneo Sci. 2009;24:1–8. 10. Roper DI, Stringfellow JM, Cooper RA. Sequence of the hpcC and hpcG genes of the meta-fission homoproto catechuic acid pathway of Escherichia coli C: nearly 40% amino acid identity with the analogous enzymes of the catechol pathway. Gene. 1995;156:47–51. 11. Heesche-Wagner K, Schwarz T, Kaufmann M. Phenol degradation by an enterobacterium: a Klebsiella strain carries a TOL-like plasmid and a gene encoding a novel phenol hydroxylase. Can J Microbiol. 1999;45:162–171. 12. Jarboui R, Baati H, Fetoui F, Gargouri A, Gharsallah N, Ammar E. Yeast performance in wastewater treatment: case study of Rhodotorula mucilaginosa. Environ Technol. 2012;33:951–960. 13. Basak B, Bhunia B, Dutta S, Dey A. Enhanced biodegradation of 4-chlorophenol by Candida tropicalis PHB5 via optimization of physicochemical parameters using Taguchi orthogonal array approach. Int Biodeter Biodegr. 2013;78:17–23. 14. Phalgune UD, Rajamohanan PR, Gaikwad BG, Varma RJ, George S. Biodegradation of phenol by the yeast Candida tropicalis: an investigation by NMR spectroscopy. Biochem Biotechnol. 2013;69:2029–2037. 15. Hassanshahian M, Emtiazi G, Cappello S. Isolation and characterization of crude-oil-degrading bacteria from the Persian Gulf and the Caspian Sea. Mar Pollut Bull. 2012;64:7–12. 16. Hassanshahian M, Tebyanian H, Cappello S. Isolation and characterization of two crude oil-degrading yeast strains, Yarrowia lipolytica PG-20 and PG-32, from the Persian Gulf. Mar Pollut Bull. 2012;64:1386–1391. 17. Chandran P, Das N. Role of sophorolipid biosurfactant in degradation of diesel oil by Candida tropicalis. Bioremed. 2012;16:19–30.
24
b r a z i l i a n j o u r n a l o f m i c r o b i o l o g y 4 7 (2 0 1 6) 18–24
18. Quintana MG, Didion C, Dalton H. Colorimetric method for a rapid detection of oxygenated aromatic biotransformation products. Biotechnol Tech. 1997;11:585–587. 19. Pruthi V, Cameotra SS. Rapid identification of biosurfactant-producing bacterial strains using a cell surface hydrophobicity technique. Biotechnol Tech. 1997;11:671–674. 20. Wilson K. Preparation of Genomic DNA from Bacteria. Current Protocols in Molecular Biology. New York: Wiley; 1987. 21. Petroni G, Dini F, Verni F, Rosati G. A molecular approach to the tangled underlying phylogeny in Euuplotes (Ciliophora, Spirotrichea). Mol Phylogenet. 2002;22:118–130. 22. Yakimov MM, Cappello S, Crisafi E, Tursi A, Savini A, Corselli C, et al. Phylogenetic survey of metabolically active microbial communities associated with the deep-sea coral Lophelia pertusa from the Apulian Plateau, Central Mediterran Sea. Deep-Sea Res. 2006;53:62–75. 23. Maidak BL, Olsen GJ, Larsen N, Overbeek R, McCaughey MJ, Woese CR. The RDP (ribosomal database project). Nucleic Acids Res. 1997;25:109–111. 24. Pearson WR, Lipman DJ. Improved tools for biological sequence comparison. Proc Natl Acad Sci U S A. 1988;85:2444–2448. 25. Chandran P, Das N. Role of plasmid in diesel oil degradation by yeast species isolated from petroleum hydrocarbon-contaminated soil. Environ Technol. 2012;33:645–652. 26. Karakaya A, Laleli Y, Takac¸ S. Development of process conditions for biodegradation of raw olive mill wastewater by Rhodotorula glutinis. Int Biodeter Biodegr. 2012;75:75–82. 27. Liu H, Yu QJ, Wang G, Ye F, Cong Y. Biodegradation of phenol at high concentration by a novel yeast Trichosporon montevideense PHE1. Process Biochem. 2011;46:1678–1681. 28. Bleve G, Lezzi C, Chiriatti MA, D’Ostuni I, Tristezza M, Di Venere D, et al. Selection of non-conventional yeasts and their use in immobilized form for the bioremediation of olive oil mill wastewaters. Bioresour Technol. 2011;102: 982–989. 29. Varma RJ, Gaikwad BG. Rapid and high biodegradation of phenols catalyzed by Candida tropicalis NCIM 3556 cells. Enzyme Microb Technol. 2008;43:2358–2367. 30. Kaczorek E, Chrzanowski L, Pijanowska A, Olszanowski A. Yeast and bacteria cell hydrophobicity and hydrocarbon biodegradation in the presence of natural surfactants:
31.
32.
33.
34.
35.
36.
37.
38.
39.
40.
rhamnolipides and saponins. Bioresour Technol. 2008;99:4285–4291. Wang L, Lin Y, Yang L, Yu P, Xie Z, Luo Y. Candida tropicalis: characterization of a strain capable of degrading high concentrations of phenol. Biotechnol Lett. 2011;33:943–946. Amaral P, da Silva JM, Lehocky M, Barros-Timmons AMV, Coelho MAZ, Marrucho IM, et al. Production and characterization of a bioemulsifier from Yarrowia lipolytica. Process Biochem. 2006;41:1894–1898. Hasanshahian M, Emtiazi G. Investigation of alkane biodegradation using the microtiter plate method and correlation between biofilm formation, biosurfactant productionand crude oil biodegradation. Int Biodeter Biodegr. 2008;62:170–178. Hassanshahian M, Ahmadinejad M, Tebyanian H, Kariminik A. Isolation and characterization of alkane degrading bacteria from petroleum reservoir waste water in Iran (Kerman and Tehran provenances). Mar Pollut Bull. 2013;73:300–305. Hassanshahian M, Emtiazi G, Caruso G, Cappello S. Bioremediation (bioaugmentation/biostimulation) trials of oil polluted seawater: a mesocosm simulation study. Mar Environ Res. 2014;95:28–38. Hassanshahian M, Zeynalipour MS, Hosseinzadeh Musa F. Isolation and characterization of crude oil degrading bacteria from the Persian Gulf (Khorramshahr provenance). Mar Pollut Bull. 2014;82:39–44. Hassanshahian M, Yakimov MM, Denaro R, Genovese M, Cappello S. Using Real-Time PCR to assess changes in the crude oil degrading microbial community in contaminated seawater mesocosms. Inte Biodeterior Biodegrad. 2014;93:241–248. Hassanshahian M. Isolation and characterization of biosurfactant producing bacteria from Persian Gulf (Bushehr provenance). Mar Pollut Bull. 2014;86:361–366. Tebyanian H, Hassanshahian M, Kariminik A. Hexadecane-degradation by Teskumurella and Stenotrophomonas strains iso lated from hydrocarbon contaminated soils. Jundishapur J Microbiol. 2013;26:e9182. Hassanshahian M, Emtiazi G, Kermanshahi R, Cappello S. Comparison of oil degrading microbial communities in sediments from the Persian Gulf and Caspian Sea. Soil Sediment Contam. 2010;19:277–291.