Global Ecology and Biogeography, (Global Ecol. Biogeogr.) (2006) 15, 614–624 Blackwell Publishing Ltd
RESEARCH PAPER
Is the Rapoport effect widespread? Null models revisited Carla R. Ribas1,2 and José H. Schoereder2*
1
Programa de Pós-Graduação em Entomologia, Departamento de Biologia Animal, Universidade Federal de Viçosa, Viçosa — MG, 36570-000, Brazil and 2Departamento de Biologia Geral, Universidade Federal de Viçosa, Viçosa — MG, 36570-000, Brazil. E-mail:
[email protected]
ABSTRACT
Aim To test the Rapoport effect using null models and data sets taken from the literature. We propose an improvement on an existing method, testing the Rapoport effect in elevational and latitudinal distributions when distributions are restricted by sampling. Location Global. Methods First, we hypothesized that real range size distributions are similar to those expected by null assumptions (expected by only imposing boundaries to species distributions). When these distributions were different from those expected under the null assumptions, we tested the hypothesis that these distributions correspond to those expected when a Rapoport effect occurs. We used two simulation methods, random and pseudo-random, which differed only in that the latter one assumes fixed species mid-points, coinciding with real mid-points. Observed correlations between range size and mid-point were compared with the frequency distribution of 1000 simulations, using both simulation methods. We compared the correlation curves generated by 1000 simulations with those of the observed distributions, testing whether correlations indicated a Rapoport effect. Results Several significant patterns of correlations between range size and mid-point were observed in the data sets when compared with random and pseudo-random simulations. However, few of these correlations were consistent with a Rapoport effect. Main conclusions Although some recent studies are consistent with a Rapoport effect, our results suggest that the Rapoport effect is not a widespread pattern in global ecology.
*Correspondence: José H. Schoereder, Departamento de Biologia Geral, Universidade Federal de Viçosa, Viçosa — MG, 36570-000, Brazil. E-mail:
[email protected]
Keywords Altitude, biogeography, distribution, latitude, macroecology, meta-analysis, mid-domain effect, null models, Rapoport effect, range size.
INTRODUCTION Rapoport’s rule (Stevens, 1989) suggests that the size of species distributions (hereafter, range size) increases from the equator to the poles. Following the same reasoning, Stevens (1992) extended Rapoport’s rule to elevational gradients in which there would be a positive relationship between range size and altitude. Many mechanisms have been proposed to account for this controversial pattern; the possible explanations for Rapoport’s rule are beyond the scope of this paper (more details can be found in Folgarait et al., 2005; Hernández Fernández & Vrba, 2005a; Parmesan et al., 2005).
614
Several authors have noticed the coincident patterns of Rapoport’s rule and the gradient in species richness and have looked for a causal relationship between these patterns, but results are still inconclusive (Rohde & Heap, 1996; Rohde, 1996; Fleishman et al., 1998; Kolasa et al., 1998; Taylor & Gaines, 1999; Smith & Gaines, 2003). Willig et al. (2003) reported that some taxa exhibited a marked latitudinal gradient of richness without showing Rapoport’s rule, concluding that this hypothesis did not explain well the gradient of species richness. Nonetheless, several studies have documented cases of Rapoport’s rule (e.g. Stevens, 1992; Fleishman et al., 1998; Harcourt, 2000; Cardillo, 2002; Sanders, 2002; Fortes & Absalão,
DOI: 10.1111/j.1466-822x.2006.00265.x © 2006 The Authors Journal compilation © 2006 Blackwell Publishing Ltd www.blackwellpublishing.com/geb
Rapoport effect revisited 2004; and see Gaston, 2003 for an extensive review of the groups that have been studied). However, Blackburn and Gaston (1996) reported that Rapoport’s rule might not be general, because it has been described mostly in the Northern Hemisphere, and they suggested the term Rapoport effect as being more suitable. Different methodologies have been used to test the relationship between range size and latitude or altitude. Stevens’ method (1989) consists of dividing the area considered into latitudinal bands, and then calculating and regressing the average latitudinal range size of all species occurring in each band against latitude. This method creates a statistical difficulty because it includes the same species several times, generating non-independent data (Rohde et al., 1993). Rohde’s mid-point method (following Rohde et al., 1993) relates range extent to the mid-point of each species’ range. Pagel et al. (1991) suggested the most distal point method, which categorizes a species by the latitude within its range that is farthest from the equator, and then range size is regressed against the most distal latitude within that range. The use of different methodologies to test the Rapoport effect and the lack of such relationships in the Southern Hemisphere (Gaston et al., 1998; Reed, 2003; Hernández et al., 2005) and in some taxa (Rohde et al., 1993) has prevented clarification of the importance of Rapoport rule as a general pattern of species distribution. Nathan and Werner (1999) suggested that a more critical and formal method, which does not suffer from statistical biases, is currently needed. Ashton (2001) recommended that meta-analytical techniques would be particularly useful for assessing the generality of ecological patterns, such as the Rapoport effect. Lyons and Willig (1997) suggested a method to test the Rapoport effect based on range size distributions limited by geographical boundaries. Colwell and Hurtt (1994) had already predicted that range extents should increase towards the centre of domains, and that small ranges could be located closer to domain boundaries. Lyons and Willig’s (1997) method compares observed relationships between range extent and mid-point with those expected from null models. Recently, a new perspective to test for gradients in species richness came from literature on the mid-domain effect (Colwell & Hurtt, 1994; Colwell et al., 2004; Arita, 2005; Mora & Robertson, 2005; but see Zapata et al., 2003), in which a peak in species richness is expected in the centre of a domain based upon randomly superimposing ranges within this domain. The species richness peak is expected to occur independently of biological mechanisms. Mid-domain models predict that not only will more ranges pile up in the centre of a domain, but that range sizes will be larger in the centre of a domain as a function of geometric constraints. In this paper we propose an improvement to the method of Lyons and Willig (1997), allowing a test for Rapoport effects both in elevational and latitudinal distributions, even when distributions are restricted by sampling. First, we hypothesize that range size distributions are similar to those expected by imposing boundaries to these distributions (null distribution). When these distributions are different from those expected under null assumptions, we test the hypothesis that these distributions correspond to those expected under a Rapoport effect.
MATERIALS AND METHODS Data sets We used distributional data from 39 studies (Table 1). Some papers contained distributional data for more than one taxon resulting in a total of 55 data sets being examined. We selected the papers using the keywords ‘Rapoport’, ‘distribution’, ‘latitude’, ‘altitude’ and ‘range size’ in the ISI Web of Knowledge (http://isi02.isiknowledge.com/portal.cgi). We chose the studies selecting those that contained species distributions relating to latitude or altitude. This group of papers describes the distribution of several taxa, in the Northern and/or Southern Hemispheres, independent of including tests of the Rapoport effect. Latitudinal distributions — expected null correlations Following Lyons and Willig (1997), the first step in analysing latitudinal distributions was to describe the expected correlation between range size and mid-latitude. Stevens (1989) and Rohde et al. (1993) expected a positive correlation between range size and a latitudinal descriptor, but Lyons and Willig (1997) demonstrated an inverse correlation among these variables because the ends of northern and southern continents (hard boundaries) impose a constraint such that ranges become smaller when one moves to higher latitudes in both directions (see Fig. 1 in Lyons & Willig, 1997). At lower latitudes, larger ranges might occur due to the lack of boundaries that restrict the extent of the ranges. We used mid-point instead of the most
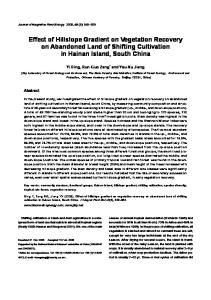
Figure 1 Lower drawings represent the expected relationship between range sizes (lines) and mid-latitude (circles) in two possible cases of species distribution (upper drawings). On the left side, a distribution that does not cross the equator (0°) produces a unimodal expected relationship between the variables because increasing or decreasing the latitude from the mid-point of the distribution decreases range sizes. On the right side, a linear correlation is expected because the distribution crosses the equator, and the increase in latitude corresponds to a decrease in range sizes.
© 2006 The Authors Global Ecology and Biogeography, 15, 614– 624, Journal compilation © 2006 Blackwell Publishing Ltd
615
C. R. Ribas and J. H. Schoereder Table 1 Data used in the analyses of the Rapoport effect, and number of taxa distributions described (Distributions used). Some authors have analysed the Rapoport effect (Fleishman et al., 1998; Rohde, 1999; Harcourt, 2000; McCain, 2003). From these, McCain (2003) did not find a Rapoport effect, Rohde (1999) found a reverse Rapoport effect and the other two papers described Rapoport effects Authors
Gradient
Taxa
Distributions used
Range limits
Adolfo and Navarro (1992) Alexander and Hilliard Jr. (1969) Araújo and Fernandes (2003) Beaumont and Hughes (2002) Clausnitzer and Kityo (2001) Fisher (1996) Fisher (1998)
Altitude Altitude Altitude Latitude Altitude Altitude Altitude
Birds Orthoptera Ants Butterflies Rodents Ants Ants
1 1 1 1 1 1 2
Fisher (1999) Fleishman et al. (1998) Gagné (1979) Gathorne-Hardy et al. (2001)
Altitude Altitude Altitude Altitude Altitude Latitude Latitude Altitude Altitude
Ants Butterflies Arthropods Termites Ants
1 1 1 1 4
Primates Birds Mammals
1 1 3
680 – 3100 m 1530 – 4265 m 800 – 1500 m 9.6 –43.6° 2875 – 4120 m 785 – 2000 m 25 – 1015 m 875 –1985 m 430 – 1250 m 1900 – 3260 m 15 – 2400 m 20 – 1400 m 1– 543 m 42 –44.95° 21° S − 41° N 20 – 2200 m 1100 – 2700 m 475 –1750 m 300 –950 m 900 –2000 m 75 – 1200 m 1100 –1720 m 550 – 1950 m 0 – 2050 m 12.5 –25° 1900 – 3300 m 19 – 45° 0 – 1800 m 700 – 3200 m 10.7– 43.07° 27–63.27° 25 – 51° 37.53 –46.43° 100 – 2800 m 300 –2800 m 44.12 – 69.47° 0 – 2060 m 1220 – 3745 m 300 – 1850 m 45° S − 45.8° N 250 – 1750 m 720 – 2450 m 750 –2950 m 750 –2650 m 900 –2500 m 500 – 2900 m 66 – 2667 m 1100 – 5200 m 34.43 –77° 1000 – 4130 m
Gotelli and Ellison (2002) Harcourt (2000) Hawkins (1999) Heaney (2001)
Hofer et al. (1999) Hortal-Muñoz et al. (2000) Hosoda (1999) Kikuta et al. (1997)
Amphibians and reptiles Beetles Beetles Beetles Butterflies
2 1 1 1 2
Lees et al. (1999) Lobo and Halffter (2000) McCain (2003) McCain (2004) Md. Nor (2001) Moles and Westoby (2003)
Altitude Altitude Altitude Altitude Altitude Latitude Altitude Latitude Altitude Altitude Latitude
Beetles Rodents Mammals Mammals Plants
1 1 1 1 4
Nathan and Werner (1999)
Altitude
Reptiles and birds
2
OchociNska and Taylor (2003) Poulsen and Lambert (2000) Rickart (2001) Robertson (2002) Rohde (1999) Samson et al. (1997) Sánchez-Cordero (2001)
Latitude Altitude Altitude Altitude Latitude Altitude Altitude
Shrews Birds Mammals Ants Scombrids Ants Rodents and bats
Sanders et al. (2003) Sfenthourakis (1992) Shepherd and Kelt (1999) Sklenár and Jørgensen (1999) Stephenson et al. (2000) Wolf (1993)
Altitude Altitude Altitude Altitude Latitude Altitude
Ants Oniscidea Mammals Plants Myxomycetes Bryophytes and lichens
1 1 1 1 1 1 2 1 1 1 1 1 1 1 2
distal point because its use eases the detection of deterministic patterns in range sizes (Lyons & Willig, 1997). We expected a negative correlation between range size and midlatitude when there are hard boundaries limiting distributions
616
and when ranges encompass an entire continent, including zero latitude and extending to north and south latitudes. In our data, these criteria are matched by the data from Rohde (1999) and Harcourt (2000).
© 2006 The Authors Global Ecology and Biogeography, 15, 614–624, Journal compilation © 2006 Blackwell Publishing Ltd
Rapoport effect revisited Lyons and Willig (1997), however, did not account for distributions that are limited because sampling was carried out in a latitudinal extent smaller than the real distributions of species studied. In that case, there are no true hard boundaries present. The boundaries define an arbitrary domain (sensu Colwell et al., 2004) and they are the highest and the lowest latitudes at which sampling was carried out (Fig. 1). In these cases, using mid-point as a latitudinal descriptor, we expected smaller ranges close to the limits of the sampled area and larger ranges in the centre of the sampled area independent of latitude. The expected null correlation between range size and mid-point in these data, considering only sampling boundaries, was quadratic with a peak in range sizes at intermediate sampling latitudes. All data sets of latitudinal distributions, except for those of Rohde (1999) and Harcourt (2000), were descriptions of latitudes ranging in a smaller scale than the entire continent and they were analysed using this expected quadratic correlation. Latitudinal distributions — linear correlation analysis We calculated range size and mid-latitude for each species distribution in each data set, and calculated the correlation between these variables using the Pearson product–moment coefficient. We randomized range size and mid-latitude using the two models proposed by Lyons and Willig (1997): random and pseudo-random simulations. Random simulation randomized range size and mid-latitude, and pseudo-random simulation randomized only range sizes, with the mid-points having exactly the same distribution as in the real data. Pseudo-random simulations, therefore, were not completely stochastic because they maintained the empirical mid-points of species distributions. In each model, we randomized the variables 1000 times and calculated the correlation between range size and mid-latitude for each simulation using the Pearson coefficient. As a result, we obtained a frequency distribution of simulated Pearson coefficients (n = 1000). If the observed coefficient was within the 95% limits of frequency distribution of the simulated coefficients, we accepted the null hypothesis that the correlation between range size and mid-point was the same as expected by chance alone (null assumptions assuming hard boundaries). Because this test is two-tailed, we accepted the null hypothesis with P > 0.025. If the observed correlation coefficient was different from that produced by the simulation, we investigated why this difference occurred. There are two possible results: a positive correlation or a negative correlation. If we observed a positive correlation between range size and mid-latitude, this represents smaller range sizes at lower latitudes and larger range sizes at higher latitudes than expected by chance, i.e. a Rapoport effect. If we found a negative correlation, we had to test for the Rapoport effect, because a lower slope than expected by chance means smaller range sizes at lower latitudes and larger range sizes at higher latitudes, i.e. a Rapoport effect. We calculated the slope of correlation for the observed data sets, and for each simulated distribution, generating a frequency distribution of 1000 simulated values. We then compared the observed slope with the frequency distribution of 1000 simulated ones. If the observed
slope was below the 95% limits of frequency distribution, we rejected the null hypothesis and accepted the existence of a Rapoport effect. Latitudinal distributions — quadratic correlation analysis To test if the correlation between range size and mid-latitude was different from that expected under the inclusion of sampling boundaries when the data did not include latitudinal variation extending to north and south latitudes of the equator (Fig. 1), we calculated the correlation coefficient (r) of the following quadratic correlation for each latitudinal distribution data: y = a + bx + cx2 where y is range size, a is the intercept, b and c are equation parameters and x is the mid-latitude. The expected correlation follows a triangular distribution of points because the upper corners represent combinations of mid-points and range that are geometrically impossible (Colwell & Hurtt, 1994). The quadratic model was chosen because it was the simplest model describing a unimodal distribution. We calculated r and parameters a, b and c (Sokal & Rohlf, 1981) for all data sets with distributions restricted by sampling. We then simulated 1000 random and 1000 pseudo-random distributions and for each simulation we calculated the correlation coefficient, obtaining a frequency distribution of 1000 coefficients, comparing each observed correlation coefficient with the 95% frequency distribution. If the observed coefficient was outside the 95% limits of the simulated frequency distribution coefficients we rejected the null hypothesis that the correlation between range size and mid-point was the same as the one expected by chance alone (null assumptions assuming sampling boundaries) and we continued the analyses. If there was a Rapoport effect, we would expect range sizes smaller than expected by chance at low latitudes and higher than expected by chance at high latitudes (Fig. 2). Therefore, to check for the Rapoport effect, we calculated parameters a, b and c (Sokal & Rohlf, 1981) for each of the 1000 simulations in each simulation model (random and pseudo-random) and compared the frequency distribution of 1000 simulated values with that calculated for observed distributions. Elevational distributions — expected null correlations and analysis Stevens (1992) also expected a positive correlation between range size and mid-altitude, but if we consider that bases and tops of mountains are hard boundaries (Colwell & Hurtt, 1994; Rahbek, 1997; Colwell & Lees, 2000; Sanders, 2002) the expected null correlation would also be quadratic with a peak in range sizes at intermediate altitudes (Fig. 3). This is the expected correlation for all our data of elevational distributions. We used the same procedure as the above to test the quadratic correlation in latitudinal distributions.
© 2006 The Authors Global Ecology and Biogeography, 15, 614– 624, Journal compilation © 2006 Blackwell Publishing Ltd
617
C. R. Ribas and J. H. Schoereder
Figure 2 Representation of correlation between range size and mid-point. The solid line represents the expected correlation (EXP) considering the null assumptions. The dashed line represents the correlation under the Rapoport effect (OBS): smaller range sizes in small latitudes/altitudes and larger range sizes in high latitudes / altitudes.
Figure 4 Representation of the correlation between range sizes and mid-latitude expected (EXP) under geometric constraints and that observed (OBS) in actual data analysed (Rohde, 1999; Harcourt, 2000), showing a reverse Rapoport effect. The observed correlation produced larger range sizes at lower latitudes and smaller range sizes at higher latitudes than expected by chance.
the correlations showed range sizes larger than expected by chance at small latitudes and smaller than expected by chance at high latitudes (Fig. 4; Appendices S1 and S2 in Supplementary Material). Because this pattern seems the opposite of that expected from the Rapoport effect, we called it hereafter a reverse Rapoport, even though we have to consider that the real reverse Rapoport would be based on the average range size distributions (Stevens, 1989). In the analysis of the quadratic correlation between range size and mid-latitude, five correlations were significantly different from that expected by chance in the random simulations and one in the pseudo-random simulations. From these, three results were observed: smaller range sizes at the boundaries, a reverse Rapoport and one Rapoport effect (Fig. 5a–c; Appendices S1 and S2 in Supplementary Material). Elevational distributions Figure 3 Representation of range sizes (lines) and mid-altitude (circles). In elevational distributions, defined by two hard boundaries (the bases and tops of mountains), range sizes should be smaller close to these boundaries and larger in the centre of the domain, by chance alone. These constraints produce a unimodal relationship between range size and mid-altitude (right-hand side).
RESULTS Latitudinal distributions The coefficients of linear correlation between range size and mid-latitude were smaller than expected by chance in the two data distributions analysed (Rohde, 1999; Harcourt, 2000) using the two methods of simulation (random and pseudo-random) (see Appendices S1 and S2 in Supplementary Material). However,
618
In the random simulations, 34 correlations were different from expected by chance (Appendix S1 in Supplementary Material) and 10 were similar to that expected by chance. Among the 34 significant correlations, four supported a Rapoport effect (Fig. 5c; Appendix S1 in Supplementary Material). Other results observed were: (1) parameters of the observed curves were significantly equal to those obtained in the simulations (Fig. 5d), (2) larger range sizes occurred at all altitudes (Fig. 5e), (3) smaller range sizes occurred at the boundaries (Fig. 5a), and (4) the reverse Rapoport (Fig. 5b) (Appendix S1 in Supplementary Material). In the pseudo-random simulations, 25 correlations were different from that expected under null assumptions and 17 were similar to that expected by chance (Appendix S2 in Supplementary Material). One was indicative of a Rapoport effect (Fig. 5c), and the other results observed were: (1) parameters of the observed
© 2006 The Authors Global Ecology and Biogeography, 15, 614–624, Journal compilation © 2006 Blackwell Publishing Ltd
Rapoport effect revisited
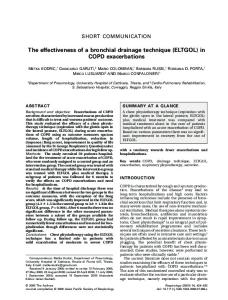
Figure 5 Examples of results found of correlations between range size and mid-point. Dashed lines represent the expected correlations considering the null assumptions. Solid lines represent the observed correlations: (a) smaller range sizes at the boundaries of distribution (Adolfo & Navarro, 1992); (b) reverse Rapoport effect (Samson et al., 1997); (c) Rapoport effect (Gotelli & Ellison, 2002; forest); (d) parameters of the observed curves significantly equal to that obtained in the simulations (Fisher, 1996); (e) larger range sizes (Nathan & Werner, 1999; reptiles); (f) smaller range sizes (Wolf, 1993; lichens); (g) larger range sizes at the boundaries of the distribution (Wolf, 1993; bryophytes); (h) linear correlation (Sklenár & Jørgensen, 1999).
curves were significantly equal to those obtained in the simulations (Fig. 5d), (2) larger range sizes occurred at all altitudes (Fig. 5e), (3) smaller range sizes occurred at all altitudes (Fig. 5f ), (4) smaller range sizes occurred at the boundaries (Fig. 5a), (5) larger range sizes occurred at the boundaries (Fig. 5g), and (6) the reverse Rapoport (Fig. 5b; Appendix S2 in Supplementary Material). The results obtained using random and pseudo-random simulations to all data sets analysed are summarized in Fig. 6. DISCUSSION Few correlations between range size and mid-point were different from those expected under null assumptions, and from these
correlations few are consistent with the Rapoport effect. The five distributions showing a Rapoport effect did not present any coincidence of gradient studied (latitude or altitude), hemisphere (South or North) and taxa. Therefore, even though some distributions did show a Rapoport effect, such an effect cannot be viewed as a general pattern in ecology. The idea that the Rapoport effect is not so widespread is corroborated by the 10 distributions that showed a reverse Rapoport effect, with larger range sizes than expected by chance at lower mid-points, and smaller range sizes than expected by chance at higher mid-points. Some authors (Gaston et al., 1998; Gaston, 2003) have already reported that geographical ranges of tropical species might, on average, be larger than in adjacent temperate regions.
© 2006 The Authors Global Ecology and Biogeography, 15, 614– 624, Journal compilation © 2006 Blackwell Publishing Ltd
619
C. R. Ribas and J. H. Schoereder
Figure 6 Frequency of results obtained in the random (white bars) and pseudo-random (black bars) simulations, including the 55 data sets used: (a) smaller range sizes at the boundaries of distribution; (b) reverse Rapoport effect; (c) Rapoport effect; (d) parameters of the observed curves significantly equal to those obtained in the simulations; (e) larger range sizes; (f) smaller range sizes; (g) larger range sizes at the boundaries of the distribution; (h) non-significant correlations. These results are further detailed in Appendices S1 and S2 in Supplementary Material.
The patterns found in distributions that were significantly different from the simulations could be explained by different biological mechanisms. The mid-point of species distributions may represent optimal conditions or the geographical centre of their evolutionary origin (Lyons & Willig, 1997), assuming nondirectional dispersal movements. If range sizes were smaller than expected under the null assumptions, specialization may be a mechanism restricting species distributions, independent of latitude or altitude. By specialization here we mean every adaptation of individuals that restricts their distribution. These adaptations may be linked to resources, environmental conditions or biological interactions, such as the presence of predators or competitors. Conversely, observed range sizes larger than expected by chance may indicate the absence of specific requirements of resources and environmental conditions. Distributions in which range sizes are smaller than expected by chance only in the boundaries may be explained by truncated species ranges. If species ranges are truncated, the quadratic relationship between mid-point and range size will not hold, especially if ranges are truncated more often at one end of the domain. For example, studies that examine range size in the Southern Hemisphere are biased unless they eliminate those species whose ranges cross into the Northern Hemisphere. In those cases, ranges are more likely to be truncated in the north and ranges will pile up at the northern edge of the domain. In this example, there will be significant deviations from the null model provided here, which are more related to a biased data set than to biology. These significant deviations will always occur when a soft boundary is produced by the arbitrarily defined domain. The data from Sklenár and Jørgensen (1999) produced an interesting result, which is shown in Fig. 5(h). The data show a monotonic decrease of range sizes with mid-altitude, instead of the usual triangular distribution. This may happen because few species occur exclusively at low altitudes, causing the loss of the left-hand side of the triangle. The model we propose captures this linear correlation even when we expected a quadratic relationship by fitting the parameters a, b and c.
620
Null models were first used to test for the Rapoport effect by Lyons and Willig (1997), and then by other authors (Koleff & Gaston, 2001; Diniz-Filho & Tôrres, 2002; Arita et al., 2005; Folgarait et al., 2005; Mora & Robertson, 2005). However, the above authors, except for Mora and Robertson (2005), assumed that the expected distribution considering geometric constraints was the same as in Lyons and Willig (1997). The latter authors analysed the entire American continent from south to north, passing by 0° latitude, and therefore the expected pattern was a negative correlation between range size and mid-latitude (see Fig. 1 in Lyons & Willig, 1997). The other authors, however, sampled in only one hemisphere and, therefore, the geometric constraints in this case were not the borders of the continent but actually the limits of latitudes in which they sampled (see the differences of approach in Fig. 1). Following this reasoning, the expected correlation between range size and mid-latitude would be quadratic with larger range sizes in the middle latitudes of the sampled area and smaller range sizes close to the boundaries of the sampled area. The large number of observed results in the random and pseudo-random simulations suggests that the distribution of range sizes does not show a single pattern (Fig. 6). Null models are tools for verifying the importance of biological mechanisms in ecological patterns because they remove these mechanisms, comparing the results of the model with those obtained in true communities. Pseudo-random simulations add biological information to the model because they include the specific geographical location of each species. The results of random simulations changing to that expected by chance in pseudo-random simulations might be evidence that environmental variables (such as climate or biome distribution) may influence the distribution of organisms (Hernández Fernández & Vrba, 2005a,b). Added to this change, we observed more distribution patterns in pseudo-random (six) than in random (four) simulations (Fig. 6). Because we observed a high proportion of results in which correlations were not significantly different from those obtained under null assumptions (Fig. 6), there would be no need to evaluate biological mechanisms causing the observed patterns
© 2006 The Authors Global Ecology and Biogeography, 15, 614–624, Journal compilation © 2006 Blackwell Publishing Ltd
Rapoport effect revisited in these distributions. However, it is necessary to remember that several biological mechanisms acting on a parameter, for instance range size, may result in a pattern that resembles that expected by chance (Colwell et al., 2004), and is usually called deterministic chaos (Bascompte & Solé, 1995). A different approach, with models incorporating such biological mechanisms and testing the responses of species distributions, is necessary to test such a hypothesis. The random simulations in the present study are identical to mid-domain effect (MDE) models, with a theoretical range size frequency distribution as discussed in Colwell et al. (2004) and Arita (2005). The pseudo-random simulations are essentially MDE mid-point resampling models, even though we used them for a different purpose here. MDE models have been initially suggested to study only one-dimensional distributions, such as those analysed in the present study. More recent studies incorporated longitude in the models (Bokma & Mönkkönen, 2000; Bokma et al., 2001; Hawkins & Diniz-Filho, 2002; Brayard et al., 2005) because species distributions are at least two-dimensional structures. We did not use two-dimensional distributions because the Rapoport effect is usually analysed in one dimension (latitude, elevation or depth). The fact that the simulations of Lyons and Willig (1997) are mid-domain models applied to range size data is not entirely clear in their paper. This is, in part, because their domain crossed the equator and the equator is roughly in the centre of the domain for bats and marsupials. Consequently they could approximate this to a linear relationship by taking the absolute value of latitude. Here, we make the expected parabolic relationship clear and provide a way to evaluate it when the domain does not cross the equator. A parabolic relationship is always expected, but it can be more easily modelled as linear if the equator falls in the centre of the domain. However, there are no fundamental differences among the null model predictions. One case is just more mathematically tractable. We concluded that most statistical methods used up to now to test for the Rapoport effect are not able to distinguish between stochastically and deterministically generated patterns. One of the most important parts of hypothesis testing in science is to make this distinction and to describe expected patterns under null assumptions. In our work, the Rapoport effect was found in few of the gradients analysed. Furthermore, correlation between range size and mid-point was frequently similar to that expected under the null assumptions and, for that reason, there was no need to search for biological mechanisms in these specific correlations. Although some recent studies have found a Rapoport effect (Fortes & Absalão, 2004; Arita et al., 2005; Folgarait et al., 2005), other authors (Rohde et al., 1993; Blackburn & Gaston, 1996; Rohde & Heap, 1996; Rohde, 1996; Ruggiero & Lawton, 1998; Gaston & Chown, 1999; Samyn & Tallon, 2005) claim that Rapoport’s rule is not so widespread as to be considered a pattern in global ecology. ACKNOWLEDGEMENTS We thank Sandra M. Soares for the initial ideas for this paper and for selecting and computing several data. The authors are grateful for the suggestions and comments by Carlos F. Sperber,
Bruno G. Madeira, Frederico S. Neves, Renata B. F. Campos, Tathiana G. Sobrinho, Leandro S. Souto, Julio N. C. Louzada, Paulo De Marco Jr, Ronaldo Reis Jr and Arne Janssen (Visiting Teacher, Scholarship Professor Visitante Estrangeiro from CAPES, Brazil). Tom Romdal, Nicholas Gotelli, Tim Blackburn, José A. F. Diniz-Filho and two anonymous referees made critical contributions to the first draft. Celia and Charles Lancaster, Arne Janssen, David Currie and João A. M. Ferreira revised and corrected the English. Carla R. Ribas is supported by a CAPES grant and José H. Schoereder is supported by a CNPq grant. The British Ecological Society (SEPG), The Nature Conservancy of Brazil, and FAPEMIG supported this work. REFERENCES Adolfo, G. & Navarro, S. (1992) Elevational distribution of birds in the Sierra Madre del Sur, Guerrero, Mexico. The Condor, 94, 29–39. Alexander, G. & Hilliard, J.R. Jr (1969) Elevational and seasonal distribution of Orthoptera in the rocky mountains of northern Colorado. Ecological Monographs, 39, 385–431. Araújo, L.M. & Fernandes, G.W. (2003) Elevational patterns in a tropical ant assemblage and variation in species richness between habitats. Lundiana, 4, 103–109. Arita, H.T. (2005) Range size in mid-domain models of species diversity. Journal of Theoretical Biology, 232, 119–126. Arita, H.T., Rodríguez, P. & Vázquez-Domínguez, E. (2005) Continental and regional ranges of North American mammals: Rapoport’s rule in real and null worlds. Journal of Biogeography, 32, 961–971. Ashton, K.G. (2001) Are ecological and evolutionary rules being dismissed prematurely? Diversity and Distributions, 7, 289–295. Bascompte, J. & Solé, R.V. (1995) Rethinking complexity: modelling spatiotemporal dynamics in ecology. Trends in Ecology & Evolution, 10, 361–366. Beaumont, L.J. & Hughes, L. (2002) Potential changes in the distributions of latitudinally restricted Australian butterfly species in response to climate change. Global Change Biology, 8, 954–971. Blackburn, T.M. & Gaston, K.J. (1996) Spatial patterns in the geographic range sizes of bird species in the New World. Philosophical Transactions of the Royal Society of London Series B, 351, 897–912. Bokma, F. & Mönkkönen, M. (2000) The mid-domain effect and the longitudinal dimension of continents. Trends in Ecology & Evolution, 15, 288–289. Bokma, F., Bokma, J. & Mönkkönen, M. (2001) Random processes and geographic species richness patterns: why so few species in the north? Ecography, 24, 43 –49. Brayard, A., Escarguel, G. & Bucher, H. (2005) Latitudinal gradient of taxonomic richness: combined outcome of temperature and geographic mid-domains effects? Journal of Zoological Systematics and Evolutionary Research, 43, 178–188. Cardillo, M. (2002) The life-history basis of latitudinal diversity gradients: how do species traits vary from the poles to the equator? Journal of Animal Ecology, 71, 79 –87.
© 2006 The Authors Global Ecology and Biogeography, 15, 614– 624, Journal compilation © 2006 Blackwell Publishing Ltd
621
C. R. Ribas and J. H. Schoereder Clausnitzer, V. & Kityo, R. (2001) Elevational distribution of rodents (Muridae and Gliridae) on Mt Elgon, Uganda. Tropical Zoology, 14, 95 –118. Colwell, R.K. & Hurtt, G.C. (1994) Nonbiological gradients in species richness and a spurious Rapoport effect. The American Naturalist, 144, 570 –595. Colwell, R.K. & Lees, D.C. (2000) The mid-domain effect: geometric constraints on the geography of species richness. Trends in Ecology & Evolution, 15, 70 –76. Colwell, R.K., Rahbek, C. & Gotelli, N.J. (2004) The mid-domain effect and species richness patterns: what have we learned so far? The American Naturalist, 163, E1 – E23. Diniz-Filho, J.A.F. & Tôrres, N.M. (2002) Rapoport effect in South American Carnivora (Mammalia): null models under geometric and phylogenetic constraints. Brazilian Journal of Biology, 62, 437–444. Fisher, B.L. (1996) Ant diversity patterns along an elevational gradient in the Réserve Naturelle Intégrale d’Andringitra, Madagascar. Fieldiana Zoology, 85, 93 –108. Fisher, B.L. (1998) Ant diversity patterns along an elevational gradient in the Réserve Spéciale d’Anjanaharibe-Sud and on the western Masoala Peninsula, Madagascar. Fieldiana Zoology, 90, 39–67. Fisher, B.L. (1999) Ant diversity patterns along an elevational gradient in the Réserve Naturelle Intégrale d’Andohahela, Madagascar. Fieldiana Zoology, 94, 129–147. Fleishman, E., Austin, G.T. & Weiss, A.D. (1998) An empirical test of Rapoport’s rule: elevational gradients in montane butterfly communities. Ecology, 79, 2482–2493. Folgarait, P.J., Bruzzone, O., Porter, S.D., Pesquero, M.A. & Gilbert, L.E. (2005) Biogeography and macroecology of phorid flies that attack fire ants in south-eastern Brazil and Argentina. Journal of Biogeography, 32, 353–367. Fortes, R.R. & Absalão, R.S. (2004) The applicability of Rapoport’s rule to the marine mollusks of the Americas. Journal of Biogeography, 31, 1909–1916. Gagné, W.C. (1979) Canopy-associated arthropods in Acacia koa and Metrosideros tree communities along an elevational transect on Hawaii Island. Pacific Insects, 21, 56 – 82. Gaston, K.J. (2003) The structure and dynamics of geographic ranges. Oxford University Press, Oxford. Gaston, K.J. & Chown, S.L. (1999) Why Rapoport’s rule does not generalise. Oikos, 84, 309 – 312. Gaston, K.J., Blackburn, T.M. & Spicer, J.I. (1998) Rapoport’s rule: time for an epitaph? Trends in Ecology & Evolution, 13, 70 –74. Gathorne-Hardy, F., Syaukani & Eggleton, P. (2001) The effects of altitude and rainfall on the composition of the termites (Isoptera) of the Leuser ecosystem (Sumatra, Indonesia). Journal of Tropical Ecology, 17, 379 – 393. Gotelli, N.J. & Ellison, A.M. (2002) Biogeography at a regional scale: determinants of ant species density in New England bogs and forests. Ecology, 83, 1604 –1609. Harcourt, A.H. (2000) Latitude and latitudinal extent: a global analysis of the Rapoport effect in a tropical mammalian taxon: primates. Journal of Biogeography, 27, 1169–1182.
622
Hawkins, A.F.A. (1999) Elevational and latitudinal distribution of east Malagasy forest bird communities. Journal of Biogeography, 26, 447–458. Hawkins, B.A. & Diniz-Filho, J.A.F. (2002) The mid-domain effect cannot explain the diversity gradient of Nearctic birds. Global Ecology and Biogeography, 11, 419–426. Heaney, L.R. (2001) Small mammal diversity along an elevational gradient in the Philippines: an assessment of patterns and hypotheses. Global Ecology and Biogeography, 10, 15– 39. Hernández, C.E., Moreno, R.A. & Rozbaczylo, N. (2005) Biogeographical patterns and Rapoport’s rule in southeastern Pacific benthic polychaetes of the Chilean coast. Ecography, 28, 363– 373. Hernández Fernández, M. & Vrba, E.S. (2005a) Rapoport effect and biomic specialization in African mammals: revisiting the climatic variability hypothesis. Journal of Biogeography, 32, 903–918. Hernández Fernández, M. & Vrba, E.S. (2005b) Body size, biomic specialization and range size of African large mammals. Journal of Biogeography, 32, 1243–1256. Hofer, U., Bersier, L. & Borcard, D. (1999) Spatial organization of a herpetofauna on an elevational gradient revealed by null model tests. Ecology, 80, 976–988. Hortal-Muñoz, J., Martín-Piera, F. & Lobo, J.M. (2000) Dung beetle geographic diversity variation along a Western Iberian latitudinal transect (Coleoptera: Scarabaeidae). Annals of the Entomological Society of America, 93, 235–243. Hosoda, H. (1999) Elevational occurrence of ground beetles (Coleoptera, Carabidae) on Mt. Kurobi, central Japan, with special reference to forest vegetation and soil characteristics. Pedobiologia, 43, 364–371. Kikuta, T., Gunsalam, G., Kon, M. & Ochi, T. (1997) Elevational change of fauna, diversity and food preference of dung and carrion beetles on Mt. Kinabalu, Borneo. Tropics, 7, 123–132. Kolasa, J., Hewitt, C.L. & Drake, J.A. (1998) Rapoport’s rule: an explanation or a byproduct of the latitudinal gradient in species richness? Biodiversity and Conservation, 7, 1447– 1455. Koleff, P. & Gaston, K.J. (2001) Latitudinal gradients in diversity: real patterns and random models. Ecography, 24, 341–351. Lees, D.C., Kremen, C. & Andriamampianina, L. (1999) A null model for species richness gradients: bounded range overlap of butterflies and other rainforest endemics in Madagascar. Biological Journal of the Linnean Society, 67, 529–584. Lobo, J.M. & Halffter, G. (2000) Biogeographical and ecological factors affecting the elevational variation of mountainous communities of coprophagous beetles (Coleoptera: Scarabaeoidea): a comparative study. Annals of the Entomological Society of America, 93, 115–126. Lyons, S.K. & Willig, M.R. (1997) Latitudinal patterns of range size: methodological concerns and empirical evaluations for New World bats and marsupials. Oikos, 79, 568–580. McCain, C.M. (2003) North American desert rodents: a test of the mid-domain effect in species richness. Journal of Mammalogy, 84, 967–980.
© 2006 The Authors Global Ecology and Biogeography, 15, 614–624, Journal compilation © 2006 Blackwell Publishing Ltd
Rapoport effect revisited McCain, C.M. (2004) The mid-domain effect applied to elevational gradients: species richness of small mammals in Costa Rica. Journal of Biogeography, 31, 19 – 31. Md. Nor, S. (2001) Elevational diversity patterns of small mammals on Mount Kinabalu, Sabah, Malaysia. Global Ecology and Biogeography, 10, 41– 62. Moles, A.T. & Westoby, M. (2003) Latitude, seed predation and seed mass. Journal of Biogeography, 30, 105 –128. Mora, C. & Robertson, D.S. (2005) Causes of latitudinal gradients in species richness: a test with fishes of the tropical eastern pacific. Ecology, 86, 1771–1782. Nathan, R. & Werner, Y.L. (1999) Reptiles and breeding birds on Mt. Hermon: patterns of elevational distribution and species richness. Israel Journal of Zoology, 45, 1– 33. OchociNska, D. & Taylor, J.R.E. (2003) Bergmann’s rule in shrews: geographical variation of body size in Palearctic Sorex species. Biological Journal of the Linnean Society, 78, 365–381. Pagel, M.D., May, R.M. & Collie, A.R. (1991) Ecological aspects of the geographical distribution and diversity of mammalian species. The American Naturalist, 137, 791– 815. Parmesan, C., Gaines, S., Gonzalez, L., Kaufman, D.M., Kingsolver, J., Peterson, A.T. & Sagarin, R. (2005) Empirical perspectives on species borders: from traditional biogeography to global change. Oikos, 108, 58 – 75. Poulsen, M.K. & Lambert, F.R. (2000) Elevational distribution and habitat preferences of forest birds on Halmahera and Buru, Indonesia: implications for conservation of Moluccan avifaunas. Ibis, 142, 566 – 586. Rahbek, C. (1997) The relationship among area, elevation, and regional species richness in Neotropical birds. The American Naturalist, 149, 875 – 902. Reed, R.N. (2003) Interspecific patterns of species richness, geographic range size, and body size among New World venomous snakes. Ecography, 26, 107–117. Rickart, E.A. (2001) Elevational diversity gradients, biogeography and the structure of montane mammal communities in the intermountain region of North America. Global Ecology and Biogeography, 10, 77–100. Robertson, H.G. (2002) Comparison of leaf litter ant communities in woodlands, lowland forests and montane forests of northeastern Tanzania. Biodiversity and Conservation, 11, 1637–1652. Rohde, K. (1996) Rapoport’s rule is a local phenomenon and cannot explain latitudinal gradients in species diversity. Biodiversity Letters, 3, 10 –13. Rohde, K. (1999) Latitudinal gradients in species diversity and Rapoport’s rule revisited: a review of recent work and what can parasites teach us about the causes of the gradients? Ecography, 22, 593 –613. Rohde, K. & Heap, M. (1996) Latitudinal ranges of teleost fish in the Atlantic and Indo-pacific oceans. The American Naturalist, 147, 659 –665. Rohde, K., Heap, M. & Heap, D. (1993) Rapoport’s rule does not apply to marine teleosts and cannot explain latitudinal gradients in species richness. The American Naturalist, 142, 1–16. Ruggiero, A. & Lawton, J.H. (1998) Are there latitudinal and elevational Rapoport effects in the geographic ranges of Andean
passerine birds? Biological Journal of the Linnean Society, 63, 283–304. Samson, D.A., Rickart, E.A. & Gonzales, P.C. (1997) Ant diversity and abundance along an elevational gradient in the Philippines. Biotropica, 29, 349–363. Samyn, Y. & Tallon, I. (2005) Zoogeography of the shallow-water holothuroids of the western Indian Ocean. Journal of Biogeography, 32, 1523–1538. Sánchez-Cordero, V. (2001) Elevation gradients of diversity for rodents and bats in Oaxaca, Mexico. Global Ecology and Biogeography, 10, 63 –76. Sanders, N.J. (2002) Elevational gradients in ant species richness: area, geometry, and Rapoport’s rule. Ecography, 25, 25 –32. Sanders, N.J., Moss, J. & Wagner, D. (2003) Patterns of ant species richness along elevational gradients in an arid ecosystem. Global Ecology and Biogeography, 12, 93–102. Sfenthourakis, S. (1992) Elevational effect on species richness of Oniscidea (Crustacea; Isopoda) on three mountains in Greece. Global Ecology and Biogeography, 2, 157–164. Shepherd, U.I. & Kelt, D.A. (1999) Mammalian species richness and morphological complexity along an elevational gradient in the arid southwest. Journal of Biogeography, 26, 843–855. Sklenár, P. & Jørgensen, P.M. (1999) Distribution patterns of páramo plants in Ecuador. Journal of Biogeography, 26, 681– 691. Smith, K.F. & Gaines, S.D. (2003) Rapoport’s bathymetric rule and the latitudinal species diversity gradient for Northeast Pacific fishes and Northwest Atlantic gastropods: evidence against a causal link. Journal of Biogeography, 30, 1153–1159. Sokal, R.R. & Rohlf, F.J. (1981) Biometry — the principles and practice of statistics in biological research. W.H. Freeman and Co., New York. Stephenson, S.L., Novozhilov, Y.K. & Schnittler, M. (2000) Distribution and ecology of myxomycetes in high-latitude regions of the Northern Hemisphere. Journal of Biogeography, 27, 741–754. Stevens, G.C. (1989) The latitudinal gradient in geographical range: how so many species coexist in the tropics. The American Naturalist, 133, 240–256. Stevens, G.C. (1992) The elevational gradient in elevational range: an extension of Rapoport’s latitudinal rule to altitude. The American Naturalist, 140, 893–911. Taylor, P.H. & Gaines, S.D. (1999) Can Rapoport’s rule be rescued? Modelling causes of the latitudinal gradient in species richness. Ecology, 80, 2474–2482. Willig, M.R., Kaufman, D.M. & Stevens, R.D. (2003) Latitudinal gradients of biodiversity: patterns, process, scale, and synthesis. Annual Review of Ecology, Evolution and Systematics, 34, 273–309. Wolf, J.H.D. (1993) Diversity patterns and biomass of epiphytic bryophytes and lichens along an elevational gradient in the northern Andes. Annals of the Missouri Botanical Garden, 80, 928–960. Zapata, F.A., Gaston, K.J. & Chown, S.L. (2003) Mid-domain models of species richness gradients: assumptions, methods and evidence. Journal of Animal Ecology, 72, 677–690.
© 2006 The Authors Global Ecology and Biogeography, 15, 614– 624, Journal compilation © 2006 Blackwell Publishing Ltd
623
C. R. Ribas and J. H. Schoereder SUPPLEMENTARY MATERIAL
BIOSKETCHES Carla R. Ribas is at the Universidade Federal de Viçosa as an associate professor and researcher at the Laboratory of Community Ecology. Her main interest is in ant community ecology. José H. Schoereder is a professor of ecology at the Universidade Federal de Viçosa and he works with community ecology of ants and other insects, leading the Laboratory of Community Ecology.
The following material is available online at www.blackwell-synergy.com/loi/geb Appendix S1 Results of random simulations of the Rapoport effect. Appendix S2 Results of pseudo-random simulations of the Rapoport effect.
Editor: Tim Blackburn
624
© 2006 The Authors Global Ecology and Biogeography, 15, 614–624, Journal compilation © 2006 Blackwell Publishing Ltd