Is Peer Review in Decline? Glenn Ellison1 MIT and NBER July 2007
1
I would like to thank the National Science Foundation (SES-0550897), the Institute for Advanced Study, and the Toulouse Network for Information Technology for their support. Tom Chang and Brandon Lehr provided valuable research assistance. I thank Markus M¨obius for providing data. Susan Athey, Ofer Azar, Edward Glaeser, Drew Fudenberg, and Andrei Shleifer provided helpful comments. Greg Mankiw facilitated the dissemination of this paper by mentioning it in his blog.
Abstract Over the past decade there has been a decline in the fraction of papers in top economics journals written by economists from the highest-ranked economics departments. This paper documents this fact and uses additional data on publications and citations to assess various potential explanations. Several observations are consistent with the hypothesis that the Internet improves the ability of high-profile authors to disseminate their research without going through the traditional peer-review process. JEL Classification No.: A14, O30
1
Introduction
For the past half-century or more peer-reviewed journals have played a central role in the evaluation and dissemination of scientific research. The Internet has enhanced scientific communication in many ways, and there is considerable excitement around new institutions for disseminating research.1 A more sobering thought, however, is that new technologies can also be disruptive. This paper begins with some documentation of recent trends in economics publishing. Roughly, the trends involve economists from top-ranked departments publishing fewer papers in many top journals. This could be a welcome change, but is also potentially troublesome: one way in which the Internet could be disruptive is that it could allow high-profile researchers to disseminate their work without subjecting it to peer review, which in turn could lead to a broader unraveling of the peer-review system. The majority of the paper is then devoted to analyses of several additional data sources with the goal of understanding better what may be causing the observed trends. The facts part of this paper documents two main facts: 1. Economists in top-ranked departments now publish very few papers in top field journals. There is a marked decline in such publications between the early 1990’s and early 2000’s. 2. Comparing the early 2000’s with the early 1990’s, there is a decline in both the absolute number of papers and the share of papers in the top general-interest journals written by Harvard economics department faculty. Although the second fact just concerns one department, I see it as potentially important to understanding what is happening because it comes at a time when Harvard is widely regarded (I believe correctly) as having ascended to the top position in the profession. The “decline of peer review” theory I allude to in the title is that the necessity of going through the peer-review process has lessened for high status authors: in the old days peer1 Among the new institutions in the economics profession are the working paper archives like RePEc and SSRN, new electronic-only journals like Economics Bulletin, Theoretical Economics, and the BEPress journals, and NAJ Economics, which aims to provide peer review without publication. Economics is also influenced by general tools, including Google Scholar. Electronic archives have achieved greater success in several other disciplines.
1
reviewed journals were by far the most effective means of reaching readers, whereas with the growth of the Internet high-status authors can now post papers online and exploit their reputation to attract readers. Many alternate explanations are possible. I focus on four theories: the decline-in-peerreview theory and three alternatives. 1. The trends could be a consequence of top-school authors’ being crowded out of the top journals by other researchers. Several such stories have an optimistic message, e.g. there is more talent entering the profession, old pro-elite biases are being broken down, more schools are encouraging faculty to do cutting-edge research, and the Internet is enabling more cutting-edge research by breaking down informational barriers that had hampered researchers outside the top schools.2 2. The trends could be a consequence of the growth of revisions at economics journals discussed in Ellison (2002a, 2002b). In this more pessimistic theory highly productive researchers must abandon some projects and/or seek out faster outlets to conserve the time now required to publish their most important works. 3. The trends could simply reflect that field journals have declined in quality and have become a less attractive place to publish. The majority of this paper is devoted to examining various data sources that provide additional details about how economics publishing has changed over the past decade. These are intended both to sharpen understanding of the facts to be explained and to provide tests of auxiliary predictions of the theories. Two main sources of information are used: data on publications and data on citations. The publication data include department-level counts of publications in various additional journals, an individual-level dataset containing records of publications in a subset of journals for thousands of economists, and a very small dataset containing complete data on a few authors’ publication records. The citation data include citations at the paper level for 9000 published papers and less well matched data that is used to construct measures of citations to authors’ unpublished works, to departments as a whole, and to various journals. 2
Kim, Morse and Zingales (2006) argue for the latter hypothesis and provide empirical evidence.
2
The analysis part of the paper contains numerous small analyses of these auxiliary data sources. Each is designed to provide information relevant to one or more of the theories. I hope that readers will also find some of them to be of independent interest. Among the interesting observations from the publication data are that the facts appear to pertain to economists in top departments, rather than reflecting general trends among top economists, and that economists in top departments continue to publish at a high rate in many other outlets. The citation analyses provide some evidence that economists in top departments are less reliant on journals for the dissemination of their work: Harvard economists are garnering a large number of citations to their unpublished research; and the citation benefit of publishing in top general interest journals appears to be small for members of several top departments. Keeping track of the various facts and which ones favor which theories is difficult. I provide a summary table and refer to it repeatedly in Sections 4 and 5 to help with this, but the nature of the paper makes it a bit unwieldy. No one theory fits all the facts. The decline-in-peer-review theory appears to do relatively well. There are also multiple sources of support for the slowdown theory. This paper belongs to a growing literature on publication processes and academic productivity.3 Ellison (2002a) develops a theoretical model of the peer review process in which quality standards are endogenously determined. McCabe and Snyder (2005) develop a model of journals as certification intermediaries. Ellison (2002b) documents the increased time costs of going through the peer-review process and notes several other trends. Azar (2007) discusses incentive effects of these time costs. Kim, Morse, and Zingales (2006) examine whether being in a top economics department provides a productivity benefit reflected in increased published output in good journals. It develops an extensive database and exploits the movement of faculty across universities to estimate a model with individual- and department-decade fixed effects and finds that the productivity benefit of being in a top department declined from the 1970’s to the 1990’s and was gone by the latter decade. Oyer (2006) is related: it uses initial-year job-market tightness as an instrument for obtaining an intial placement in a top department and finds that there is a causal effect of better initial placement on published output (and on long-term placement). It does not explic3
Colander (1989) and Gans (2000) contain nice surveys of the literature at different points in time.
3
itly consider changes over time, but can be regarded as obtaining a somewhat contrasting conclusion because its sample is largely from the 1990’s. The citation analysis presented here is related to the literature on the determinants of citations to academic research. Some of the noteworthy papers on the economics discipline are Stigler and Friedland (1975), Laband (1986), and Laband and Tollison (2000). The basic facts about the two trends are presented in Section 2. Section 3 discusses potential explanations for the facts. Section 4 contains additional analyses of publication records. Section 5 contains the citation analyses. I review the various findings and attempt to bring them together in Section 6. I conclude that the decline-of-peer-review theory is probably the most important and that the growth-of-revisions theory probably also plays some role.
2
Two Facts
In this section I document the two facts highlighted in the introduction. The primary data used in this section are counts of publications in eighteen economics journals by the faculty of ten economics departments.4 The departments are the top ten in one particular published ranking. They are listed in Table 1 in the order of their NRC rating and I will also use the NRC ratings at times to separate them into “top 5” and “6-10” groups.5 The journal set includes five general interest journals and thirteen field journals. When I discuss “recent trends” in publishing, I am refering to differences between the contents of journals in 2000-2003 and the contents of the same journals in 1990-1993. Except where otherwise noted, publication counts in this paper assign each author partial credit for coauthored papers, e.g. a three-authored paper with one author who is a faculty 4 The publication counts I present are always for regular faculty in the economics departments at these universities. They do not include publications by graduate students or visitors to these departments, nor publications by faculty members whose primary affiliation is in some unit other than the economics department. Due to limitations in Econlit the data do not include the identity or affiliation for all authors other than the first when papers have four or more authors. 5 The ranking used to choose the ten schools was not the NRC’s, so my 6-10 group will not necessarily coincide with the NRC’s. Many departments appear in the top five and top ten of different rankings. My choice of which schools to collect data for was somewhat arbitrary. To reduce the risk of offending anyone who thinks that their department should have been included, I have chosen to withold the identity of one department, which I label School Z. The choice of which schools to place in the top five is less consequential. I’ll present department-by-department breakdowns in several tables, and find that the main results are robust to alternate definitions of the “top five”.
4
member at Princeton will count as one-third of a paper by Princeton.
2.1
Field journal publications
In this section I discuss Fact 1: Fact 1 Comparing the early 2000’s with the early 1990’s, there is a decline in the share of papers in the top field journals (and the absolute number) written by faculty members from the top five economics departments. Economists in these departments now publish in top field journals at a rate of about 1 paper per faculty member per decade. Table 1 presents counts of publications in thirteen field journals.6 The set of journals was chosen to include the most widely-cited field journals and to include at least one journal from most of the major fields of economics. The list of journals can be found in the table. The left columns present counts of 1990-1993 publications, and the right columns present 2000-2003 publications. The “decline” part of Fact 1 comes through clearly in the top row of the table. It indicates that members of the top five economics departments published 86.4 papers in these journals in 1990-1993 and 71.2 papers in 2000-2003, an 18% decrease.7 Moreover, this decline in publication counts came during a period when many of the journals were substantially increasing the number of papers they published. If one looks at the share of papers by top five departments, the decline is more dramatic: the 2.7% share in 2000-2003 is about one-third less than the 4.0% share of 1990-1993. The “levels” part of Fact 1 is perhaps even more striking. The total of 71.2 papers by five departments over a four year period is about 3.5 papers per department per year. These departments have about 40 faculty members on average, so this is a publication rate of less than one paper per faculty member per decade. The breakdown for top-five departments shows that the pattern is fairly consistent across departments within the top five. All top five schools show a decline in field jour6
The counts omit papers in special issues of the journals and papers that are three or fewer pages in length. 7 Coauthorship rates have increased over the period. Despite this, an unweighted count that gives each author full credit for a paper still shows a decline: unweighted counts are 136 in 1990-1993 and 126 in 2000-2003.
5
Journal/school All 13 Field/Departments 1-5 All 13 Field/Departments 6-10 Harvard Chicago MIT Stanford Princeton Yale Berkeley Pennsylvania Northwestern School Z Games and Economic Behavior Journal of Development Economics Journal of Econometrics Journal of Economic Theory Journal of Finance Journal of International Economics Journal of Labor Economics Journal of Law and Economics Journal of Law, Ec., and Organization Journal of Monetary Economics Journal of Public Economics Journal of Urban Economics RAND Journal of Economics Games and Economic Behavior Journal of Economic Theory Journal of Monetary Economics Ten others
1990-1993 2000-2003 “Top” “Top” “Top” “Top” dept. dept. Total dept. dept. Total count as % pubs. count as % pubs. Coauthorship-weighted publication counts 86.4 4.0% 2148 71.2 2.7% 2643 88.8 4.1% 2148 83.9 3.2% 2643 Breakdown by school 20.8 1.0% 2148 18.1 0.7% 2643 8.7 0.4% 2148 3.5 0.1% 2643 21.0 1.0% 2148 21.3 0.8% 2643 12.2 0.6% 2148 14.6 0.6% 2643 23.8 1.1% 2148 13.7 0.5% 2643 14.2 0.7% 2148 12.7 0.5% 2643 20.4 1.0% 2148 11.8 0.4% 2643 18.5 0.9% 2148 22.5 0.9% 2643 14.7 0.7% 2148 16.2 0.6% 2643 21.0 1.0% 2148 20.8 0.8% 2643 Breakdown by journal for Top 5 departments 1.5 1.7% 88 2.8 1.2% 237 3.3 1.7% 193 1.5 0.6% 241 7.5 4.5% 167 6.3 2.9% 220 18.2 6.7% 271 10.4 3.0% 344 3.9 1.3% 293 9.1 2.9% 310 7.0 4.3% 162 2.5 1.3% 197 4.5 5.6% 80 7.2 5.6% 128 5.0 7.2% 69 2.5 2.8% 90 2.7 3.3% 80 2.0 2.5% 79 9.0 5.0% 181 3.0 1.6% 190 7.0 3.1% 225 11.5 4.1% 281 3.5 1.9% 183 3.3 1.6% 203 13.3 8.5% 156 9.0 7.3% 123 Breakdown for Northwestern, Penn &School Z 0.5 0.6% 88 8.0 3.4% 237 14.8 5.5% 271 17.9 5.2% 344 6.3 3.5% 181 11.2 5.9% 190 32.5 2.0% 1608 22.3 1.2% 1872
Table 1: Publications by members of ten highly-ranked departments in 13 field journals
6
nal publications in the share measure. All but MIT are below the one-paper-per-facultymember-per-decade output rate. The journal-by-journal breakdown for the top five schools shows that publications are down fairly consistently. The top five share has declined by more than 50% at five journals. Only two journals, Journal of Finance and Journal of Public Economics, have an increase in the top-five share. The data on the other top ten departments and the journal-by-journal breakdown indicate that the pattern is somewhat broader than just what is noted in Fact 1. Publications by Yale and Berkeley, which are top-five departments in some rankings, are also down in both the count and share measures. The pattern at the other three departments – Pennsylvania, Northwestern, and School Z – is different, but in a way that is not as different as it first appears. The data on aggregate publications in the 13 field journals shows that these departments are not reducing their publications and that they now publish more papers in the top field journals than do most of the top five schools. If one looks further into the journal-by-journal detail, however, one finds a common pattern. The departments have increased their publication counts at three of the more theory-oriented (and more widely cited) field journals – Games and Economic Behavior, Journal of Economic Theory, and Journal of Monetary Economics – and reduced publications at the others. I would summarize the additional data as indicating that the decline in field journal publications extends to a broadly-defined top five and may extend even further if one omits the more theory-oriented field journals.
2.2
Top general interest journal publications
In this section I discuss Fact 2: Fact 2 Comparing the early 2000’s with the early 1990’s, there is a decline in the number of papers in the top general-interest journals written by faculty members from the Harvard economics department. Table 2 presents publication counts for the “top five” general-interest journals.8 The first row of Table 2 looks very different from the first row of Table 1. One big difference 8
The counts omit special articles like presidential addresses and also omit all papers in the Papers and Proceedings issues of the American Economic Review.
7
is that there is no substantial decline in publications by the top five departments. The total number of papers published by these journals has declined, so the top-five share has actually increased from 13.4% to 14.4%. A second striking difference is that the counts and shares in Table 2 are much larger than in Table 1. The top-five departments publish more than twice as many papers in the five general-interest journals as they do in the thirteen field journals. Their share is more than five times as large in the general-interest journals.
Journal/school All 5/Departments 1-5 All 5/Departments 6-10 Harvard Chicago MIT Stanford Princeton Yale Berkeley Pennsylvania Northwestern School Z American Economic Review Econometrica Journal of Political Economy Quarterly Journal of Economics Review of Economic Studies American Economic Review Econometrica Journal of Political Economy Quarterly Journal of Economics Review of Economic Studies
1990-1993 2000-2003 “Top” “Top” “Top” “Top” dept. dept. Total dept. dept. Total count as % pubs. count as % pubs. Coauthorship-weighted publication counts 167.8 13.4% 1248 164.3 14.4% 2643 126.4 10.1% 1248 111.1 9.7% 2643 Breakdown by school 49.0 3.9% 1248 32.1 2.8% 1141 21.3 1.7% 1248 22.5 2.0% 1141 36.3 2.9% 1248 38.5 3.4% 1141 12.2 1.0% 1248 24.9 2.2% 1141 49.1 3.9% 1248 46.3 4.1% 1141 25.3 2.0% 1248 24.3 2.1% 1141 22.6 1.8% 1248 22.7 2.0% 1141 31.7 2.5% 1248 21.8 1.9% 1141 29.0 2.3% 1248 22.7 2.0% 1141 17.8 1.4% 1248 19.6 1.7% 1141 Breakdown by journal: all departments 67.3 18.0% 375 57.1 15.1% 377 63.4 26.0% 244 68.8 26.3% 261 48.6 21.5% 226 46.3 24.3% 190 59.5 27.9% 213 64.4 39.0% 165 55.4 29.2% 190 38.9 26.3% 148 Breakdown by journal: Harvard 10.8 2.9% 375 8.1 2.1% 377 8.7 3.6% 244 4.0 1.5% 261 5.5 2.4% 226 2.5 1.3% 190 14.8 7.0% 213 14.9 9.0% 165 9.2 4.8% 190 2.6 1.7% 148
Table 2: Publications by members of six highly-ranked departments in five top generalinterest journals
8
Fact 2 is apparent in the department-by-department breakdown. In the early 1990’s Harvard and Princeton were well ahead of the other departments. Between the early 1990’s and the early 2000’s, Harvard’s top general-interest publications had declined by about one-third (or by 28% if one uses the share measures).9 Publication counts are roughly constant at most of the other top-five departments. All of them have at least a small increase in the share measure. Stanford shows a large increase from a low initial level. Again, these conclusions are fairly robust to how one defines the top five: Berkeley and Yale also have roughly constant general-interest publication counts. Despite the decline, Harvard remains ahead of all departments other than Princeton and MIT. Harvard’s journal-by-journal breakdown is distinctive. Publications in Econometrica, Journal of Political Economy, and Review of Economic Studies are down by more than 50%. Publications in the Quarterly Journal of Economics have stayed roughly constant. They now account for more than 45% of Harvard’s top general interest publications. Harvard would rank ninth among the ten schools if one omitted QJE publications from the counts.
3
Potential Explanations
In the introduction I mentioned four theories that one might give to account for the two facts. In this section I describe each mechanism in a little more detail and comment on how it comports with the facts described above.
3.1
Decline in the Importance of Peer Review
Journals serve two roles: they disseminate papers and provide quality certification. The Internet aids dissemination in many ways: papers are posted to authors’ websites and working paper archives; e-mail is used to inform potential readers about papers; Internet search tools help readers find papers; journals have been made more accessible; and so on. Many of these are substitutes for traditional journal dissemination, so the primary role of journals may increasingly be to provide quality certification.10 A shift in the role of 9
Counts giving full credit for papers whether coauthored or not give a similar picture. Harvard’s unweighted publication count declines from 86 to 56. The other top five departments increase from 184 to 222. 10 Azar (2007) reports that working papers grew from 3% of the citations in the AER and Econometrica in 1960 to 14% in 2002. Given that the majority of citations are now to papers that are more than ten years
9
journals could lead authors from top schools to withdraw from publishing in many journals for two reasons. First, highly-regarded and highly-visible authors will be able to make their work widely known (and widely read) without publishing it in journals. Such authors receive diminished dissemination benefits from journal publication. Second, highly-regarded authors may traditionally have been publishing in journals mostly for the dissemination benefits. Consider questions of the form: Which do you think is of higher quality: a paper by Author X that just appeared in Journal Y or the same author’s most recent working paper that has yet to be submitted for publication? If the answer to this question is not clear, then Journal Y is providing little in the way of quality certification benefits to Author X. This story can naturally fit each of the main facts described in the previous section. For many faculty in top departments, the fact that a paper is published in a top field journal will only have a small impact on potential readers’ beliefs about the paper’s quality and will only provide minimal career-concerns benefits. Hence, a decline in the dissemination role should lead to a decrease in field journal publications. My impression is that even the most highly regarded economists in the profession still receive a reputational benefit (which helps both with disseminating the particular paper and for career-concerns reasons) from publishing in the top general interest journals. However, even in this case, certification benefits are likely smaller for high-status authors and the dissemination benefits may be smaller for authors who can make their work widely known without publishing it in a top journal. The decline in Harvard’s general-interest publication could reflect that it has a disproportionate number of very-high-status economists and that its faculty are uniquely visible.
3.2
Top Department Quality/Productivity
The share of papers in top journals written by faculty in a given department is a measure of the output of that department relative to the profession as a whole. Hence, our facts could be explained as a consequence of a relative decline of the departments considered. Several plausible mechanisms could account for such a decline. old, working papers account for a substantial fraction of the citations to recent works.
10
First, the traditionally top-ranked departments may have been less successful in attracting and retaining the most productive economists. This could be due to relative increases in salaries and working conditions at economics departments at various competing employers: other top economics departments, business schools, and at institutions (e.g. foreign schools) that are attractive to particular faculty members. Anecdotally, I know that MIT has seen a large share of its top new Ph.D’s take jobs in business schools over the last decade and has lost several faculty to and failed to entice many more faculty away from other departments. Second, the top-ranked departments could have been as successful as ever in assembling the most productive economists, but still had their share of output decline because of changes in the productivity distribution. For example, this would be the case if the number of economists trying to publish in top journals has increased or if there is a flattening of the productivity distribution. Third, the top-ranked departments could be as strong as ever in their productivity share, but still see a decline in their output share because of changes in the distribution of resources. For example, Kim, Morse and Zingales (2006) argue that improvements in communication technology have reduced barriers that made it more difficult for faculty outside the top schools to do cutting-edge research. Another potential source of resource reallocation is increased attention paid, for example, by the United Kingdom, to top-journal publications. This might increase resources allocated to producing top-journal publications either via direct shifts in resource allocations, or indirectly as faculty increase the share of their effort devoted to publishing in top journals. These stories are all plausible, but I regard the decline-in-top-department-quality theory as not fitting the facts outlined in the previous section as neatly as the other theories. In particular it does not seem so natural that a decline in top department quality would reduce field journal publications but not top general-interest publications. One could hypothesize that economists at the top five departments have reacted to increased competition by concentrating more on general interest publications or that barriers to doing field journal work have come down more than barriers to doing general interest work, but it is not obvious why these should be true. The theory also seems hard to reconcile with the Harvard’s decline in top general interest publications. Harvard hired a large number of highly regarded 11
and highly productive faculty between 1993 and 2001 and is commonly perceived to have ascended to the top position in the profession during this period.11
3.3
The Slowdown
The title of Ellison (2002b) emphasizes the “slowdown” of the publication process. An important observation of that paper, however, is that publication does not simply take longer in calendar time – the process also requires more effort from authors. The slowdown continued through the 1990’s at both general interest and field journals. Hence, it is potentially relevant to why behavior might have changed between the early 1990’s and the early 2000’s.12 The increased burdens of publishing in top journals should affect economists’ submission strategies for two reasons analogous to the substitution and income effects of consumer theory. First, economists would be expected to substitute away from journals at which the process became more time consuming and/or more arduous toward outlets where this did not occur. Second, aggregate time constraints may lead economists to publish fewer papers in peer-reviewed outlets. The papers they choose not to publish (or not to write) would presumably be those for which the benefit to publication (per unit time required) is low. Table 1 of Ellison (2002a) indicates that the 1990’s slowdown was most severe at the top general interest journals (other than the QJE). Mean submit-accept times at the top non-QJE general interest journals increased from 17.5 months in 1990 to 24.1 months in 1999.13 The QJE’s mean submit-accept time was reduced from 22 months to 13 months. Mean submit-accept times at the seven top field journals for which data is available show a smaller increase: from 14.8 months in 1990 to 16.4 months in 1999. The publication counts for the top general-interest journals are consistent with the hypothesis that the slowdown is an important determinant of the observed changes. There is a shift in publications away from the other general interest journals toward the QJE. The decline in field journal publications relative to general interest publications could be attributed to the income effect. Economists at top schools publish a nontrivial fraction of 11
Harvard’s hires in this period include Philippe Aghion, John Campbell, Drew Fudenberg, Oliver Hart, Elhanan Helpman, Michael Kremer, Ariel Pakes, Ken Rogoff, Jim Stock, and Jeremy Stein. 12 Azar (2005, 2007) points out first responses have also slowed and first-response times should have a substantial impact on submission decisions because most initial submissions are rejected. 13 These are unweighted means across journals.
12
their papers in top general interest journals, so it is plausible that increases in the timecost of publishing in general interest journals could lead them to spend less time trying to publish papers in field journals. The decline of Harvard’s general interest publications is a little harder to fit into this theory. The direction of the change makes sense, but it is harder to argue that the slowdown alone should result in Harvard dropping below some other departments in general interest publications.
3.4
Field Journal Quality
Journals provide two main benefits to authors: they disseminate research, and they provide a quality certification that can bolster the author’s reputation. Each benefit will be reduced if the average quality of papers in a journal declines. It is plausible that field journals suffered a relative decrease in quality over the period studied for a few reasons. First, Ellison (2002b) notes that citations to articles in field journals did not grow as rapidly as citations to articles in general interest journals. Recent articles in nine top field journals received only 30% as many citations as articles in the top general-interest journals in 1998, down from 52% in 1990. Second, many top journals are for-profit operations that have raised prices substantially in recent years. This has reduced their availablility and led to discontent that may be affecting submissions.14 The decline-in-field-journal-quality hypothesis fits well with the observation that most top departments are reducing publications in field journals but not in the general interest journals. A separate explanation would be needed to account for the reduction in Harvard’s general interest publications.
3.5
Summary
Throughout this paper I’ll try to organize my discussion of the coherence between the various theories and the evidence by referring to Table 3. Each column of the table corresponds to one of the theories discussed in this section. The rows corresponds to the various pieces of evidence considered. The first row is concerned with Facts 1 and 2. Here, my summary is that each of the theories could explain the facts, but that the decline-in-top-departmentquality is somewhat problematic. 14
See, for example, Bergstrom (2001) and McCabe, Nevo, and Rubinfeld (2005). The 2001 launch of the
13
Facts 1 and 2 More pub. counts Author CV data Author pub. data Jrnl. citation counts Dept. citation counts Paper citation data
Decline in Top Dept. Quality +/– – –
Theories Slowdown of Decline in Publication Fld. Jrnl. Process Quality + + + – + – – +
+ /– +/–
–
Decrease in Peer Review Necessity + + + +/– +/–
Table 3: Summary of fit of theories to evidence The remaining rows of the table summarize the coherence between the theories and the various data items presented in sections 4 and 5. I will refer back to this table and discuss these summaries at the end of each subsection.
4
More Publication Data
In this section I present additional publication counts. They provide a more detailed view of the changes that have occurred and bear on which theories might be most important.
4.1 4.1.1
Departmental publication counts Journal-specific declines and the slowdown
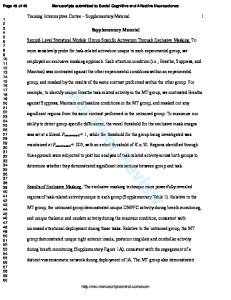
If top authors are withdrawing from publishing in top journals due to the slowdown of the publication process, then one would expect that there would be a greater decrease in top-school publications at journals that have experienced more severe slowdowns. Figure 1 shows how these variables are related across journals: the difference between the journal’s 1999 and 1990 submit-accept time (in months) is on the x-axis and the change in the share of papers by authors in the top five economics departments is on the y-axis.15 The top general interest journals are marked by solid boxes. The QJE obviously stands BE Press’s macroeconomics and theory journals may be a tangible consequence of this discontent. 15 The submit-accept time data is from Table 1 of Ellison (2002a). In three cases (JIntE, JLE, and JF) data on 1990 are missing in Ellison (2002a) and the graph instead uses one half of the 1980-1999 difference as the x variable.
14
out in both dimensions: it has sped up rather than slowing down; and the share of papers by authors at the top five departments has increased dramatically. The two general interest journals that lost top-department authors, Econometrica and Review of Economic Studies, do not stand out in the figures for having slowed down more than the others during the 1990’s. It may be relevant, however, that they are the two slowest journals in 1999.
Publication Trends and Review Times 0.14 0.12
Change in Top School Pubs
QJE
0.1 0.08 0.06 0.04 JPE
0.02
JF
JPubE
AER
JUE0
-10
-8
-6
-4
-2
-0.02
0
-0.04 JET
RJE2
EMA 4
JDE 6
JIntE JME JLE
8
RES
-0.06
Change in Review Times: 1990-1999 Figure 1: Cross-journal heterogeneity: Change in top school publications (early 90’s-early 00’s) vs. Change in review times (1990-1999) The field journals are marked by outlined boxes. Journal of Public Economics and Journal of Urban Economics have sped up over the course of the 1990’s (and were the two fastest journals in 1999). Neither shows a decline in its top-school share. Six field journals slowed down by more than three months, and five of the six show substantial declines in their top-school shares. The Journal of Finance is an exception to this pattern. Overall, I would conclude that the cross-journal pattern appears to be consistent with the slowdown being a factor contributing to the observed declines in top-school publications.
15
JE
10
1990-1993 2000-2003 “Top” “Top” “Top” dept. Total dept. dept. Total as % pubs. count as % pubs. Top 5 Departments 55.8 17.1% 326 63.8 18.8% 340 34.8 34.8% 100 11.0 20.8% 53 5.5 9.5% 58 5.6 11.4% 49 15.0 20.0% 75 12.5 15.8% 79 23.2 11.4% 203 31.3 17.2% 182 8.0 34.8% 23 8.0 33.3% 24 Departments 6-10 41.2 12.6% 326 35.3 10.4% 340 19.1 19.1% 100 6.3 11.9% 53 4.8 8.3% 58 3.5 7.1% 49 9.5 12.7% 75 7.7 9.7% 79 20.3 10.0% 203 16.5 9.1% 182 0.5 2.2% 23 3.0 12.5% 24
“Top” dept. count
Journal AEA Papers & Proceedings Brookings Papers Carnegie-Rochester Conf. Series Journal of Economic Literature Journal of Economic Perspectives NBER Macroeconomics Annual AEA Papers & Proceedings Brookings Papers Carnegie-Rochester Conf. Series Journal of Economic Literature Journal of Economic Perspectives NBER Macroeconomics Annual
Table 4: Publication counts for “invited” journals 4.1.2
Publication counts for other outlets
Table 4 presents publication counts for six widely-read journals that publish many invited papers and/or have review processes that are less burdensome than those at standard journals. Top-school shares are quite large for all of these journals. The NBER Macroeconomics Annual’s top-five share is larger than the QJE’s. The other journals’ top-five shares are comparable to or larger than those of the top general interest journals. They are much larger than the top-five shares of the field journals we discussed in Section 2. Looking across decades within each journal, there is a large decline in the number and share of Brookings Papers by economists in top departments.16 Beyond this, however, the general pattern appears to be that publication counts are rougly constant across the decades. Harvard’s publication counts would not stand out if I had given a department-by-department breakdown: they are slightly above the average of the other top-five departments at each journal; and are roughly constant across decades (apart from a decline at Brookings Papers). Twelve of the thirteen field journals discussed earlier published at least one special issue 16
The large decline in the number of published articles in part reflects the discontinuance of the journal’s microeconomics series.
16
Set of departments Departments 1-5 Departments 6-10
Dept. count 33.3 36.8
1990-1993 Dept. Total as % pubs. 8.2% 408 9.0% 408
Dept. count 39.9 29.2
2000-2003 Dept. Total as % pubs. 8.6% 464 6.3% 464
Table 5: Publication counts for special issues of field journals and invited journals between 2000 and 2003.17 Most often, these issues are a collection of papers presented at a conference. The review process usually differs from the procedure for regular issues: authors are often contacted personally and invited to submit papers; and the review and revision process must fit within a tighter time frame. Invariably, journals state that papers in special issues were peer-reviewed and subject to the same standards that the journal applies to all papers. Whether standards are really the same is subject to debate. Table 5 reports counts of “special” articles in the thirteen field journals. The first row gives counts for the top five deparments and the second row for departments 6–10. The primary observation I would emphasize is that special issues of field journals do not look like regular issues of field journal issues: the top-department share is approximately three times as large, and there is no substantial decline in top-five publications across decades. Harvard’s publication counts again would not stand out in a department-by-department breakdown: Harvard published 6 articles in field-journal special issues in 1990-1993 and 8.1 in 2000-2003. I see the data in this subsection as problematic for the decline-in-top-department-quality theory in a couple ways: economists in top departments appear to be as strong as ever in their ability to garner slots in invited journals and special issues of field journals; and there is nothing to suggest that that Harvard’s decline in general-interest publications is due to its having a more severe dropoff in productivity. The data seem supportive of the slowdown theory in that we are seeing economists from top departments publishing as they always have in outlets that have not been subject to the slowdown. The data are also somewhat at odds with the decline-in-field-journal-quality story in that there is no evidence 17
This includes cases where a journal publishes a set of “special” papers and some regular papers in the same issue. To maintian consistency across time the Carnegie-Rochester Conference Series is treated as a separate journal throughout the period and not counted as part of the Journal of Monetary Economics.
17
that economists who have the opportunity to publish in special issues are dissuaded by a reduction in dissemination and prestige benefits. 4.1.3
Business school publication counts
One reason that could be given for why top economics departments may have declined relative to the profession as a whole is that more top economists may now be working in business schools. To provide some evidence on this I collected publication counts like those in Section 2 for three top business schools: Chicago, Northwestern-Kellogg, and Stanford. Although these schools publish a large number of top-journal papers, the data do not support the hypothesis that economists in business schools might be increasingly crowding economists from economics departments out of the top journals. Table 6 presents the data. The Chicago GSB had a very high general-interest publication count in 2000-2003, but the aggregate count for the three business schools was higher in the earlier period. Although Kellogg and Chicago both have more field journal publications in 2000-2003 than any of the economics departments studied, again, the aggregate count for 2000-2003 is less than the same figure for 1990-1993. I conclude that these business schools do not appear to be a source of increasing competition.
Journal/school
Chicago GSB Northwestern Kellogg Stanford GSB Chicago GSB Northwestern Kellogg Stanford GSB
1990-1993 2000-2003 Dept. Dept. Total Dept. Dept. Total count as % pubs. count as % pubs. Coauthorship-weighted publication counts Top 5 General Interest Journals 29.8 2.4% 1248 39.3 3.4% 1141 34.5 2.8% 1248 10.6 0.9% 1141 19.7 1.6% 1248 11.8 1.0% 1141 13 Field Journals 24.2 1.1% 1248 27.2 1.0% 1141 44.7 2.1% 1248 31.0 1.2% 1141 18.7 0.9% 1248 17.5 0.7% 1141
Table 6: Publications by faculty of three business schools In Table 3 I summarize the evidence from this section by putting – signs in the topdepartment-quality and field-journal-quality columns and a + sign in the slowdown column. The – for top department quality reflects both the business school evidence and the fact 18
that top departments are not publishing fewer papers in invited journals and special issues of field journals. The – for field journal quality also reflects top department economists’ willingness to publish in special issues of field journals. The + in the slowdown column reflects the (albeit weak) support provided by the scatter plot of changes in top-department shares versus changes in the length of the review process.
4.2
Author CV data
An obvious question to ask about the decline in top-journal publications is where the papers are going: Are economists in top departments publishing fewer papers? Are they publishing more in other outlets? If so, where are they publishing? Answering such questions is difficult, however. Complete publication lists can only be obtained by gathering CVs, and even then it can be hard to classify publications in nonstandard outlets. For this paper, I present a smaller analysis of the setting that I thought would potentially be most informative. I collected CVs for Harvard faculty members who were both (a) tenured and (b) less than forty years old in the fall of 1993 and the fall of 2003. Harvard is a leader in withdrawing from top journals, and this design also lets me make comparisons for which age/experience differences will not be a potential confounding factor. Table 7 summarizes the publication records. Each row gives publication counts for a four-year period for a single economist. The top part contains 1990-1993 counts for the 1993 young senior faculty. The bottom part gives 2000-2003 counts for 2003 faculty. The second column gives a simple publication count not adjusted for coauthorship. The other columns show the location of the publications and, as in the rest of this paper, give partial credit for coauthored papers. The counts in the second column indicate that there has not been a decline in total number of publications.18 Young senior faculty at Harvard are still publishing an astounding number of papers! The third and fourth columns count QJE and other top general-interest publications. The aggregate decline in non-QJE general interest publications indicates that the decline in general interest publications I discussed in Fact 2 is present even in this remarkably productive group of economists. 18
This is defined roughly as all items on the authors’ vitae that are not very short (< 4 pages), commentlike, or published in the popular press (or other outlets that do not publish academic research). The 2003 group is also well ahead in coauthorship-adjusted publications.
19
Author
Total
QJE
A B C D E F Average
18 16 19 10 28 6 16
0.5 0.0 1.3 0.3 1.2 0.0 0.6
G H I J K Average
31 41 13 13 14 22
0.0 1.1 2.0 0.0 1.3 0.9
Other 13 Fld Other top 5 jrnls ref’d 1990-1993 Data 2.3 0.0 3.8 2.8 3.8 0.0 0.5 1.0 1.0 0.3 0.0 3.3 0.5 2.8 2.8 1.5 1.0 0.5 1.3 1.4 1.9 2000-2003 Data 0.0 0.5 1.1 1.0 1.8 6.4 1.0 0.0 1.0 0.9 0.0 1.0 0.5 0.0 0.3 0.7 0.5 2.0
Invt’d jrnls
Other
0.0 0.5 1.5 1.5 3.3 0.5 1.2
1.7 1.0 3.6 0.0 0.0 0.0 1.1
3.3 1.2 0.0 2.3 1.5 1.7
10.6 10.2 9.0 5.0 2.6 7.5
Table 7: Publications by young senior faculty at Harvard The fifth column shows that there is also a large decline in top field journal publications in this analysis of groups at comparable career stages. A natural question is whether this is simply due to the new generation’s having shifted to other field journals or to general interest journals like Review of Economics and Statistics and Journal of the European Economic Association. The answer to this appears to be no. The sixth column reports counts of articles published in other peer-reviewed economics journals.19 The average is approximately constant. Moreover, the breakdown suggests that one outlier may be obscuring a similar downward trend on these publications: economist H is responsible for most of the “other” peer-reviewed publications (and also for most of the top field journal publications). Looking at the sums of the fifth and sixth columns we see that four of the six 1993 young senior faculty published at least 3.3 articles in non-top 5 peer-reviewed journals in 1990-1993 and the lowest total is 1.5. In 2000-2003, the median is 1.0. Publications in invited journals are higher in the latter period. The final column illustrates the most dramatic change: per capita publications in outlets that are not traditional peer-reviewed economics journals jump from 1.1 to 7.5! The majority of these “other” 19
This is defined roughly as all articles published in journals listed in Econlit other than those in my top five, 13 field, and invited sets.
20
publications are article-like items in conference volumes or other edited volumes. Some are articles in policy-oriented journals in other fields, and some are survey-like articles in traditional economic outlets, e.g. Econometric Society World Congress volumes. The main impression I take away from this analysis is that Harvard’s young senior faculty appear to be spending an increasing fraction of their time writing articles that are not being published in peer-reviewed journals. In my summary Table 3 I have put +’s in the columns for the decline-in-peer-review and slowdown theories and a – in the column for the decline-in-top-department-quality theory. I do so because I see the data as suggesting that the Harvard faculty could publish more in peer-reviewed journals if they decided to redirect their efforts to (a) perform/write more of their research in a way that would make it publishable in peer-reviewed journals and/or (b) spend less time doing research and more time navigating the peer-review process.
4.3
Author-level publication database
Another natural question to ask about the two basic facts is whether they are facts about departments or individuals: are the declines in publications by the top departments a reflection of a more widespread decline in publications by highly-regarded economists, or is there something about the departments themselves that is important? In this section, I develop some evidence on this question by analyzing a database containining information on individual authors’ publication records. I collected partial publication records for all authors who published a paper in a top general-interest journal in the 1980’s or the 1990’s. For each author-decade the data include: (1) the number of top general-interest papers published in the decade; (2) the number of top general-interest papers published in the first four years of the next decade; and (3) the number of top field-journal papers published in the first four years of the next decade.20 I think of the number of general-interest publications in a decade as a proxy for the author’s status/productivity at the end of the decade. I use the other variables to examine whether high status/high productivity authors are now publishing less in top journals. The data suggest that Facts 1 and 2 are facts about top departments. Figure 2 presents a 20
The data on general interest publications do not include short papers and special papers such as presidential addresses. The field-journal counts do not include articles in special issues.
21
simple illustration. Authors with a nonzero number of (coauthorship-adjusted) top generalinterest publication in each decade were divided into six bins on the basis of decade-specific top general-interest publication counts: (0,1), [1,2), [2,3), [3,4), [4,5), and [5, ∞). The top panel of the figure examines field journal publications: the squares give the mean number of 2000-2003 field journal publications for authors whose 1990-1999 general-interest publications fall into each bin; and the triangles give 1990-1993 field journal publications as a function of 1980-1989 general-interest publications. The data indicate that the top departments’ decline in field journal publications is not attributable to broader decline in field journal publications by high status/highly productive economists. The top two bins show higher field journal output in the 2000’s. The means for the other bins are very similar.21 The bottom panel presents corresponding data on general-interest publications. Fact 2 is that these were lower in the early 2000’s for economists at Harvard. One could imagine that this was attributable to Harvard having a disproportionate share of the very highstatus economists. Again, the figure indicates that this does not appear to be the case, at least if status is adequately proxied by prior-decade general-interest publications. Means are similar for all bins except for the highest one, and the highest bin has higher output in the later decade.22 Table 8 presents a related regression analysis. In each decade I constructed four variables on the sample of all economists who had multiple publications in the top five generalinterest journals in the decade: a count of the economist’s general interest publications in the decade, a count of the economist’s university’s publications in these journals in the decade, and counts of the economist’s publications in the general interest and field journal groups in the first four years of the next decade.23 21
None of the differences are statistically significant. In the lower bins this is because the differences are very small (standard errors on each estimate are approximately 0.02). In the two highest bins this is because the bins contain few economists: 48 and 51 in the earlier decade and 35 and 22 in the later decade. The relative paucity of economists in the later decade could also affect the interpretation of the gap if it were significant. 22 Here, the difference in means is significant in the highest bin. 23 All counts are weighted for coauthorship. The school-level variable is set to the maximum count for all of an author’s affiliations for authors who have different affiliations on different papers. Unlike in previous analyses, this variable is defined at the university level, and I make no attempt to separate economicsdepartment faculty from the many others authors with the same university affiliation. The restriction of the sample to economists having multiple general-interest publications reflects a data limitation for the earlier decade: Econlit does not contain affiliation data prior to 1989. I obtained affiliation data from Markus
22
Field Journal Publications Fld Jrnl Pubs 90-93 (or 00-03)
1
0.75
0.5
0.25
0 0
1
2
3
4
5
6
Author Top 5 Pubs in Last Decade Fld Jrnl Pubs 90-93 vs. Top 5 Pubs 80s
"Field Jrnl Pubs 00-03 vs. Top 5 Pubs 90s
Top Journal Publications
Top 5 Pubs 90-93 (00-03)
2.5
2
1.5
1
0.5
0 0
1
2
3
4
5
Author Top 5 Pubs Last Decade Top 5 Pubs 90-93 vs. Top 5 Pubs 80s
Top 5 Pubs 00-03 vs. Top 5 90's
Figure 2: Publications as a function of authors’ prior publication records: early 2000’s vs. early 1990’s 23
6
AuthorTop5Pubs in Last Decade
Dep Var: Pub. Counts for Journals/Time Period 13 Field Journals Top 5 General 13 Field Top 5 90-93 00-03 90-93 00-03 00-03 00-03 0.09 0.21 0.19 0.29 0.23 0.35 (2.6) (6.1) (7.5) (11.6) (8.2) (17.4)
SchoolTop5Pubs in Last Decade
0.15 (0.8)
-0.44 (2.3)
0.84 (5.4)
0.46 (2.9)
0.03 (0.2)
0.82 (6.3)
Constant
-1.13 (9.5) 0.01 767
-1.19 (11.2) 0.02 755
-1.51 (14.0) 0.07 767
-1.55 (15.3) 0.09 755
-1.49 (-25.1) 0.02 2050
-2.08 (30.6) 0.13 2050
Pseudo R2 N t-statistics in parentheses.
Table 8: Publications as a function of author and school characteristics The first two columns report coefficients from negative binomial regressions of the author’s field journal publications in the first four years of a decade on author- and school-level publication counts for the preceding decade. The results bolster the view that the publication decline noted in Fact 1 is a top school phenomenon rather than a top author phenomenon. The author-level variable indicates that authors with impressive publication records are not withdrawing from publishing in field journals. The school-level variable, which was insignificant in 1990-1993 is negative in 2000-2003 indicating that authors from top schools are now publishing less in field journals than are authors from less prestigious schools who have comparable publication records. The third and fourth columns report similar regressions examining general-interest publications in 1990-1993 and 2000-2003. Again, there is nothing to suggest that authors with strong publication records are withdrawing from publishing in general-interest journals. The school-level variable is positive and significant for both decades. It is somewhat smaller in the second decade, but this difference is not significant. The fifth and sixth columns examine the robustness of the above regressions to the M¨ obius, who collected it for papers beyond an author’s first in a decade for use in M¨ obius and Rosenblat (2004). The restriction of the sample in the second decade is designed to make the regressions comparable, but some potential differences remain: the maximum over schools is potentially taken over a larger set in the second decade and school-level counts are higher because they are not missing for first publications. To minimize the latter difference, the school counts are normalized to have a maximum of one in each decade.
24
sample selection: they reestimate the models in the second and fourth columns on the full sample of authors with at least one general interest publication in the 1990’s. The coefficients on the author-level variables are similar to those reported earlier. The schoollevel variable is now unrelated to field journal publications. This evidence in this section is problematic for both the slowdown and decline-in-fieldjournal-quality theories. Under the slowdown theory, one would have expected that the authors who were publishing the largest number of general-interest papers would have been most affected by the slowdown and would have experienced the largest decline in field journal publications. In the decline-in-field-journal-quality theory one would probably have expected that authors with the strongest publication records would be most likely to regard diminished field journals as not worth publishing in. The data are consistent with a version of the decline-in-peer-review theory in which it is being in a top department, rather than having a strong publication record, that enables an author to attract attention for his or her work without publishing it in a top journal. In my summary Table 3 I’ve put –’s in the slowdown and decline-in-field-journal-quality columns and a + in the decline-in-peer-review column. It should be understood that this + is only supporting one possible variant of the theory.
5
Citation Data
Citations are an obvious source of information on the dissemination of research. They are also used as a quality metric. The citation data discussed below was compiled by collecting all citations made in 1994 and 2004 by twenty-one journals: the five top general interest journals; the thirteen field journals; and three of the “invited” journals (Journal of Economic Perspectives, Journal of Economic Literature, and the Papers and Proceedings issue of the AER.) This has several benefits relative to relying on ISI citation counts: it avoids some of the problems with intertemporal comparability caused by the proliferation of journals; it provides some focus on important citations; and it allows me to construct measures of citations to unpublished as well as published works. Obviously, a number of limitations remain and new limitations are introduced.24 24
Most prominently, the raw data from which citations are tabulated only includes the last name and initials of the first author. I deal with this differently in different parts of the analysis, but many of the
25
5.1
Journal citation counts
Journal-level citation counts are obviously relevant to the decline-in-field-journal-quality theory. The top panel of Table 9 reports per-article citation counts for recent articles from 1994 and 2004. More precisely, the entry for Journal X in the 1994 column is the number of times that 1994 articles in the 21- journal set cited an article in Journal X from 1984 or later, divided by the total number of articles Journal X published in 1984-1993.25 Cites/art 1994 2004 Top 5 Journals QJE 0.79 1.75 Econometrica 1.28 1.06 REStud 0.68 0.98 JPE 1.02 0.88 AER 0.63 0.87 Journal
Invited Journals NBER Macro Ann. 1.33 JEL 0.75 Brookings 0.63 JEP 0.33 AEA P&P 0.25 Carnegie-Rochester 0.20
Journal set Top 5 Field 13 Invited
1.94 0.88 0.62 0.39 0.32 0.22
Cites/art 1994 2004 Field Journals J Monetary Ec 0.69 0.59 J Finance 0.41 0.56 J Intern’l Ec 0.33 0.48 RAND J Ec 0.66 0.45 J Labor Ec 0.32 0.40 Games Ec Behav 0.62 0.37 J Econometrics 0.36 0.33 J Public Ec 0.28 0.33 J Econ Theory 0.43 0.31 JLEO 0.34 0.30 J Law and Ec 0.31 0.27 J Urban Ec 0.17 0.27 J Development Ec 0.09 0.20 Journal
21 journal cites 1994 2004 0.88 1.11 0.39 0.37 0.58 0.73
Top 5 1994 0.32 0.07 0.17
cites 2004 0.39 0.08 0.17
Table 9: Per article citation counts for recent articles in various journals: 1994 and 2004 The bottom panel of Table 9 summarizes this data by reporting means for each journal category and also provides comparable figures that only count citations that appear in one “counts” reported below should in no way be thought of as aggregations of accurate counts of individuals’ citations. 25 The raw data do not distinguish between regular AER articles and those in the Papers and Proceedings issues, nor do they distinguish between citations to articles in the Carnegie-Rochester series and articles in the Journal of Monetary Economics after the former’s incorporation into the latter. In each case, I apportion all references between the two components by using the relative frequencies for articles that can be definitively matched to an article in one of the two components.
26
of the top five journals. The 21-journal counts portray the field journals as declining in influence relative to both the top general interest journals and the invited journals. This is not a very robust result, however. In the 5-journal counts the field journals are gaining slightly on the invited journals and falling only slightly farther behind the general interest journals. There is heterogeneity within each category of journals. The QJE had a huge increase in citations and became the most-cited general-interest journal. REStud and AER also made substantial gains to achieve near-parity with Econometrica and JPE. All six “invited” journals show gains from 1994 to 2004. The heterogeneity here is that whereas most of the gains are relatively small, the NBER Macroeconomics Annual shows a large increase. It is more cited on a per-article basis than any general-interest journal. There is no consistent trend in the field journal category: five journals gain and eight journals lose citations. The set of five field journals that gained in citations includes the two field journals that had an increase in their top-five author shares across decades and two that did the next best at holding on to their top-five authors. In Table 3 I’ve recorded this section as providing support for the decline-in-field-journals theory because both the overall decline in field-journal citations and the relationship between which journals lost top-department authors and which journals lost citations are consistent with this theory. The strength of the support can be regarded as weak, both because the patterns themselves are not very strong and because the causation could run in the other direction.
5.2
Departmental citation counts
Departmental citation counts were tabulated in a two-step process. I first produced counts of all citations to each last name-initial pair. I then computed each department count as the sum over all last name-initial pairs that corresponded to the last name-initial of one of their faculty members. This has several obvious limitations.26 I hope that measurement errors are largely orthogonal to the comparisons I will be making across departments and 26
Three of the main ways in which this calculation departs from the idea are: authors are getting credit for citations made to other economists who share their last name-initial; authors are getting no credit for coauthored papers on which they are not the first author; and the departmental faculty lists only include faculty members who published a paper in one of the five general-interest or thirteen field journals in a four-year period and therefore omit citations to faculty members who do not meet this criterion.
27
over time. Table 10 reports average citations per faculty member for ten departments and for other authors with a recent publication in a top general interest or top field journal. The first two columns tabulate all citations made to each author in 1994 and 2004 (in the set of 21 journals and subject to the caveats above). One fact that stands out is that Harvard is doing extremely well in citations. Its citations are up by 65% from 1994 to 2004.27 It has moved from fourth on the list to first. Authors from the other top departments are not doing as well. The other top-five departments as a whole experienced a decline in per author citations. Authors from departments 6-10 gained 15% on average. Authors from other schools gained 10%, reflecting in part that the 21 journals considered make more total citations in 2004 than in 1994.
Econ. Dept. Harvard Chicago MIT Stanford Princeton Yale Berkeley Pennsylvania Northwestern School Z Other Harvard Depts. 2-5 Depts. 6-10 Other
Average citations per author Citing journal/cited paper set: 21 jrnls/any Top 5/any 21/recent 1994 2004 1994 2004 1994 2004 18.9 31.2 6.5 10.1 7.0 7.1 36.1 30.8 11.8 9.9 8.5 5.5 24.7 27.9 8.5 9.1 8.1 7.6 15.6 13.9 5.9 3.6 4.4 2.9 19.8 18.4 6.9 5.5 7.8 5.8 13.4 12.5 4.6 3.9 4.5 3.1 16.4 17.5 4.2 3.8 5.6 4.1 7.6 8.2 2.3 2.8 2.8 2.2 9.3 15.4 3.0 5.0 3.8 4.5 5.9 7.4 1.9 2.5 1.7 2.3 3.0 3.3 0.7 0.8 1.2 1.1 18.9 31.2 6.5 10.1 7.0 7.1 22.6 21.6 7.8 6.6 7.1 5.3 10.5 12.0 3.2 3.5 3.6 3.2 3.0 3.3 0.7 0.8 1.2 1.1
Number of authors 1994 2004 49 43 19 23 29 36 28 36 36 44 35 29 29 36 36 29 29 25 29 39 3285 4282 49 43 110 137 156 157 3285 4408
Table 10: Departmental citation counts: average citations per faculty member One frequent concern that comes up in discussing citation counts is that the usual counts are dominated by citations made by obscure journals. The focus in this paper on citations 27
A bit less than one-third of the per-author growth is due to the decrease in the denominator. Part of this could be an artifact of omitting nonpublishing authors from the calculation.
28
in 21 journals should alleviate this concern, but I address it further by reporting, in the third and fourth columns, citation counts that only include citations appearing in one of the top five general interest journals. These give a similar picture: Harvard’s citations are way up; citations to the other top five departments are down; citations to departments 6 – 10 and to other authors are up slightly.28 Citations obviously measure lifetime achievement and need not be closely related to recent productivity. To provide something closer to a measure of the impact of authors’ recent research, the fifth and sixth columns provide tabulations that only include citations to items (published or not) cited as dating to the previous four years, e.g. the 1994 column reports 1994 citations to items with dates in 1990-1993. Here, Harvard is the only top-five department showing a (now small) per capita increase. Departments 6-10 and other authors also show declines in this measure. An important factor in summarizing this data is that the patterns at Harvard are different from those at the other top five departments. Hence, the data lead to conflicting conclusions. The Harvard data are more consistent with a decline in the necessity of peer review than with a decline in relative department quality. The opposite is true of the data on the other departments. In Table 3 I have indicated this by placing +/– symbols in both columns.
5.3
Paper-level citation database
In this section I use data on citations at the paper level to enrich the above descriptions and to address additional questions. I focus on how citations covary with the journal in which a paper is published and with the author’s institution and whether there is a change over time in these relationships. My paper-level database includes 1994 citation counts for all papers published in 19901993 (in one of the 23 journals studied) and 2004 citation counts for all papers published in 2000-2003. I examine how citations are related to journal- and author-characteristics using negative binomial regressions, e.g. Citesi ∼ Poisson(µi ) 28
It may be interesting to note that here again, Yale and Berkeley look like the top five and Pennsylvania, Northwestern, and School Z look somewhat different.
29
log(µi ) = β0 + β1 AuthorT op5Schooli + β2 Author6-10Schooli +β3 F ieldJourali + β4 InvitedJournali +β5 OtherCharacteristicsi + AgeDummies + �i , with �i is a Γ(θ, θ)-distributed random variable. This can be thought of as similar to estimating a simple regression with log(Citesi ) as the dependent variable.29 The dependent variable Cites in the 1990’s (2000’s) regression is the number of citations that each paper published in 1990-1993 (2000-2003) received in 1994 (2004). In the base model, the main explanatory variables are dummy variables for the type of journal (top general interest is the omitted category) and dummies for whether the author is in a top five or 6-10 ranked economics department. Three paper characteristics (in addition to year dummies) are included as control variables: the log of the order in which the paper appears in its issue; the length of the article; and the number of authors. Coefficient estimates and standard errors for the base model are presented in the first two columns of Table 11 with t-statistics in parentheses. The estimated coefficients on the control variables bring out several interesting and potentially relevant facts. First, the order in which a paper appears in its journal issue is a significant predictor of citations.30 This indicates that editors are able to predict which articles are likely to be more influential and/or that more readers look at articles that appear earlier in a journal issue. Second, the coefficient on the NumAuthor variable indicates that papers with more authors are more widely cited.31 One possible interpretation of this result is that citations reflect how extensively authors “market” a paper as well as the paper’s inherent quality. The coefficients on the age dummies indicate that knowledge of papers diffuses sufficiently quickly so that three-year old and four-year old papers are cited at about the same rate. AuTop5School is the fraction of a paper’s authors who are faculty members in a top five economics department. Papers by authors in the top departments are more widely cited in each decade. This could be attributed to authors in top departments’ having an advantage in marketing papers or to differences in average quality (that are not fully reflected in how 29 See Hausman, Hall and Griliches (1984) and section 19.9.4 of Greene (1997) for more on this and other models for count data. 30 The Order variable is one for the lead article, two for the second article, etc. 31 Laband (1986) and Johnson (1997) find a similar relationship in other datasets. Medoff (2003) does not.
30
Log(Order) Pages NumAuthor Age 3 Age 2 Age 1 Constant AuTop5School Au6-10School FieldJournal InvitedJournal FldJrnl × Top5Sch FldJrnl × 6-10Sch FldJrnl × Other InvJrnl × Top5Sch InvJrnl × 6-10Sch InvJrnl × Other 10 School Dummies Journal Dummies Pseudo R2 Number of Obs.
Dependent Variable: Citations in 1994 or 2004 1990-93 2000-03 1990-93 2000-03 1990-93 2000-03 -0.16 -0.17 -0.16 -0.17 -0.21 -0.25 (4.5) (5.5) (4.4) (5.5) (5.3) (7.3) 0.03 0.02 0.03 0.02 0.04 0.03 (10.5) (9.9) (10.6) (10.0) (12.2) (9.8) 0.20 0.14 0.19 0.14 0.19 0.12 (4.6) (4.1) (4.5) (4.0) (4.5) (3.4) 0.02 -0.04 0.02 -0.05 0.03 -0.03 (0.3) (0.6) (0.2) (0.7) (0.3) (0.5) -0.14 -0.31 -0.15 -0.31 -0.17 -0.29 (1.8) (4.4) (1.8) (4.4) (2.2) (4.2) -0.77 -0.75 -0.77 -0.76 -0.77 -0.73 (8.7) (9.7) (8.7) (9.7) (8.9) (9.5) -0.86 -0.56 -0.87 -0.52 -0.92 -0.22 (6.0) (4.4) (6.0) (4.0) (5.5) (1.5) 0.61 0.48 0.55 0.25 (6.4) (5.2) (4.2) (1.9) 0.41 0.10 0.57 0.09 (3.7) (0.8) (3.5) (0.5) -0.87 -0.94 (13.6) (16.0) -0.74 -0.50 (8.0) (5.9) -0.76 -0.29 0.02 0.78 (3.6) (1.4) (0.1) (3.7) -1.00 -0.83 -0.20 0.25 (4.2) (3.2) (0.8) (0.9) -0.87 -1.02 (12.0) (15.5) -0.57 -0.41 0.32 0.09 (2.7) (2.0) (1.4) (0.4) -1.26 -0.87 -0.38 -0.53 (4.4) (2.7) (1.2) (1.6) -0.69 -0.48 (6.3) (4.7) No No No No Yes Yes No No No No Yes Yes 0.08 0.07 0.08 0.07 0.10 0.09 4580 4970 4580 4970 4580 4970
t-statistics in parentheses. Table 11: Paper-level citation regressions
31
journals order papers within an issue). I find a similar effect for department 6–10 authors in the early 1990’s, but not in the 2000’s. FieldJournal and InvitedJournal are dummy variables for papers appearing in field and invited journals. Papers in both types of journals are less cited on average than papers appearing in top general-interest journals. The coefficient estimates of about -0.9 indicate that papers in field journals receive approximately 60% fewer citations than papers in top general-interest journals. This difference appears to be fairly stable over time (again not providing much support for the decline-in-field-journal-quality theory). Invited journals are also well behind top general-interest journals, but appear to be gaining somewhat. The regressions in the third and fourth columns of Table 11 add interactions between the journal (Top 5, Field and Invited) and author affiliation (Top 5, 6–10, Other) classifications. The coefficient on AuTop5School now measures the extra citations that accrue to authors from top-five departments when publishing in the top general-interest journals. Papers by authors from top departments were substantially more widely cited than other papers in top general-interest journals in the 1990’s, but this effect has declined in the last decade and is no longer statistically significant. This could reflect a decrease in dissemination advantages or a decrease in relative quality. A comparison between the coefficients on the Field Journal × Department Category interactions indicates that papers by authors in top five departments receive many more citations than other papers in the same field journal.32 This is consistent with the hypothesis that authors from top schools are better able to gain attention for their work without publishing it in top general interest journals.33 Note, however, that the estimates on the InvitedJournal interactions do not follow this pattern. One aspect of these findings that is a little puzzling is that they suggest that citations to papers by economists in top departments are now not very sensitive to where the paper is published (the causal effect of publishing the same paper in a field journal must be less than e−0.27 if the general-interest papers in our sample are of higher quality than the field journal papers). This must be reconciled with the finding that authors from top departments are publishing fewer papers in these journals. Two possible lines of argument are that top-five 32
To make this comparison one also needs to add in the AuTop5School coefficient. Part of the gain in citations could also be due to a selection effect: the decline in field journal publications could be due to top-department authors only publishing their best field-journal papers in those outlets. 33
32
authors may be primarily publishing in top general interest journals to promote their fields or maintain their reputations, and that the citation penalty from publishing in nonjournal outlets may also be getting smaller. A striking result of the previous section was that Harvard is doing relatively well in citations in a period when it is doing relatively poorly in top-journal publications. This naturally raises the question of whether this is due to gains in per-article citations outweighing the drop in top-journal publications, or whether it is due to Harvard’s garnering more citations on papers that are not in top journals. The fifth and sixth columns of Table 11 address this question by adding dummies for each top-ten school. The regressions also include (unreported) journal dummies and interactions between top-department and journal-class dummies. Hence, the coefficients on the school dummies reflect the citations accruing to papers the school published in top general-interest journals relative to other papers in the same journal, and citations accruing to papers the school published in field and invited journals relative to papers in those journals by members of other top departments. The school dummies from these regressions are reported separately in Table 12.
Harvard Chicago MIT Stanford Princeton Yale Berkeley Pennsylvania Northwestern School Z
School Dummies From Citation Regressions 1990-93 2000-03 0.68 (3.6) 0.18 (0.9) 0.65 (2.6) 0.37 (1.5) 0.54 (2.5) 0.22 (1.1) 0.42 (1.4) -0.46 (1.8) 0.37 (1.9) 0.37 (1.9) 0.59 (2.3) -0.33 (1.1) 0.63 (2.5) 0.37 (1.5) 0.35 (1.4) 0.14 (0.5) 0.67 (2.6) 0.37 (1.4) 0.48 (1.5) -0.04 (0.1)
t-statistics in parentheses. Table 12: School dummies from paper-level citation regression The results indicate that Harvard’s strong recent citation performance is not due to citations to its top journal publications: the point estimate on the Harvard dummy is smaller in the later period than in the earlier period and indicates that Harvard is not
33
gaining relative to MIT, Princeton and Chicago. The standard errors are such that the cross-coefficient comparisons are not statistically significant, but this does not really matter for the above conclusion – the sample here is the full set of papers in the 23 journals in 2000-2003, which was the period for which Harvard was shown to be doing well in the final column of Table 10.) I conclude that Harvard’s relatively strong citation record must be attributable to its receiving many citations for papers that are not in top journals.34 The fifth and sixth columns also provide some evidence that results noted earlier are robust by showing that they hold across departments and do not go away when a full set of journal dummies is included. For example, the regressions again indicate that top departments are receiving many citations for their field journal publications, and show that the pattern of getting fewer citations for top general interest publications appears to be consistent across schools. One conclusion of this section seems fairly clear: the data seem inconsistent with the notion that authors in top departments are shunning field journals because these journals are getting worse and no longer provide sufficient dissemination. The other conclusions are less clear. Several observations are consistent with the idea that authors at top schools may increasingly be able to attract attention without publishing in top journals. The significance of the number of authors and the author’s institution in the citation regressions provides evidence that nonjournal dissemination has always been important. Both the fact that Harvard’s strong recent citation performance appears to be due to citations to papers not published in top journals and the fact that the general interest-field journal citation gap is narrowing for authors at top schools suggest that the importance of publishing in the best journals is declining over time. I put a +/– in the decline in peer review necessity column, however, because the results on relative citations of general interest and field journal publications is awkward to reconcile with top departments’ concentrating their effors on publishing in general interest journals. The evidence is also mixed on the declinein-top-department-quality theory. The citation declines on general-interest publications could be taken to suggest a quality decline, but the opposite results on citations to papers in field journal have the opposite implication. 34
These unpublished papers, of course, may include papers that will eventually be published in top journals.
34
6
Conclusions
I started this paper by pointing out two trends: economists in several highly-regarded departments are publishing fewer papers in the top field journals; and Harvard’s economics department is also publishing fewer papers in the top general interest journals. Several pieces of evidence bolster the view that one factor contributing to these trends is that the role of journals in disseminating research has been reduced. One is that the citation benefit to publishing in a top general-interest journal now appears to be fairly small for top-department authors. Another is that Harvard authors appear to be quite successful in garnering citations to papers that are not published in top journals. The fact that the publication declines appear to be a top-department phenomenon (as opposed to a prolific-author phenomenon) suggests that a top-department affiliation may be an important determinant of an author’s ability to sidestep the traditional journal system. Other potential explanations for the trends also appear to be relevant. The slowdown of the publication process continued through the nineties. It is natural that this would lead authors to cut back on the number of papers they subject to peer review and that the best papers would be given highest priority. The fact that top-department authors continue to publish in special issues of field journals (and that we see many publications in invited journals and nonjournals) suggests that the arduousness of the publication process is playing a role in deterring submissions. The changes that have occurred over the past decade are modest in magnitude. Economists at top departments are still spending a great deal of effort publishing in top peerreviewed journals and publishing many papers there. One could imagine, however, that much larger changes will be seen in the near future. Technologies for disseminating papers will continue to improve. More top economists may realize that the publication hassles they have been enduring are not necessary. The peer-review process may also be subject to unravelling: as more top economists withdraw from the process, the signal that publication in a given journal provides is devalued, and this may lead to further withdrawals. Even a partial unravelling could have a significant impact on the course of economic research. For example, if only the top general-interest journals maintain their stature, then more economists may concentrate on “general interest” research and decline to make the kinds of
35
incremental contributions to sophisticated literatures that appeal relatively more to those who are experts on a topic. Indeed, another potential line of explanation for the facts presented here is that top departments may be focusing on projects that are of greater “general interest” but of less interest to specialists in any particular field. One could imagine that new institutions may arise and perform many of the same functions as the current peer-review system more efficiently. Given how central peer-review has been to academic research over the past century, however, the thought that the current system might collapse before any successor is clearly established is troubling.
36
References Azar, Ofer H. “The Review Process in Economics: Is it Too Fast,” Southern Economic Journal, 72 (2), 482–491, 2005. Azar, Ofer H. “The Slowdown in First-Response Times of Economics Journals: Can it Be Beneficial,” Economic Inquiry, 45 (1), 179–187, 2007. Bergstrom, Theodore C., “Free Labor for Costly Journals,” Journal of Economic Perspectives, 15, 183–198, 2001. Colander, David. “Research on the Economics Profession.” Journal of Economic Perspectives 3 (Autumn), 137–148, 1989. Ellison, Glenn. “Evolving Standards for Academic Publishing: A q-r Theory.” Journal of Political Economy 110 (5), 994–1034, 2002a. Ellison, Glenn. “The Slowdown of the Economics Publishing Process.” Journal of Political Economy 110 (5), 947–993, 2002b. Gans, Joshua Publishing Economics: An Analysis of the Academic Journal Market in Economics. London: Edward Elgar, 2000. Greene, William H. Econometric Analysis. Prentice Hall, 1997. Hausman, Jerry, Bronwyn Hall and Zvi Griliches. “Economic Models for Count Data with an Application to the Patents-R&D Relationip,” Econometrica 52, 909–938, 1984. Johnson, Dan. “Getting Noticed in Economics: The Determinants of Academic Citations,” American Economist, 41 (1), 43–50, 1997. Kim, E. Han, Adair Morse, and Luigi Zingales. “Are Elite Universities Losing Their Competitive Edge,” mimeo, 2006. Laband, David N. “Article Popularity,” Economic Inquiry, 24, 173–180, 1986. Laband, David N. and Robert D. Tollison. “Intellectual Collaboration,” Journal of Political Economy, 108 (3), 632–662, 2000. McCabe, Mark J., Aviv Nevo, and Daniel L. Rubinfeld, “Academic Journal Pricing and the Demand of Libraries,” American Economic Review 95 (2), 447–452, 2005. McCabe, Mark J. and Christopher M. Snyder, “A Model of Academic Journal Quality with Applications to Open-Access Journals,” American Economic Review 95 (2), 453–458, 2005. Medoff, Marshall H. “Collaboration and the Quality of Economics Research,” Labour Economics, 10, 597–608, 2003. M¨obius, Markus and Tanya Rosenblat, “Getting Closer or Drifting Apart,” Quarterly Journal of Economics 119 (3), 971–1009, 2004.
37
Oyer, Paul. “Initial Labor Market Conditions and Long-Term Outcomes for Economists,” Journal of Economic Perspectives 20 (Summer), 143–160, 2006. Stigler, George J. and Claire Friedland, “The Citation Practices of Doctorates in Economics,” Journal of Political Economy, 83, 477–508, 1975.
38