iOverbook: Intelligent Resource-Overbooking to Support Soft Real-time Applications in the Cloud Faruk Caglar and Aniruddha Gokhale Department of Electrical Engineering and Computer Science Vanderbilt University, Nashville, TN 37235, USA Email: {faruk.caglar, a.gokhale}@vanderbilt.edu
Abstract—Cloud service providers (CSPs) often overbook their resources with user applications despite having to maintain service-level agreements with their customers. Overbooking is attractive to CSPs because it helps to reduce power consumption in the data center by packing more user jobs in less number of resources while improving their profits. Overbooking becomes feasible because user applications tend to overestimate their resource requirements utilizing only a fraction of the allocated resources. Arbitrary resource overbooking ratios, however, may be detrimental to soft real-time applications, such as airline reservations or Netflix video streaming, which are increasingly hosted in the cloud. The changing dynamics of the cloud preclude an offline determination of overbooking ratios. To address these concerns, this paper presents iOverbook, which uses a machine learning approach to make systematic and online determination of overbooking ratios such that the quality of service needs of soft real-time systems can be met while still benefiting from overbooking. Specifically, iOverbook utilizes historic data of tasks and host machines in the cloud to extract their resource usage patterns and predict future resource usage along with the expected mean performance of host machines. To evaluate our approach, we have used a large usage trace made available by Google of one of its production data centers. In the context of the traces, our experiments show that iOverbook can help CSPs improve their resource utilization by an average of 12.5% and save 32% power in the data center. Keywords-resource overbooking, cloud computing, soft realtime performance.
I. I NTRODUCTION Resource overbooking [1], [2], [3], [4] is a common practice adopted by Cloud Service Providers (CSPs) to increase resource utilization of the servers in a data center and reducing the number of physical servers that are powered on. The outcome for the CSPs is a profitable business model and lower energy bills due to lesser number of servers being used. Resource overbooking entails committing more resources, such as CPU and memory, than are actually available on the physical host machines to the applications – in our case more virtual machines (VMs) that host user applications – that are packed onto physical servers than can actually fit. The resource overbooking technique is a feasible option for CSPs to adopt because cloud users often tend to overestimate the resource requirements for their applications; in reality they use just a fraction of the requested (and hence allocated) resources. This claim can be validated by observing the dynamics of a production data center whose usage trace is made available by Google Inc [5]. After analyzing the actual CPU usage, the
host machine CPU capacity, and the requested CPU capacity of the several host machines in the cluster trace data, we observed that the actual CPU usage of a task is much lower than the allocated amount of CPU, which clearly indicates that users overestimate their resource needs. Without overbooking, this situation yields very low resource utilizations in data centers, which is detrimental to the CSP as well as to the environment. It is estimated that in Google’s data centers, the resource utilization is maintained between 40-60% whereas this percentage is around 7-25% in other data centers [6]. To enable overbooking the servers of data centers that support virtualization, most well-known hypervisors, such as Xen, KVM, and VMware ESX Server support a configuration option for resource overbooking ratios. Even the cloud infrastructure software that manages the cloud platforms, such as OpenNebula, OpenStack, and Eucalyptus allow overbooking. For example, OpenStack has a feature for allowing up to 16:1 and 1.5:1 CPU and memory overbooking ratios, respectively. A 16:1 CPU overbooking ratio means that one physical CPU (pCPU) core can be overbooked by up to sixteen virtual CPU (vCPU) cores. Techniques, such as transparent page sharing, memory ballooning, memory compression, and swapping to disk are some of the methods that hypervisors utilize to make memory overbooking possible [7]. The resource overbooking approach adopted by CSPs tends to be suitable for enterprise applications where most jobs are of the batch processing type and for whom throughput is more important. However, as more applications with soft real-time requirements, such as airline reservations, video streaming (e.g., Netflix), real-time stream processing, and massive open online courses, get hosted on the cloud, resource overbooking may cause significant jitter giving rise to unpredictable performance, which is not acceptable for this class of applications. Moreover, in accordance with the Service Level Agreements (SLA) between the CSP and the customer, service providers have to assure certain performance requirements, such as response time and availability, which is hard to assure without a systematic approach to resource overbooking. At one end of the spectrum of overbooking possibilities lies lower overbooking ratios, which can result in high satisfaction for cloud users, but can be detrimental to CSPs who would not be effectively and economically utilizing their resources. At the other end of the spectrum exist higher and arbitrary overbooking ratios, which might result in CSPs utilizing
their resources effectively thereby saving on energy costs and making their services more profitable, however, the soft realtime systems hosted in the cloud will suffer from not receiving their desired quality of service (QoS) due to the high resource contention and interference caused by overbooking [8], [9], [10], [11]. The key challenge lies in systematically identifying effective overbooking ratios which will make the right trade-offs in meeting these conflicting objectives. Note that since cloud data centers are made up of heterogeneous machines, a single overbooking ratio may not be effective. Finally, since the cloud environment is highly dynamic, an offline computation of overbooking ratios is not applicable. In the current state of the art, system administrators determine overbooking strategies for their data centers by analyzing the workloads of the VMs through resource monitoring applications or by basing their decisions on earlier studies [4] on optimum overbooking ratios for CPU, memory, and disk . However, none of these contemporary approaches might be appropriate for all the CSPs because of the workload heterogeneity and the risks of errors due to human involvement. These limitations call for an online and autonomous solution. To address these limitations, this paper presents iOverbook, which provides an autonomous, online and intelligent, performance-aware overbooking strategy for heterogeneous and virtualized datacenters hosting soft real-time applications. iOverbook autonomously forecasts asymmetric overbooking ratios, i.e., an overbooking ratio per host machine in the data center, by carefully considering the historic resource usage of the applications and not jeopardizing the performance requirements of the soft real-time systems. Specifically, it predicts the mean CPU and memory usage of the physical host machine a future specified time interval – in our case an hour – by utilizing historic resource usage patterns along with some other features, such as CPU capacity, memory capacity, and requests for CPU and memory, and employing machine learning algorithms. Overbooking ratios for the next hour for CPU and memory are then computed based on a mathematical formula. iOverbook continues to adjust these ratios till they converge to a precise value, which will assure certain QoS levels for the hosted applications. The prediction window then slides to the next hour. Note that resource overbooking can cause performance interference and affect VM placement, however, these challenges are investigated in our ongoing work [12]. The research contributions in this paper are summarized below: • It presents an intelligent and autonomous, performanceaware overbooking strategy for each host machine in heterogeneous virtualized datacenters that satisfies soft real-time application QoS (See Section III). • Through experimental validations, it analyzes how resource utilization levels can be improved and power consumption reduced in the cloud data centers by utilizing iOverbook (See Section IV). The rest of this paper is organized as follows: Section II
deals with relevant related work comparing it with our contributions; Section III presents iOverbook in detail; Section IV evaluates the effectiveness of iOverbook; and finally Section V presents concluding remarks alluding to future work. II. R ELATED W ORK This section compares related work synergistic to our work. Predicting future resource usage of VMs based on historic data is a significant aspect of resource overbooking for which our work has leveraged machine learning as a technique. Our decision was based on the observation that machine learning-based approaches have been widely used in different domains for forecasting the future. For example, in the energy domain, [13] predicts future usage of electrical consumption and [14] predicts hot water production, respectively. In the grid and cloud domain, [15] predicts future workload and [1] predicts resource utilization patterns. Moreno et al. [1] presented a neural network-based overallocation strategy to increase the energy efficiency in data centers and satisfy performance requirements of real-time applications. The mechanism presented in that work predicts the customer’s resource utilization based on historic data and computes the amount of resources that will be allocated to a VM by employing cost-benefit analysis and an overallocation algorithm. The work in that paper differs from our work in that it does not provide per-host resource overbooking ratios as we do. However, the forecasting of resource consumption has similarity to our work. Tomas and Tordsson [16] proposed a cloud computing management framework comprising admission control for horizontal elasticity (i.e., whether to accept more VMs) and scheduling techniques for vertical elasticity (e.g., CPU, memory, and bandwidth). Additionally, they assumed that no SLA violations occur if the used capacity is within the bounds of the physical host machine. This might not always be the case due to the resource contention and interference effects. Our work differs from this work in two ways. First, we provide asymmetric overbooking ratios for a specified timing window (e.g., next one hour). Second, we take many parameters, such as the number of VMs on the host machine and mean CPU usage, into account to precisely predict the performance when overbooked. This significantly alleviates the performance interference problem. Our earlier work [17] developed a model predictive algorithm for workload forecasting based on which an autonomous framework for resource autoscaling for the cloud was developed. This work was also based on insights gained from usage traces; in that case from the Soccer World Cup of 1998. Although the goals of our previous and current work are performance assurance, the previous work focused on deciding how many resources are needed for a specific application and how to proactively scale them up or down based on prediction of the incoming workload. The end objective was to trade-off performance with the price the customer pays for using cloud resources. In the current work, we take a CSPcentric viewpoint where the objective is to pack as many VMs
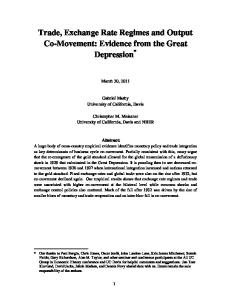
on the physical resources as possible to maximize resource utilization while being cognizant of application performance requirements. In the context of supporting real-time applications, Zhang et al. [11] proposed CPI2 to improve the performance of latency-sensitive jobs when they experience performance interference. CPI2 detects CPU performance interference incidents by automatically identifying jobs that cause the issue, and optionally shields victim jobs by throttling the triggering task. The authors prove that CPI (cycles-per-instruction) is a good metric to represent application response time. Using these insights, we have used the multiplicative inverse of CPI (i.e. instruction per cycle or IPC) as the key metric to measure the performance of tasks and develop our algorithms. The technique we have presented in this paper was made possible after gaining deep insights from a usage trace of a production data center released by Google [5]. We have leveraged the findings from recent analyses of this trace [6], [18], [19] that provide deep insights on workload characteristics, task classification, statistical profile and actual resource utilization. III. I OVERBOOK S YSTEM A RCHITECTURE AND D ESIGN Figure 1 depicts the architecture of iOverbook, which is our intelligent, machine learning-based approach for online determination of effective overbooking ratios for the machines of a data center. Specifically, we focus on the CPU and memory overbooking ratios for each individual host machine within a specified future time interval. Since the online computation of effective overbooking ratios must assure the performance of soft real-time applications, we require an understanding of how the resources are currently utilized and the properties of existing applications so that we can predict the resource usage for a future specified time interval. Once we know this information, we can determine how much overbooking is feasible and whether it is acceptable for soft real-time applications or not.
assessor components retrieve historic data from a training set repository to train their internal neural networks. iOverbook utilizes mean CPU and memory request, mean CPU and memory usage, mean performance, mean VM count, mean CPU and memory capacity, and CPU and memory overbooking ratios as input parameters. Section III-A justifies the choice of these parameters. For this paper, we have showcased how iOverbook predicts the overbooking ratios for a time window of one hour, however, this property is tunable. The rest of this section explains the three components of iOverbook. Google Inc. has released a data center cluster trace collected during a period of 29 days in May 2011 and a document called Google cluster-usage traces: format+schema, which describes the semantics, format, and schema of the trace in detail [5]. This workload consists of substantial data for more than 12,000 heterogeneous physical host machines running 4,000 different types of applications and about 1.2 billion rows of resource-usage data. We utilized all 29 days (i.e. 696 hours) of data to gain the overall insights and train internal neural networks of iOverbook. To avoid overfitting in the artificial neural networks (ANNs) of iOverbook, the noisy data in the training set was cleared out and numerous sets of training data were provided for generalized training. Most inputs in Figure 1 are obtained via collecting usage information of the resources. The overbooking ratio inputs are computed using Equation (2) for each host machine in the cluster. T otalResourceAllocated =
n X
ResourceAllocatedi
(1)
i=0
OverbookingRatio =
T otalResourceAllocated Capacity
(2)
where T otalResourceAllocated : Total amount of resources allocated to all the tasks on host machine n : Total number of the tasks ResourceAllocated : Size of allocated CPU or memory Capacity : Resource capacity of host machine
A. Resource Usage Predictor
Fig. 1: iOverbook System Architecture These responsibilities motivated a three stage design for iOverbook, which comprises: (1) a resource usage predictor, (2) an overbooking ratio prediction engine, and (3) a performance assessor. The resource usage predictor and performance
The purpose of the resource usage predictor is to predict the mean CPU and memory usage of the host machine within the next hour (or the specified time interval). A two layer, feed forward ANN is employed for prediction. ANNs have a powerful ability to model and generalize both linear and non-linear relationships between input and output, and only a hidden layer is sufficient to make any prediction [20]. The sliding window mean CPU and memory resource usage data, and mean CPU and memory requests along with the host machine’s resource capacity are the extracted features that are provided to the resource usage predictor. The structure of the ANN is depicted in Figure 2. The Levenberg-Marquardt back-propagation algorithm is employed for training the ANN. The topology of the ANN for predicting mean CPU and memory usage within the next specified time
Fig. 2: Structure of the Resource Usage Prediction Artificial Neural Network
interval – in our case one hour – is shown in the mathematical formulation of the ANN below. Input Layer : cu(t − 1), cu(t − 2), mu(t − 1), mu(t − 2), cr(t − 1), cr(t − 2), mr(t − 1), mr(t − 2), cc, mc Hidden Layer : 23 neurons Activation Function (in hidden layer) : Tangent Sigmoid Output Layer : cu(t), mu(t) Transfer Function (in output layer) : Pure Linear where t = The predicted hour cu(t − 1) = Mean CPU usage at hour t − 1 cu(t − 2) = Mean CPU usage at hour t − 2 mu(t − 1) = Mean memory usage at hour t − 1 mu(t − 2) = Mean memory usage at hour t − 2 cr(t − 1) = Mean CPU request at hour t − 1 cr(t − 2) = Mean CPU request at hour t − 2 mr(t − 1) = Mean memory request at hour t − 1 mr(t − 2) = Mean memory request at hour t − 2 cc = CPU capacity of the host machine mc = Memory capacity of the host machine cu(t) = Mean CPU usage at hour t mu(t) = Mean memory usage at hour t
The reason behind utilizing these input parameters for resource usage prediction is that they are the most common factors affecting the CPU and memory usage of a host machine. CPU and memory capacity are also provided to the ANN due to the heterogeneity of data center machines, which help convey better correlation between input and output. For testing and experimentation, 40 of the host machines which have the highest mean CPU usage in the 29 days usage of the entire cluster trace are utilized (i.e. sufficient number of
host machines have been used for the experimental study). The idea behind this filtering is to study only those host machines which hosted more compute-intensive tasks. The best performance of the ANN was produced with 23 neurons in the hidden layer using a trial-and-error approach with the mean squared error value (M SE), which is the averaged squared difference between inputs and outputs, of 0.0001. The regression (R) value, which is the correlation between inputs and outputs, is 0.9. The generated M SE and R values indicate that the resource usage predictor predicts outputs with a negligible error value, and that the output parameters of the ANN are very well correlated with its input parameters. The selection of the activation function made in the hidden layer and output layer are based upon the ANN type (e.g., back propagation dictates an activation function in the hidden layer that provides a derivative), desired output value constraints, and on trial-and-error performance results of the ANN. The predicted CPU and memory usage values along with the actual usage values for each host machine are illustrated in Figure 3. The training ANN involved using 695 hours of the cluster trace except the 696th hour. The prediction was made for the 696th hour. As seen in Figure 3, the predicted resource usage value follows the actual usage values well enough because of the decent M SE and R values. The resource usage predictor can also predict the resource demand when flash crowds occur by refining itself through learning new resource usage data. This challenge has already been addressed and discussed in our earlier work [17]. B. Overbooking Ratio Prediction Engine After the resource usage predictor predicts the CPU and memory usage for the next one hour time window, the overbooking ratio prediction engine computes the CPU and memory overbooking ratios per machine, and hands it to the performance assessor. The performance assessor component predicts the performance by using these new overbooking ratios and hands it back to the overbooking ratio prediction engine. This two way communication between the overbooking ratio prediction engine and performance assessor iterates until the predetermined convergence values (calculated manually from the historic data in trace) are satisfied. These convergence values are justified in Section IV. The details of the computation are shown in Equation (4). A discrete step size called “SecuritySlack” is used by our iterative approach to converge on an acceptable overbooking ratio. SecuritySlack(t) = Capacity(t) × SecurityP ercentage (3) Capacity(t) − SecuritySlack(t) OverbookingRatio(t) = λ × P redictedU sage(t) (4) ResourceRequest(t) = OverbookingRatio(t) × Capacity where t : The predicted hour λ : Elastic capacity to converge the best ratio
Fig. 3: Actual and Predicted Hourly Mean CPU and Memory Usage Value Comparison
if predicted performance is too high Capacity(t) : Resource capacity (e.g. CPU and memory) of a host machine at hour t SecurityP ercentage(t) : Elastic capacity on a host machine to converge the best ratio at hour t OverbookingRatio(t) : CPU and memory overbooking ratios at hour t for a host machine
C. Performance Assessor The performance assessor component is responsible for predicting the performance thereby providing an assurance that the new overbooking ratios computed by the overbooking ratio engine do not violate the SLAs. The performance assessor uses the instruction per cycle (IPC1 ) as the performance metric which means that the higher the value, the better the performance. The SLA violation is checked based on the historic maximum performance values (max) on a per-host basis. These threshold values are derived from the tracelog, however, a domain expert may also decide and assign these values. If the machine under consideration’s predicted IPC is greater than the maximum observed IPC in the trace of the same host machine reached in the cluster, iOverbook assumes that SLA will not be violated thereby providing performance assurances to soft real-time applications. If the predicted IPC violates the SLA, iOverbook does not allow overbooking that particular host machine. In Section IV, this SLA violation logic is elaborated upon by taking the standard deviation of the same type of host machines into account for tighter and more realistic performance results. The structure of the performance predictor ANN is similar to the resource usage predictor ANN in Figure 2, however, with different inputs and outputs. The topology of this ANN for predicting IPC is provided in the mathematical formulation below. It is considered that the allocated amount of resources and mean VM count on a host machine are changed once 1 “IPC”
metric is used interchangeably with the term “performance”
the overbooking ratio engine computes new ratios. Based upon newly computed ratios in Equation (4), the performance assessor is employed to check whether these new overbooking ratios may trigger any SLA violations. As long as the predicted IPC is less than the historic maximum IPC value of that host machine (i.e., a SLA violation will occur), the performance assessor increases the security percentage value in Equation (3) by 0.5% and requests new ratios from the overbooking ratio engine till the ratios converge to the values that do not violate the SLA. The security percentage is preferred as 0.5% to gradually increase the security slack value, which in turn speeds up the convergence to optimum overbooking ratios. If the predicted IPC is too high (which means that the overbooking ratios are suboptimal), iOverbook raises the λ value by 0.5% to rapidly increase overbooking ratios to the best values that do not violate the SLA. Input Layer : cr(t), mr(t), cor(t), mor(t), vm(t), cc, mc Hidden Layer : 22 neurons Activation Function (in hidden layer) : Tangent Sigmoid Output Layer : P (t) Transfer Function (in output layer) : Pure Linear where t = The predicted hour cr(t) = Mean CPU request at hour t mr(t) = Mean memory request at hour t cor(t) = CPU overbooking ratio at hour t mor(t) = Memory overbooking ratio at hour t vm(t) = Mean VM count at hour t cc = CPU capacity of the host machine mc = Memory capacity of the host machine P (t) = Mean performance at hour t
The best performance of the ANN was produced with 22 neurons in the hidden layer by a trial-and-error approach with the M SE of 0.009 and the R of 0.67. The generated
Fig. 4: Actual and Predicted IPC Results Comparison
M SE and R values indicate that the performance assessor component predicts IPC output values with a somewhat higher yet negligible error compared to our resource usage predictor ANN. The outputs of this ANN are well correlated with its inputs. The predicted IPC value along with the actual IPC values for each host machine are illustrated in Figure 4. The predicted hour is the same as the overbooking ratio prediction engine, which is chosen as the 696th hour in the time line. As can be seen from Figure 4, the predicted performance value follows the actual usage values well because of the lower M SE and good R values for each host machines in the training set. We believe that additional input parameters will help the ANN to lower the prediction errors and show better correlation. IV. VALIDATING THE I OVERBOOK A PPROACH This section validates the iOverbook approach using the Google cluster usage trace. Validation Approach: Since it is not possible to recreate the Google’s data center trace, we have used an alternate approach to validating iOverbook. We use part of the usage trace to train iOverbook. Subsequently, we use iOverbook to predict overbooking for a time interval that was not used in the training phase. The results of this prediction are then compared to the actual numbers appearing in the usage trace. To that end we have used 696 hours of usage trace data to train iOverbook’s ANNs except the 696th hour in that interval, and instead used iOverbook to predict the overbooking rates for the 696th hour (i.e., ANN is trained with the first 695 hours of data and tested to predict a future hour, which is the 696th that has not been used in the training). The predicted overbooking rates (both CPU and memory) and performance are compared to the actual overbooking and performance seen from the usage trace. In our experiments, two different overbooking ratios are computed under two different conditions: (1) if the predicted performance value (P (t)) is greater than or equal to the maximum performance value of that host machine in the trace (i.e., P (t) >= max), and (2) if the predicted performance value is greater than or equal to the maximum performance value of the same host machine and seven times the standard deviation
of this value (i.e., P (t) >= max +7σ). The motivation behind computing overbooking ratios under two different conditions is to provide results under tighter constraints. We then analyze how these predicted overbooking ratios for each host machine help to improve the resource utilization and reduce power consumption in the data center. To determine the power consumption, we have utilized SPECpower ssj2008 [21], an industrial benchmark measuring power and performance values of different computer architectures, to compute power consumption of host machines. Comparing Actual versus Predicted Overbooking and Performance: Figures 5 and 6 compare Google host machines’ actual and iOverbook’s overbooking ratios computed by the overbooking ratio prediction engine at t=696, for CPU and memory, respectively.
Fig. 5: Comparison of Google’s Host Machines’ Actual and iOverbook’s CPU Overbooking Ratios under Different Performance Considerations
Fig. 6: Comparison of Google’s Host Machines’ Actual and iOverbook’s Memory Overbooking Ratios under Different Performance Considerations In the context of the Google trace, the following inferences can be drawn from Figures 5 and 6. Overall, iOverbook was able to predict higher overbooking ratios for host machines compared to Google’s overbooking without SLA violations. (1) 38/40 host machines could have been overbooked without SLA violation under P (t) >= max condition (recall that performance is measured as IPC so any value less than the maximum performance is a SLA violation).
(2) 34/40 and 31/40 host machines could have had CPU and memory overbooking ratios greater than ten, respectively, without SLA violation under P (t) >= max condition. (3) 30/40 host machines could have been overbooked without SLA violation under P (t) >= max +7σ condition. These results are somewhat inferior compared to #1 due to a tighter performance constraint. (4) 31/40 and 24/40 host machines could have had CPU and memory overbooking ratios greater than ten, respectively, without SLA violation under P (t) >= max +7σ condition. These results are somewhat inferior compared to #2 due to a tighter performance constraint. In Figure 7, Google’s host machines’ actual (i.e, at t=696) and iOverbook’s predicted performance values associated with the overbooking ratios in Figure 5 are depicted. An identical predicted and actual overbooking ratio in the figure means that the machine is not overbooked by iOverbook. As seen from the Figure 7, there are two host machines under P (t) >= max condition and ten host machines under P (t) >= max +7σ condition that iOverbook predicted a SLA violation and did not compute overbooking ratios for those host machines and secured their actual ratios. Additionally, iOverbook flagged those cases as SLA violations and left the decision to the scheduler.
TABLE I: Estimated Host Machine Configurations [21] Actual Config.
Estimated Configuration
Platform ID/CPU/Memory
Processor Name
CPU Memory (cores) (GB)
A/1/1 B / 0.5 / 0.749 B / 0.5 / 0.4995 B / 0.5 / 0.2493 B / 0.5 / 0.1241
Xeon E5-2650L Xeon E5-2660 Xeon E5-2660 Xeon E5-2660 Xeon E5-2660
32 16 16 16 16
to packing as many tasks on as less number of machines as possible and leaving the rest of the machines at either powered off or idle mode. Actual Case is the current status of the host machines. Case-1 and Case-2 represent the status of the host machines under P (t) >= max condition representing the expected power consumption if the host machines with no tasks on it after the consolidation were powered off or remain powered on but in idle mode conditions, respectively. Case-3 and Case-4 are the same cases as Case-1 and Case-2 except they show the results under the P (t) >= max +7σ condition. TABLE II: Power Consumption Results in Test Set Total Watt Actual Case-1 Case-2 Case-3 Case-4
Fig. 7: Google’s Host Machines’ Actual and iOverbook’s Predicted Performance Value under Different Performance Considerations Improved Power Savings and Utilization due to iOverbook: The cluster trace provides obfuscated configurations of machine attributes, which does not allow us to identify and compute the exact power consumption of those host machines. However, the platform id field in the trace, which provides a sense of hardware architecture type, represents the microarchitecture and chipset version of the host machine in the cluster [5]. Therefore, we surmise the potential configuration of the machine such that it is in tune with the normalized resource capacities of the physical host machines and hardware architecture. The estimated configurations are shown in Table I. The comparison of power consumption results for different consolidation cases are shown in Table II. Consolidation refers
64 48 32 24 16
Power Values Mean Mean Watts Watts @100% @Idle 386 142 239 51.6 257 59.7 239 51.5 239 54
2909.87 1964.67 3007.97 4873.33 7204.53
Number of Servers @On 40 22 40 23 40
Number of Servers @Off 0 18 0 17 0
Number of Servers @Idle 0 0 22 0 17
Savings 0% 32% -3% 30% -3%
As seen from Table II, iOverbook helped save roughly 32% and 30% of energy for Case-1 and Case-3, respectively. However, if the host machines with no tasks on it are left in the idle state (Case-2 and Case-4), then it has a negative impact on energy consumption, which we surmise can be attributed to the power consumption of host machines in idle mode. Migration costs were not considered in this calculation. Table III compares the actual (from the trace) and iOverbook’s resource utilization effects. The “Total CPU” request value in the table is based upon the overbooking ratios computed by iOverbook. The ratio of total CPU usage over total CPU requested that may be named as overestimation ratio is used to calculate the utilization value when the host machines are overbooked with iOverbook. As seen in Table III, the actual utilization for 40 host machines in the trace was 8.7%. In contrast, the utilization level using iOverbook could have been 21.2% under P (t) >= max and 19.7% under P (t) >= max +7σ conditions, which shows an improvement of 12.5% and 11%, respectively. These utilization levels can easily be raised by manipulating the defined performance constraints, such as utilizing mean IPC rather than the maximum. Lessons from the Validation Experiments: These validation results demonstrate that adding higher standard deviations gives us less beneficial results but probably tighter and a
TABLE III: Resource Utilization Results in Test Set
137.5874 20.5
iOverbook (P (t) >= max) 333.2819 20.5
iOverbook (P (t) >= max +7σ) 310.4185 20.5
0.0130
0.0130
0.0130
1.7984
4.3564
4.0575
8.8%
21.3%
19.8%
Actual Value Total CPU Request Total CPU Capacity Total CPU Usage / Total CPU Requested Total CPU Usage Mean CPU Utilization
preferred result to assure SLAs. CSPs can utilize our technique by first training our ANNs with their own historic data and then integrating iOverbook with their actual job and VM scheduler in the data center. Therefore, the scheduler could overbook each host machine by considering the overbooking ratios provided by iOverbook. Since our approach allows runtime updates to overbooking ratios, it can adapt autonomously to changing workloads. Therefore, credit-based CPU scheduler in the Xen hypervisor could be integrated with iOverbook to determine weight and cap parameters for each host machine to dynamically. This is the focus of our future work. V. C ONCLUSION This paper presented iOverbook, which is an intelligent and online resource overbooking strategy for supporting cloudbased soft real-time applications and effective server utilization by using the insights from Google’s production data center usage trace. iOverbook employs two artificial neural networks for predicting a host machine’s future resource usage and performance. It requires historical usage data that cloud providers can provide for use in their data centers. The forecasted values are used in computing significantly better CPU and memory overbooking ratios than those used by Google in their production data center without triggering SLA violations. The prediction mechanism of iOverbook can be configured and tuned to another desired time interval rather than an hour interval. In the current work, we did not consider the potential for outliers in the available traces. Our future work will investigate effective filtering of outliers and using confidence intervals. All scripts, source code, and experimental results of iOverbook are available to download at the www.dre.vanderbilt.edu/ ∼caglarf/download/iOverbook. ACKNOWLEDGMENTS This work was supported in part by the National Science Foundation CAREER CNS 0845789 and AFOSR DDDAS FA9550-13-1-0227. Any opinions, findings, and conclusions or recommendations expressed in this material are those of the author(s) and do not necessarily reflect the views of NSF and AFOSR.
R EFERENCES [1] I. S. Moreno and J. Xu, “Neural network-based overallocation for improved energy-efficiency in real-time cloud environments,” in Object/Component/Service-Oriented Real-Time Distributed Computing (ISORC), 2012 IEEE 15th International Symposium on. IEEE, 2012, pp. 119–126. [2] S. A. Baset, L. Wang, and C. Tang, “Towards an understanding of oversubscription in cloud,” in Proceedings of the 2nd USENIX conference on Hot Topics in Management of Internet, Cloud, and Enterprise Networks and Services. USENIX Association, 2012, pp. 7–7. [3] I. S. Moreno and J. Xu, “Customer-aware resource overallocation to improve energy efficiency in realtime cloud computing data centers,” in Service-Oriented Computing and Applications (SOCA), 2011 IEEE International Conference on. IEEE, 2011, pp. 1–8. [4] (2013, Sep.) Best practices for oversubscription of cpu, memory and storage in vsphere virtual environments. [Online]. Available: https://software.dell.com [5] C. Reiss, J. Wilkes, and J. Hellerstein, “Google cluster-usage traces: format+ schema,” Google Inc., White Paper, 2011. [6] C. Reiss, A. Tumanov, G. R. Ganger, R. H. Katz, and M. A. Kozuch, “Towards understanding heterogeneous clouds at scale: Google trace analysis,” Intel Science and Technology Center for Cloud Computing, Tech. Rep, 2012. [7] C. A. Waldspurger, “Memory resource management in vmware esx server,” ACM SIGOPS Operating Systems Review, vol. 36, no. SI, pp. 181–194, 2002. [8] R. Nathuji, A. Kansal, and A. Ghaffarkhah, “Q-clouds: managing performance interference effects for qos-aware clouds,” in Proceedings of the 5th European conference on Computer systems. ACM, 2010, pp. 237–250. [9] O. Tickoo, R. Iyer, R. Illikkal, and D. Newell, “Modeling virtual machine performance: challenges and approaches,” ACM SIGMETRICS Performance Evaluation Review, vol. 37, no. 3, pp. 55–60, 2010. [10] X. Pu, L. Liu, Y. Mei, S. Sivathanu, Y. Koh, and C. Pu, “Understanding performance interference of i/o workload in virtualized cloud environments,” in Cloud Computing (CLOUD), 2010 IEEE 3rd International Conference on. IEEE, 2010, pp. 51–58. [11] X. Zhang, E. Tune, R. Hagmann, R. Jnagal, V. Gokhale, and J. Wilkes, “Cpi2: Cpu performance isolation for shared compute clusters,” in Proceedings of the 8th ACM European Conference on Computer Systems, ser. EuroSys ’13. New York, NY, USA: ACM, 2013, pp. 379–391. [12] F. Caglar, S. Shekhar, and A. Gokhale, “A Performance Interferenceaware Virtual Machine Placement Strategy for Supporting Soft Real-time Applications in the Cloud,” Institute for Software Integrated Systems, Vanderbilt University, Nashville, TN, USA, Tech. Rep. ISIS-13-105, 2013. [13] R. E. Edwards, J. New, and L. E. Parker, “Predicting future hourly residential electrical consumption: A machine learning case study,” Energy and Buildings, vol. 49, pp. 591–603, 2012. [14] T. Olsson, “Evaluating machine learning for predicting next-day hot water production of a heat pump,” in 4th International Conference on Power Engineering, Energy and Electrical Drives - IEEE POWERENG 2013, May 2013. [Online]. Available: http: //www.mrtc.mdh.se/index.php?choice=publications&id=3379 [15] M. Imam, S. Miskhat, R. Rahman, and M. A. Amin, “Neural network and regression based processor load prediction for efficient scaling of grid and cloud resources,” in Computer and Information Technology (ICCIT), 2011 14th International Conference on. IEEE, 2011, pp. 333–338. [16] L. Tom´as and J. Tordsson, “Improving cloud infrastructure utilization through overbooking,” in Proceedings of the 2013 ACM Cloud and Autonomic Computing Conference, ser. CAC ’13. New York, NY, USA: ACM, 2013, pp. 5:1–5:10. [Online]. Available: http: //doi.acm.org/10.1145/2494621.2494627 [17] N. Roy, A. Dubey, and A. Gokhale, “Efficient Autoscaling in the Cloud using Predictive Models for Workload Forecasting,” in 4th IEEE International Conference on Cloud Computing (Cloud 2011). Washington, DC: IEEE, Jul. 2011, pp. 500–507. [18] Z. Liu and S. Cho, “Characterizing machines and workloads on a google cluster,” in Parallel Processing Workshops (ICPPW), 2012 41st International Conference on. IEEE, 2012, pp. 397–403. [19] A. K. Mishra, J. L. Hellerstein, W. Cirne, and C. R. Das, “Towards characterizing cloud backend workloads: insights from google compute clusters,” ACM SIGMETRICS Performance Evaluation Review, vol. 37, no. 4, pp. 34–41, 2010. [20] B. Kr¨ose, B. Krose, P. van der Smagt, and P. Smagt, “An introduction to neural networks,” 1993. [21] (2013, Oct.) Standard performance evaluation corporation. [Online]. Available: http://www.spec.org/power ssj2008/