Internet and Politics: Evidence from U.K. Local Elections and Local Government Policies∗ Alessandro Gavazza§
Mattia Nardotto¶
Tommaso Valletti‖
September 2017
Abstract We empirically study the effects of broadband internet diffusion on local election outcomes and on local government policies using rich data from the U.K. Our analysis suggests that the internet has displaced other media with greater news content (i.e., radio and newspapers), thereby decreasing voter turnout, most notably among less-educated and younger individuals. In turn, we find suggestive evidence that local government expenditures and taxes are lower in areas with greater broadband diffusion, particularly expenditures targeted at less-educated voters. Our findings are consistent with the idea that voters’ information plays a key role in determining electoral participation, government policies and government size.
∗
We are grateful to the Editor (Nicola Gennaioli) and to three anonymous referees for insightful comments that substantially improved the paper; to Timothy Besley, Ruben Enikolopov, Leopoldo Fergusson, Matthew Gentzkow, Gilat Levy, Jo Thori Lind, Alessandro Lizzeri, Martin Peitz, Torsten Persson, Maria Petrova, Andrea Prat, Riccardo Puglisi, Jesse Shapiro, Francesco Sobbrio, David Str¨omberg, Frank Verboven, and seminar participants at several universities and conferences for useful suggestions; to Ofcom, to the Oxford Internet Institute, and to the Elections Centre at Plymouth University for providing data. § Department of Economics, London School of Economics. Houghton Street, London WC2A 2AE, United Kingdom. Email:
[email protected]. ¶ DIW Berlin, Mohrenstraße 58, D-10117, Berlin, Germany. Email:
[email protected]. ‖ Imperial College London and University of Rome II. South Kensington Campus, London SW7 2AZ, United Kingdom. Email:
[email protected].
1
1
Introduction
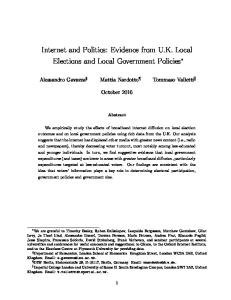
How does the internet affect the electoral process and governments’ policies? In recent years, some observers have argued that the internet is responsible, in part, for decreasing political participation, heightening ideological polarization, and reducing checks on governments (Sunstein, 2007). The goal of this paper is to shed some light on these issues using detailed data on internet penetration in the U.K. matched with both local election outcomes and local governments’ policy choices, such as expenditures and taxation. Voters’ information plays a key role in the democratic process, helping to hold elected officials accountable to their electorate. Mass media are the primary sources of information for voters, enabling them to monitor politicians and to use this information in their voting decisions. The internet has dramatically affected media markets, decreasing the costs of accessing information. At the same time, the internet has increased the availability of many forms of entertainment (such as movies, games and social media), potentially inducing individuals to substitute away from news and from traditional media, thus crowding out their political engagement (Prior, 2007).1 Notably, evidence from the introduction of then-new media in the U.S. shows remarkably different effects: Str¨omberg (2004b) documents that radio increased political participation, whereas Gentzkow (2006) shows that the introduction of television decreased it. Moreover, the extent of political participation may affect aggregate policy choices. Large increases in suffrage provide, perhaps, the most interesting historical episodes: Lott (1999) examines the growth of U.S. government spending as a result of women’s voting rights; Lizzeri and Persico (2004) show that the extension of voting franchise in nineteenth-century Britain was associated with an increase in expenditures on local public goods. Similarly, politicians’ policy choices react to voters’ information: Besley and Burgess (2002) show that the Indian government’s responses to disasters was more rapid in areas with greater newspaper circulation; Str¨omberg (2004b) illustrates that the New Deal’s federal spending in the U.S. was higher in areas with greater radio coverage; and Snyder and Str¨omberg (2010) show that U.S. congressmen who receive greater press coverage channel more federal funds to their districts. The goal of this paper is to empirically study the effects of internet diffusion on election outcomes, as well as on politicians’ policy choices. We exploit the dramatic growth of the internet in the U.K. through a rich dataset that reports the total number of local broadband subscribers in each node of British Telecom’s local distribution network. Figure 1, for example, displays that the share of U.K. households with a broadband internet connection increased from six percent in 2003 to 74 percent in 2011. Arguably, the diffusion of a new technology, such as the internet, changes people’s access to mass media; since this diffusion is heterogeneous across individuals, this variation is well suited to studying the effects of the 1
Putnam (2000) also argues that television and the internet made leisure more private, thereby reducing social interactions, social capital and voter turnout.
2
80 Broadband Penetration 20 40 60 0 2003
2005
2007 Year
2009
2011
Figure 1: Fraction of U.K. households with a broadband internet connection, 2003-2011.
new medium on electoral politics and government policy, as Str¨omberg (2004b) and Gentzkow (2006) did for radio and television, respectively. Our empirical analysis proceeds in three main stages, focusing on the effects of internet penetration on 1) local elections; 2) local-government policies; and 3) local news. More specifically, in the first stage, we study the effect of internet penetration on electoral participation by merging our database on internet penetration with data on local election outcomes in each electoral ward in England.2 Our empirical analysis faces one key empirical challenge: potential endogeneity concerns plague the identification of the effects of internet penetration on election outcomes. Internet penetration is correlated with several observable demographic characteristics (such as income and education) that are also correlated with political participation. Hence, it is also possible that some unobservable demographic characteristics could be correlated with both internet penetration and election outcomes. We seek to resolve these demand-side endogeneity concerns by using complementary identification strategies. The first one follows the insights of Altonji, Elder, and Taber (2005), as recently extended by Oster (Forthcoming), and constructs bounds on the effects of internet diffusion on voter turnout based on the correlation between observable controls and internet diffusion. The second one exploits instruments that affect the supply of broadband internet across different geographic areas and over time. More specifically, Schulman and Spring (2011) and Deljac, Randi´c, and Krˇceli´c (2016), among others, find that internet network outages are more likely to occur during rain and thunderstorms, and several U.K. regulatory reports document that the weather affects the costs of providing reliable broadband. For example, the regulated network operator Openreach (2014) argues: “Openreach access network 2
While we have data on internet penetration for the entire U.K., we have election data only for England; Section 2 describes our data in detail.
3
[...] is vulnerable to a wide range of weather variables (e.g., rainfall, high winds, lightning, etc.). The direct effect of weather damage may be the need to replace or repair assets, and this can be extensive and costly, but highly significant in the context of this market review is the consequential generation of customer fault reports and failures of service to end-users that is perhaps the most relevant issue. [...] Openreach’s ability to service end-users and access its infrastructure is severely disrupted, and extensive damage is caused to infrastructure both over and underground, causing very high fault intake rates, [...] increased costs, longer travel times and significant health and safety concerns for engineering teams. All directly raising costs for the business.” Hence, we obtain rainfall data from the U.K. Met Office, which we employ as the supply-side instrument that affects penetration across locations and over time through internet service providers’ costs, and it is, arguably, uncorrelated with demand-side unobservables. Both empirical methods imply that greater broadband penetration decreases aggregate turnout. The magnitude of this aggregate effect is non-trivial: the IV estimates indicate that a one-percentage-point increase in household internet penetration (which is broadly the order of magnitude that the local variation in rainfall implies) decreases voter turnout by approximately 0.25 percentage points. Notably, we validate our IV identification strategy through several falsification tests that use data from local elections held before the diffusion of broadband (1996-2000), and we find that rainfall had no effect (precisely estimated) on voter turnout in these pre-internet elections. The bound based on the OLS estimates is not statistically different from the IV estimate, although slightly smaller in magnitude. Moreover, we find that the decline in electoral participation is concentrated in wards with a higher fraction of individuals who have less education, are younger, and have a lower socio-economic status. Finally, we document that greater broadband penetration seems to decrease the competitiveness of elections by favoring incumbents, but it does not seem to affect parties’ vote shares. In the second stage of our empirical analysis, we aim to investigate the effect of internet penetration on local governments’ policies. To do so, we aggregate our broadband penetration measure at the level of each Local Authority (i.e., the local government in England; LA hereafter) and then merge it with data on LAs’ public finance choices. Our analysis in this stage faces several empirical challenges that we can only partially address, and, thus, we acknowledge that our results are less conclusive than those on voter turnout. Nonetheless, we report evidence suggesting that local government aggregate expenditures and local property taxes are lower in areas with greater broadband penetration. The magnitudes of these effects are, again, non-trivial: the bounds based on the OLS estimates indicate that a onepercentage-point increase in internet penetration decreases local government expenditures and taxes by (at least) 0.26 and 0.29 percent, respectively. Moreover, we present some tentative evidence that expenditures that target less-educated voters—whose participation declines the most—such as expenditures on social housing and social services, decrease the most, whereas expenditures that target more-educated individuals—whose participation declines the least— 4
such as expenditures on education, decrease the least. In the third step of our analysis, we present evidence consistent with the idea that the internet crowded out traditional media—i.e., local newspapers—with greater coverage of (local) political issues, thereby potentially decreasing political information. Moreover, we argue that it is unlikely that the decline in news consumption on traditional media has been fully compensated by an increase in online news consumption and, in particular, local news. Finally, we show that different demographic groups display stark differences in their news consumption as the internet diffuses: less-educated and younger individuals are less likely than more-educated and older individuals to use the internet to consume news. Overall, our empirical results indicate that broadband internet penetration decreases political participation, and they suggest that, in turn, the size of government decreases. Moreover, our results corroborate the idea that internet technology has acted as a substitute for legacy media, possibly decreasing political information. Furthermore, they point to the large heterogeneity of these effects across different demographic groups. Thus, our results contribute to several strands of the political economy literature. First, a growing body of papers study the role of media in politics: Str¨omberg (2004b), Gentzkow (2006), Larcinese (2007), DellaVigna and Kaplan (2007), Ferraz and Finan (2008), Prat and Str¨omberg (2005), Snyder and Str¨omberg (2010), Enikolopov, Petrova, and Zhuravskaya (2011), Gentzkow, Shapiro, and Sinkinson (2011), Drago, Nannicini, and Sobbrio (2014), and Durante, Pinotti, and Tesei (2015), among others, investigate how different media affect voters’ behavior. Within this strand of the literature, particularly related to our paper are the recent contributions of Falck, Gold, and Heblich (2014), who find that internet availability has had a negative effect on voter turnout in Germany; of Campante, Durante, and Sobbrio (Forthcoming), who find that broadband had an initial negative effect on turnout in Italian national elections, but, over time, has fostered other forms of online and offline participation; and of Miner (2015), who finds that areas with higher internet penetration in Malaysia experience higher turnout and higher turnover. However, none of these papers focuses on the heterogeneity of the effect of internet penetration on the political participation of different demographic groups, or aims to analyze any effect on government policies. Moreover, we rely on data at a finer geography, as well as data with greater detail: we exploit ward-level data on internet penetration (thus, we estimate a treatment effect), whereas Falck, Gold, and Heblich (2014) and Campante, Durante, and Sobbrio (Forthcoming) use municipal-level data on internet access (thus, they estimate an intention-to-treat effect), and Miner (2015) uses legislative district-level survey data on internet subscriptions. Our estimates of the effect of the internet on voter turnout are larger than those reported in these related papers, and perhaps these differences in data quality may partially account for these differential estimates. We also document a larger displacement of local newspapers due to the internet than that reported by Falck, Gold, and Heblich (2014), which may further account for the different magnitudes of the estimates of the effect on voter turnout. Finally, we also introduce a novel identification
5
strategy. Second, our paper also contributes to a strand of literature that connects voters’ information and participation to policy outcomes. In addition to the aforementioned papers, Besley and Prat (2006) study the effect of government media capture on policy choices; Gavazza and Lizzeri (2009, 2011) analyze how voters’ information affects taxation and expenditures and show that greater voters’ information could increase both. Finally, our paper relates to recent work on the determinants of English LAs’ policy choices. Most notably, Besley and Preston (2007) show how the electoral system allows parties to choose policies that favor their core supporters; and Lockwood and Porcelli (2013) show that LAs increased service quality and local taxation after the introduction of an incentive scheme for local governments. The paper proceeds as follows. Section 2 introduces our data. Sections 3 and 4 present our empirical analysis of the effect of broadband internet on local elections and on local government policies, respectively. Section 5 presents evidence consistent with the idea that the internet decreased (local) political information by crowding out traditional media with greater coverage of local news—i.e., local newspapers. Section 6 summarizes our interpretation of our findings and concludes. Appendices A, B, and C report additional information on local elections and on the organization of U.K. local governments, additional details on broadband markets, and additional empirical results, respectively.
2
Data
Our empirical analysis focuses on the link between internet diffusion, voting behavior, and administration of local governments in England for the years 2006-2010.3 We believe that local governments’ elections and policies provide an ideal laboratory in which to analyze any effect of the internet on electoral participation and government responses. Specifically, local elections and policies usually exhibit greater variations than national ones; for example, national elections are often dominated by more-general issues (i.e., immigration, security, foreign policy), as well as partisanship and ideology, which play a smaller role in local elections.4 In addition, local elections are often viewed as the paragon of “bottom-up” democracy, selecting civic-oriented representatives with deep community ties (Oliver, Ha, and Callen, 2012). Towards this goal, we combine data on the outcome of local elections and on the budgetary decisions of English LAs with data on the diffusion of broadband internet. We also exploit data on local-newspaper circulations to investigate the effect of internet penetration on local news consumption. We further complement these main datasets with additional data on the 3 It is important to note that an online voter registration system was introduced in the U.K. only in June 2014, so in our data, the internet did not affect electoral registers. 4 Of course, local elections may have a national dimension, and, thus, national/regional news can affect local election outcomes.
6
demographic composition of each area, as well as on its geographic and weather characteristics. These weather variables affect the costs of supplying reliable internet broadband and, thus, constitute the supply-side exogenous instruments that we exploit to identify the effect of broadband internet. We now describe all our data sources. Data on Local-Council Elections. We collect data on the outcomes of all local-council elections that took place in England from 2006 to 2010 from the Elections Centre at Plymouth University. Appendix A briefly describes the electoral system of these local-council elections, as well as the organization and the public finances of U.K. local governments. For each of the 7,707 electoral wards, the data report the turnout—defined as total votes as a percentage of the number of people registered to vote—and each party’s votes. The data also report the party (if any) that holds more than half of all seats in the council, in which case we consider that party to be in control. We also collect data on all the local elections held from 1996 to 2000—i.e., before the diffusion of broadband—which we will use to perform falsification tests that validate our identification strategy. Data on LAs’ Budgets. We gather yearly panel data on taxes and expenditures of 113 (out of 125) English unitary LAs over the period 2006-2010 from the website of the Chartered Institute of Public Finance and Accountancy (CIPFA): http://www.cipfastats.net/ cipfastats/. We exclude ten unitary LAs that were reorganized in 2008-2009 since we cannot track consistent public finance data;5 the two sui generis unitary LAs because of their special organizations and functions; and all two-tier LAs, as separate bodies make decisions about taxes and about different types of expenditures. The data report several broad categories of net current expenditures, including education, social services, housing services, transportation, and police. Since different LAs sometimes pool resources to jointly provide some services, such as transportation and police, we use the sum of current expenditures on education, housing and social services to define per capita aggregate expenditures.6 These expenditures, together, account for approximately 70 percent of total net current expenditures.7 Moreover, we use the per capita local Council Tax requirement, which is the per capita amount that a local au5 New LAs have been created in Cornwall, Durham, Northumberland, Shropshire and Wiltshire. Cheshire split into two LAs: Cheshire East, and Cheshire West and Chester. Bedfordshire split into Bedford Borough and Central Bedfordshire. 6 The Health and Community Care Act 1990 defines social services (or social care) as the provision of social work, personal care, protection or social support services to children or adults in need or at risk, or to adults with needs arising from illness, disability, old age or poverty. The Act establishes the following aims for social services: to protect people who use care services from abuse or neglect; to prevent deterioration of or promote physical or mental health; to promote independence and social inclusion; to improve opportunities and life chances; to strengthen families and to protect human rights in relation to people’s social needs. 7 Adam, Emmerson, and Kenley (2007) report that expenditures on education accounted for 35 percent of English LA total current expenditures in 2005-06; social services for 18 percent; housing for 13 percent; cultural environmental and planning for 11 percent; police for ten percent; transport for six percent; fire for two percent; and other for five percent.
7
thority collects through the Council Tax.8 We deflate all values using the GDP Price Deflator, with 2005 as the base year. Data on Internet Penetration. Ofcom, the U.K. media and telecom regulator, collects quarterly information on several characteristics of the broadband market in fine geographic detail. Specifically, for each of the 5,587 U.K. Local Exchanges (LEs hereafter)—the nodes of the telephone network connecting directly to houses, thus constituting the smallest local markets in the broadband industry—Ofcom collects the number of providers of broadband internet services, the number of subscribers for each of these providers, the availability of cable technology, and the number of cable subscribers. The Ofcom data also allow us to construct the exact local catchment area of each LE, as they include the complete list of postcodes that each LE covers.9 This is a rather unique characteristic of our dataset that, to the best of our knowledge, has not been available in previous work on internet (and, perhaps more generally, new media) diffusion and political outcomes. These catchment areas depend on the topology of British Telecom (BT)’s network that was built in the 1930s for analog voice telephony. Local networks were constantly upgraded with technological advancements, but the catchment areas essentially have not changed for more than 80 years. We should point out that LEs’ catchment areas determine competition and regulation in telecoms, but are not used for any other purpose (i.e., they are not used to define statistical units or school catchment areas). We further use some network characteristics, such as the average distance to the premises from the LE and the distance between the LE and the network backbone, as control variables in our regressions. Appendix B provides more details on broadband markets in the U.K. Data on Local Newspapers. We obtain panel data on local newspaper circulations from the Audit Bureau of Circulations (ABC). These data report average semi-annual per-issue circulations of 1,858 local newspapers within one of 47 circulation areas (45 areas in England, plus Wales and Scotland; thus, these areas are, on average, larger than LAs), with each newspaper pertaining exclusively to one area. 1,493 of these local newspapers are weekly, and 365 are daily. Data on Demographic, Geographic and Weather Characteristics. We obtain sociodemographic characteristics from the Census both for each ward and for each Local Authority: the age structure of the population, the ethnic composition, the fraction of individuals with high education (i.e., with a bachelor’s degree or higher), the fraction of individuals with high socio-economic status,10 as well as the fraction of the population living in urban areas and the population density. 8
The Council Tax is calculated as follows. Dwellings are allocated into one of eight bands (letters A to H) on the basis of their assumed capital value. Each LA sets the tax rate, expressed as the annual levy on a Band D property. This decision automatically sets the amounts levied on all types of households and dwellings. 9 The U.K. is divided into 1.7 million postcodes, with an average radius of less than 100 meters. 10 The Office for National Statistics (ONS) establishes individuals’ socio-economic status based on their occupation and employment status, and then further divides them according to the nature of their employment
8
We further gather geographic data from the Ordnance Survey. From these data, we calculate the Elevationi of ward i as the absolute elevation above the sea level, measured at the main LE within each ward; this controls for some geographic characteristics that may affect political outcomes. We also construct wards’ Relative Elevationi in the surrounding area Elevationi −Min Elevationi within a 1.5-kilometer radius11 as Max , which is an index between zero Elevationi −Min Elevationi and one that assays the ruggedness of the terrain in a ward, as this may affect productive activities and, thus, political outcomes (Nunn and Puga, 2012). We also collect transaction prices of all residential property from the Land Registry, from which we construct average local house prices. Finally, we obtain weather data that we use to construct our supply-side instruments that affect internet penetration across locations and over time. As we highlighted in the Introduction, scientific publications and regulatory reports document that the weather affects the costs of providing high-quality, reliable broadband, and Section 3 will provide extensive evidence of these effects. Hence, we collect from the U.K. Met Office rainfall data for each location, from which we construct the variable Rainit , defined as the average daily rainfall in mm/m2 in ward i in year t. Data Matching. We match our electoral, budgetary, and newspaper data with data on internet penetration in the relevant geography—i.e., wards, LAs and circulation areas, respectively. While this is straightforward for most variables of our datasets, the Ofcom data on internet diffusion require that we match the LEs and wards whose areas may not be exactly overlapping. We perform this match by exploiting the fact that Ofcom provides us with the exact seven-digit postcodes that each LE covers. Thus, we approximate each postcode’s internet broadband subscriptions and number of households by assuming that they are equal across all postcodes within an LE’s catchment area since postcodes have approximately equal populations. Furthermore, we sum broadband subscriptions and households across all postcodes within a ward. On average, one ward covers an area connected to 2.34 LEs (since the areas are not overlapping), with a standard deviation of 1.56 LEs. Finally, we define our main variable of interest Internetit as the ratio between the total number of broadband internet subscriptions in ward i in year t and the total number of households in ward i in year t. We further perform a similar aggregation from wards to LAs (on average, one LA has 21.11 wards, with a standard deviation of 5.34) to obtain InternetIt in LA I in year t, and then from LAs to newspaper circulation areas (on average, one area includes 3.37 unitary or upper-tier LAs, with a standard deviation of 3.45) to obtain Internetat in area a in period t.12 A related issue is the timing of the variables. U.K. (local and national) elections usually take place in May, and this is always the case in our sample period. We match election conditions. These conditions and relations range from higher managerial and professional occupations, to routine occupations. The ONS classification is available at http://tinyurl.com/plg3f98. 11 We also experimented with different radii, and the results do not change. 12 While we have annual data on elections and LA budgets, we have semi-annual data on newspaper circulations.
9
outcomes of year t with internet diffusion recorded in December of year t − 1, and we calculate our instruments based on rainfall in year t − 1, which seems the relevant period to affect the supply of reliable broadband prior to the election year. We will further include as regressors in our regression equations: 1) the rainfall on the day of election, to control for any direct effect on turnout. Gomez, Hansford, and Krause (2007) and Fujiwara, Meng, and Vogl (2016), among others, document that rain on election day has a negative impact on turnout in U.S. presidential elections, whereas Lind (2015) shows that it has a positive impact on turnout in Norwegian municipal elections; and 2) the average daily rainfall in April of year t, to control for any effect of the rain on the campaign period. Similarly, we match newspaper circulation in period t with internet diffusion recorded at the beginning of period t, and we calculate our instruments based on rainfall in the year before the beginning of period t—e.g., we match newspaper circulation during January-June of year t with broadband diffusion recorded in December of year t − 1 and with cumulative rainfall during January-December of year t − 1.
2.1
Summary Statistics
Table 1 reports summary statistics of our main variables.13 Panel A refers to data at the ward level. The top three rows of Panel A report our main variables of interest. Average Turnout is quite low, at 43 percent, but the variation is large; some of this variation is due to the national elections of 2010, but a large cross-sectional variation persists within each year. The average value of Internet across ward-year pairs is 51 percent, with a standard deviation of 12 percent; some of this variation is due to the diffusion of the internet over time, but large cross-sectional variation persists within each year, even across wards within LAs. Similarly, Rain displays substantial variation: the standard deviation is 0.56 mm/m2 and the range is 6.7 mm/m2 ; removing the LA-specific means from Rain (i.e., with a fixed-effect regression), the standard deviation of the residual rainfall is 0.33 mm/m2 and the range is 6.2 mm/m2 , showing that a large variation persists within LAs. The middle rows report socio-demographic characteristics of the wards, while the bottom rows report election characteristics. Panel B refers to data at the LA level. The top rows report our main variables of interest. Per capita total expenditures equal approximately £1,200, with expenditures on education and expenditures on housing and social services accounting for approximately two thirds and one third, respectively, of total expenditures. Per capita tax requirements equal approximately £350. These figures match those reported in the Local Government Financial Statistics for England 2012-13, as well as those reported by Besley and Preston (2007). The average value of Internet across LA-year pairs is approximately 55 percent, with a standard deviation of 13 percent. The average value of Rain is similar to the one across ward-year pairs, but the standard deviation and, most notably, the range and the maximum are substantially smaller. 13
The variables that measure percentages within a ward or LA take on values between 0 and 100 and are denoted with the symbol (%) to distinguish them from indicator variables.
10
Table 1: Descriptive Statistics
Panel A: Wards (N=14,149) Mean Std. Dev. Turnout (%) 42.69 13.02 Internet (%) 50.72 12.09 Rain (mm/m2 ) 2.04 0.56 Rain Election Day (mm/m2 ) 0.94 2.30 University Degree (%) 39.22 11.55 High Socio-Economic Status (%) 31.61 10.37 Average Age (Years) 39.86 4.20 White (%) 88.47 15.36 Employed (%) 62.63 7.34 Urban (%) 81.48 38.59 Population Density 253.87 279.49 Labour Incumbent 0.28 0.45 Conservative Incumbent 0.40 0.49 ∆ Share 1st-2nd Party 22.24 17.00 Multiple Vacancies 0.29 0.45 Panel B: Local Authorities (N=565) Per Capita Total Expenditures 1216.06 197.45 Per Capita Expenditures on Education 776.49 125.89 Per Capita Expenditures on Housing and Social Services 439.57 112.66 Per Capita Tax Requirements 347.50 56.09 Internet (%) 55.06 12.72 Rain (mm/m2 ) 2.06 0.51 University Degree (%) 39.80 9.18 High Socio-Economic Status (%) 30.40 7.75 Average Age (Years) 38.37 2.33 White (%) 79.97 17.15 Employed (%) 60.85 4.64 Urban (%) 94.53 10.83 Population Density 324.82 308.59 Labour Majority 0.28 0.45 Conservative Majority 0.30 0.46 Panel C: Local Newspapers (N=10,604) Newspaper Circulation 58,951 88,898 –Weekly (N=8,878) 38,952 50,802 –Daily (N=1,726) 161,823 150,493 Internet (%) 51.77 11.29 Rain (mm/m2 ) 2.63 1.03
Min 9.59 14.78 0.96 0.00 13.30 5.30 22.80 6.20 6.60 0.00 0.26 0.00 0.00 0.01 0.00
Max 83.25 100 7.72 21.22 90.40 67.70 57.00 99.80 83.20 100.00 2432.59 1.00 1.00 100.00 1.00
851.37 442.48 237.97 147.07 23.32 1.11 25.80 19.00 32.24 29.00 48.60 45.82 8.42 0.00 0.00
2213.32 1394.95 853.23 566.68 89.64 4.08 63.60 54.70 44.45 98.60 72.10 100.00 1387.12 1.00 1.00
348 1,957,756 348 737,715 1,020 1,957,756 23.32 74.21 1.12 6.26
Notes: This table reports the summary statistics of the main variables used in our analysis. Panel A refers to data on wards, Panel B refers to data on Local Authorities, and Panel C refers to data on local newspapers.
11
The middle rows report socio-demographic characteristics of the LAs; the bottom rows report variables that capture the political composition of the council. Panel C refers to data at the local newspaper level. Circulations display great heterogeneity across newspapers and the difference between weekly and daily newspapers account for some this heterogeneity. The average value of Internet across circulation areas-year pairs is approximately 52 percent, with a standard deviation of 11. The average value of Rain is larger than the the one across LA-year pairs, since the circulation data include Wales and Scotland, which are rainier than England. Overall, our data provide a rich description of broadband internet penetration in England in fine geographic detail, allowing us to precisely match them with other data. Thus, our data are ideally suited to investigating the effects of internet penetration on voter turnout and local councils’ policy choices, as well as on newspaper circulations. We now turn to these analyses.
3
The Effect of the Internet on Local Elections
In this section, we investigate the effect of internet penetration on local-election outcomes. The basic framework for our analysis is the following equation: Yit = βInternetit + γXit + δ I + η t + εit ,
(1)
where Internetit measures household broadband penetration in ward i and year t; Xit is a vector of control variables that includes demographic characteristics, as well as election characteristics, such as the number of candidates, indicator variables for the party of the incumbent and a measure of closeness of the election—i.e., the difference in vote shares between the first and the second parties; δ I are fixed effects for the LA I to which ward i belongs;14 and η t are year fixed effects. Yit is the outcome of interest: the (log of) voter turnout. Thus, our outcome variable is measured at the individual level, whereas our main explanatory variable Internet is measured at the household level (on average, one household includes approximately two eligible voters). The inclusion of LA (and year) fixed effects in equation (1) implies that we are identifying the effect of Internet on election outcomes exclusively exploiting local variation across different wards within the same LA (we cannot include ward fixed effects, as our data do not include multiple elections for more than 40 percent of the wards). Moreover, we include in Xit the main demographic characteristics of the ward obtained from the 2011 Census: the share of the population aged between 18 and 65 (working age); the share of the population older than 65; the share of whites; the share of married population; the share of the population with higher education; the share of the population employed; the share of the population with high socio-economic status; the share of the ward that is classified as urban; and population 14
In the case of wards belonging to two-tier LAs, we include fixed-effects for the upper LA.
12
density. We further include interactions between these 2011 demographic characteristics and time trends to control flexibly for the variation in voter turnout that may be correlated with internet penetration due to its endogenous diffusion. Nonetheless, key challenges to estimating equation (1) remain. Specifically, our main explanatory variable Internetit may still be correlated with unobserved ward-level variables that could affect electoral outcomes. Internet adoption is positively correlated with observable demographic characteristics that capture the affluence of the ward—i.e., the fraction of individuals with high socio-economic status, the average house price, and the fraction of individuals with a university degree—and that are also positively correlated with political participation (Wolfinger and Rosenstone, 1980; Sondheimer and Green, 2010). Since our specification may not control for all the determinants of the demand for broadband internet, some unobservable demographic characteristics may confound the interpretation of OLS estimates of the coefficients of equation (1). Moreover, we may face a reverse-causality threat.
3.1
Identification
We address these key identification issues using complementary strategies. 3.1.1
Bounds Based on OLS
While the OLS estimate of the coefficient Internet may suffer from omitted variable bias, we can construct informative bounds based on it. Specifically, since unobserved demographic characteristics that increase turnout are positively correlated with internet penetration, the OLS estimate of the coefficient of Internet in equation (1) is likely to be biased upward. Hence, it should be an upper bound of the causal effect of the diffusion of the internet on voter turnout. Moreover, Altonji, Elder, and Taber (2005) and Oster (Forthcoming) develop a more formal bound for the omitted variable bias of the OLS estimate under the assumption that selection on unobservables is proportional to selection on observables. Oster (Forthcoming) shows that, if selection on unobservables is perfectly proportional to selection on observables, the bound equals h iR ˜ max − R ∗ ˜ ˚ ˜ β =β− β−β , (2) ˜−R ˚ R where β˜ is the OLS estimate of β in equation (1)—i.e., the regression with full controls—and ˜ is the corresponding R2 ; ˚ ˚ are the estimates of β and the R2 , respectively, of the R β and R OLS regression without controls; and Rmax is generally set to 1. 3.1.2
Instrumental Variables
We further use instrumental variables that affect the supply of broadband internet across different geographic areas and over time. More specifically, our instruments exploit the fact 13
that the weather affects the costs of providing reliable broadband. Relevance. The Introduction quoted scientific publications on the effects of rainfall on the reliability of broadband, as well as regulatory reports filed by Openreach, the regulated network operator that runs and maintains the LEs. Similarly, the regulator Ofcom (2014) describes how persistent bad weather contributes to fault levels: “The Environment Agency’s Water Situation Reports provide further potential reasons for the rise in fault rates. These indicate ground water and soil saturation levels were much higher than normal in most places for much of the autumn of 2012 confirming the cumulative effect of the rain. [...] It seems likely that higher ground water levels and soil saturation levels may have contributed to the rise in the volume of underground network faults. [...] It is likely that these conditions could have led to more underground structures flooding and more faults due to water ingress into failed joints and cables.” Additional records of the effects of the weather abound. For example, the broadband provider TalkTalk writes on its website: “Adverse weather conditions like heavy rain and flooding, snow and frost can cause people in the affected area’s connections to slow. [...] Bad weather can cause cables to corrode or cause shorts, resulting in signals needing to be retransmitted and connections slowing down.” Similarly, EE, another provider, writes on its website: “[B]ad weather and electrical interference can all affect the speed of your service.” Moreover, The Financial Times, on May 19, 2014, reported on consumer complaints: “BT will attempt to stem the tide of angry customer complaints about its broadband connections today with plans to employ a further 1,600 engineers to install and repair its copper and fibre network across Britain. [...] During periods of heavy rain or snow, the incidence of faults on BT’s network rises sharply.” In summary, all market participants seem to note that bad weather compromises the quality of broadband service. The regulatory reports delve deeper into the more specific effects of the weather and their magnitudes. Most notably, Openreach commissioned Deloitte to perform a systematic analysis of the determinants of fault levels and of fault repair times, and the report (Deloitte, 2013) states: “The results demonstrate a range of correlation coefficients between fault rates by type of fault and weather metrics. The correlation is mainly found in relation to precipitation and humidity. [...]” Deloitte (2013) further shows how rain affects the fault rates of broadband lines used for data rather than lines used only for voice. Ofcom (2014) performs a similar statistical analysis, finding that the relationship between rainfall and fault report volumes in the following month has a correlation coefficient of about 0.8. Ofcom (2014, p. 563) also suggests that the increase in the volume of faults reported to Openreach between a dry period (defined as rainfall around 50mm in a month) and a particularly wet period (defined as rainfall around 150mm in a month) is of the order of 50,000 faults, or 15 percent.15 While all these reports document that the weather—most notably, rainfall—affects the reliability of broadband services, our analysis focuses on broadband diffusion. Service reliability 15
Openreach (2014) includes an extensive case study titled: “Recent U.K. Flooding and Implications for Openreach.”
14
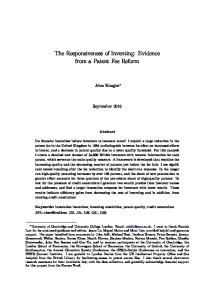
Figure 2: Cumulative annual rainfall (left map) and broadband diffusion (right map) in England in 2006. The black lines identify ward boundaries. The red lines on the left map identify the boundaries of Local Authorities. affects household broadband uptake, as other vertical dimensions of quality, such as speed, do (Bouckaert, van Dijk, and Verboven, 2010; Nardotto, Valletti, and Verboven, 2015). Indeed, our rich datasets are ideally suited to understand the direct relationship between rainfall and broadband penetration. Figure 2 displays two maps of England: the left one displays cumulative annual rainfall levels, while the right one displays broadband diffusion, both measured in 2006. In both maps, the black lines identify ward boundaries. Using wards as a unit of observation (thus a population-weighted unit of observation), the correlation between rainfall and broadband penetration equals −0.22. Since our regression equation (1) includes LA fixed effects, it is important to understand the variability of rain within LAs. We reported in Section 2.1 that the variation of rainfall within LAs is substantial—i.e., the within-LA standard deviation and the within-LA range of Rain equal 0.33 mm/m2 and 6.2 mm/m2 , respectively. To appreciate this variation, Figure 3 displays maps of two LAs, one urban (Birmingham, top panels), and one rural (Sefton, bottom panels). The left panels display cumulative rainfall levels, and the right panels display internet diffusion across wards within the LAs. These maps provide simple graphical evidence of the variation in rainfall that is typical of the full sample; they also seem to suggest that a negative
15
Figure 3: Cumulative annual rainfall (left panels) and broadband diffusion (right panels) across wards within the Local Authorities of Birmingham (top panels) and Sefton (bottom panels) in 2006. The black lines identify ward boundaries. correlation between rainfall and internet diffusion persists across wards within these LAs. Based on this body of evidence, we employ instruments based on the previous year’s rainfall as IVs for Internet in equation (1). More specifically, to capture the effect of severe weather events, we use a quadratic functional form, with: 1) the quadratic term Rain2 , to allow rainfall to affect the costs of supplying broadband in a non-linear way; and 2) Max Rain, defined as the average daily rainfall of the rainiest month, in an attempt to capture extreme events in the linear term, as well (Max Rainit−1 and Rainit−1 are highly correlated: the correlation coefficient equals 0.78 in the our sample of wards). Both variables are calculated in year t − 1. Exclusion Restriction and Exogeneity. We remind that we control for the weather during the election period by including: the rainfall during April of the election year, thereby capturing any direct effect on the campaign period; and the rainfall on the day of the election, thereby capturing any direct effect on turnout. Nonetheless, the main potential concerns with our instruments are that: 1) the previous year’s rainfall directly affects voting patterns—i.e., 16
the exclusion restriction is violated; and 2) some unobservable is simultaneously affecting voter turnout and is correlated with rainfall—i.e., the instruments are not exogenous. To address these main concerns, we use data on voter turnout in local elections before the diffusion of broadband internet to investigate whether: 1) rainfall in previous years had any direct effect on voter turnout in those years (this is equivalent to the “reduced form” of our IV regressions); and 2) voter turnout before the diffusion of broadband internet anticipates its subsequent diffusion during our main sample period. Since unobservables that are simultaneously affecting voter turnout and are correlated with broadband penetration (and rainfall, its supply-side shifter) are likely to change smoothly over a longer period of time rather than exclusively as broadband internet diffuses, these falsification tests effectively check for preexisting trends in the data. In practice, we use data on local elections held in each year t between 1996 and 2000—ten years before our main sample period—matching them with the corresponding data on broadband penetration and rainfall in each year t + 9 between 2005 and 2009: the 1996-2000 elections seem ideally suited for these falsification tests, as they clearly predate the rapid diffusion of the internet.
3.2
Main Results
OLS and IV Estimates. Columns (1) and (2) in Table 2 report the results of OLS and IV regressions, respectively, in which the dependent variable is the log of voter turnout in all local elections during the years 2006-2010. Since rainfall is spatially correlated, we calculate the standard errors following the procedure introduced by Conley (1999), which takes into account the spatial correlation of the residuals, using weights across distances based on the findings of Fukuchi (1988) and Burton, Glenis, Jones, and Kilsby (2013). The OLS estimates in column (1) indicate that household internet penetration and voter turnout are negatively correlated. As we argued that the OLS estimate of the coefficient of Internet should be an upper bound of the causal effect of the diffusion of the internet on voter turnout, this upper bound being negative suggests that broadband internet diffusion among households caused a significant decline in voter turnout. Moreover, we use the OLS estimates as inputs to construct the bound in equation (2): it ˜ = 0.817, obtained from equals −0.66. The values of the components are: β˜ = −0.22 and R ˚ = 0.240, obtained the OLS regression reported in column (1) of Table 2; and ˚ β = 1.19 and R from an (unreported) OLS regression without any additional control. Thus, this bound is approximately three times larger than the OLS estimate of −0.22 reported in column (1). This is because the OLS estimate of the coefficient of Internet changes substantially once the regression includes control variables—most notably, ward demographic characteristics. These observable demographics account for the positive correlation between internet penetration and voter turnout in our ward data, thus suggesting that unobservable ward-level demographics may be positively correlated with both internet penetration and voter turnout, as well.16 16
A correlation between unobservables and Internet equal to −0.49 would make the coefficient of interest
17
18 0.817 14149
1.98** ( 0.86) -1.16*** ( 0.06) 0.44*** ( 0.06) -0.17*** ( 0.02) 0.54*** ( 0.05) -0.21*** ( 0.04) -5.66*** ( 0.39) -0.95*** ( 0.21) 1.43*** ( 0.19) -4.48*** ( 0.38) -26.03*** ( 1.93) 21.74*** ( 3.21) -2.26*** ( 0.48) -1.28*** ( 0.44) Yes Yes Yes
-0.22*** ( 0.02) -8.59*** ( 1.23) -2.20*** ( 0.68) 1.04*** ( 0.29) 0.33*** ( 0.02) 0.15*** ( 0.02) 0.00 ( 0.01) 0.04** ( 0.02) 0.07*** ( 0.01) 1.65*** ( 0.15) -0.01 ( 0.12) -0.03 ( 0.07) -0.05 ( 0.12) 0.74 ( 0.76) -0.62 ( 1.33) 0.25 ( 0.15) 0.12 ( 0.15) Yes Yes Yes 60.18 0.868 14149 0.587 14149
2.42** ( 0.96) -0.93*** ( 0.12) 0.55*** ( 0.10) -0.17*** ( 0.03) 0.56*** ( 0.07) -0.18*** ( 0.06) -4.62*** ( 0.62) -0.94*** ( 0.25) 1.41*** ( 0.23) -4.47*** ( 0.45) -25.62*** ( 2.22) 21.55*** ( 3.59) -2.08*** ( 0.55) -1.18** ( 0.50) Yes Yes Yes
-0.87*** ( 0.25)
0.709 12570
3.72 ( 3.71) -2.83 ( 2.51) 2.51** ( 1.16) -0.78*** ( 0.09) 0.04 ( 0.09) -0.47*** ( 0.03) 0.54*** ( 0.06) 0.64*** ( 0.07) -11.74*** ( 0.66) -5.69 ( 9.24) -0.26 ( 0.30) -2.02*** ( 0.58) -46.40*** ( 2.61) 30.48*** ( 3.65) -9.48*** ( 0.77) 2.09*** ( 0.77) Yes Yes Yes 0.709 12570
3.73 ( 3.71) -2.83 ( 2.51) 2.51** ( 1.16) -0.78*** ( 0.09) 0.04 ( 0.09) -0.47*** ( 0.03) 0.54*** ( 0.06) 0.64*** ( 0.07) -11.73*** ( 0.66) -6.36 (10.25) -0.26 ( 0.30) -2.02*** ( 0.58) -46.40*** ( 2.61) 30.47*** ( 3.66) -9.48*** ( 0.77) 2.09*** ( 0.77) Yes Yes Yes 0.709 12570
2.60** ( 1.13) -0.79*** ( 0.09) 0.03 ( 0.09) -0.47*** ( 0.03) 0.54*** ( 0.06) 0.65*** ( 0.07) -11.75*** ( 0.66) -5.74 ( 9.26) -0.26 ( 0.30) -2.01*** ( 0.58) -46.43*** ( 2.62) 30.49*** ( 3.65) -9.51*** ( 0.77) 2.07*** ( 0.77) Yes Yes Yes
0.02 ( 0.04) -7.00*** ( 1.38) 0.34 ( 0.79) 0.95*** ( 0.30) -0.01 ( 0.03) 0.28*** ( 0.03) 0.03*** ( 0.01) 0.05*** ( 0.02) 0.04* ( 0.02) 0.76*** ( 0.23) 2.28** ( 0.98) 0.09 ( 0.08) -0.06 ( 0.15) 1.78*** ( 0.65) -0.67 ( 0.89) 0.29 ( 0.18) 0.35* ( 0.19) Yes Yes Yes 20.17 0.863 12570
Years 1996–2000 OLS OLS OLS IV 1st Log(Turnout) Log(Turnout) Log(Turnout) Internet (4) (5) (6) (7)
0.556 12570
2.69*** ( 0.94) -0.79*** ( 0.13) 0.09 ( 0.18) -0.46*** ( 0.05) 0.55*** ( 0.08) 0.65*** ( 0.09) -11.59*** ( 0.90) -5.96 (10.52) -0.24 ( 0.35) -2.01*** ( 0.63) -46.04*** ( 3.03) 30.34*** ( 3.96) -9.45*** ( 0.90) 2.14** ( 0.88) Yes Yes Yes
-0.19 ( 0.48)
IV 2nd Log(Turnout) (8)
significance at the 10, 5 and 1 percent level, respectively.
Married are fractions, rescaled to vary between 0 and 1. The standard errors in parentheses allow for spatial correlations in the residuals, following the procedure in Conley (1999). *, ** and *** denote
Labour or Liberal Democrats (the excluded category). All variables measuring rainfall are in m/m2 . Work Age, People Aged 65+, High Socio-Economic Status, White, University Degree, Employed and
Elevation of the ward with respect to their surrounding areas; the number of telephone lines served by the LE; and an indicator variable for the incumbent belonging to a party other than Conservative,
year t − 1; in specifications (5)-(8), they refer to year t + 9. All regressions further include the fraction of individuals living in urban areas; the average housing price; the Elevation of the ward; the Relative
use data on all local elections during the years 2006-2010. Specifications (4)-(8) use data on all local elections during the years 1996-2000. In specifications (1)-(4), Rain and Max Rain refer to rainfall in
Notes: The dependent variable is: the log of voter turnout in ward i and year t in columns (1),(3)-(6), and (8); and internet penetration in ward i and year t in columns (2) and (7). Specifications (1)-(3)
Year Fixed Effects LA Fixed Effects LA Fixed Effects × Time F-Test R2 Observations
Conservative Incumbent
Labour Incumbent
(∆ Share 1st-2nd Party)2
∆ Share 1st-2nd Party
Multiple Vacancies
Number of Parties
Population Density
Urban
Employed
University Degree
White
High Socio-Economic Status
Work Age
Rain Election Day
Max Rain
Rain2
Internet
Dependent Variable:
Years 2006–2010 OLS IV 1st IV 2nd Log(Turnout) Internet Log(Turnout) (1) (2) (3)
Table 2: Internet Diffusion and Voter Turnout
Columns (2)-(3) report IV estimates. The first-stage regression (2) shows that our instruments are quite powerful: the F -test on the excluded instruments is above 60. The effect of the excluded instruments on broadband diffusion is as expected: a higher amount of Rain reduces internet diffusion. The magnitude is also of interest: one mm/m2 of Rain decreases broadband penetration by 1.8 percentage points, on average.17 Thus, the first-stage regression implies that four standard deviations of Rain across wards within LAs correspond to a 2.4-percentage-point variation in Internet, and the range of Rain across wards within LAs corresponds to an 11.2-percentage-point variation in Internet. The comparison between the OLS and the second-stage IV estimates reported in columns (1) and (3), respectively, show that the magnitude of the coefficient of Internet is greater in the IV estimates that exploit the variation in internet penetration across wards within an LA due to supply-side factors exclusively, thereby confirming that unobserved demographic characteristics that increase turnout are positively correlated with internet penetration. The IV estimates are also not statistically different from the bound of equation (2), although slightly larger in magnitude, suggesting that selection on unobservables may be more-thanproportional to selection on observables. Overall, the IV estimates indicate that broadband internet caused a large, significant decline in turnout during our study period: column (3) reports that a one-percentage-point increase in household internet penetration (which is broadly the order of magnitude that the within-LA variation in Rain implies) decreased voter turnout by e−0.87 − 1 ≈ −0.58 percent. Since average turnout equals 43 percent in our sample, this implies an approximately 0.25percentage-point decline in turnout—a sizable effect.18 The coefficients of the demographic variables are mostly consistent with those reported in the literature. More specifically, turnout is higher in wards with a greater fraction of white population, in areas with more people with high-socio economic status (a combination of wealth and education), and in non-urban wards. Similarly, the added controls for election characteristics indicate that turnout is higher in closer elections, although the estimated effect is small: moving from a relatively sure election with a gap of 20 percent between the parties to a more competitive one with a gap of five percent is associated with a 0.28-percentage-point increase in turnout.19 Finally, we find that rain on election day has a positive impact on turnout, consistent with Lind’s (2015) findings for Norwegian municipal elections. equal to 0. 17 In all regression tables, we decreased the scale of all variables measuring rainfall to m/m2 to increase the scale of their coefficients. 18 An interesting question is whether the effect of internet penetration on participation differs between local and general elections. To understand this, we collected data on voter turnout in the 2010 General Elections. However, this sample is small—we have data for 530 English parliamentary constituencies; thus, the estimates of the effect of internet penetration on turnout in the 2010 General Elections are noisy and the results inconclusive. 19 Since some of these characteristics of the same election are also outcomes, they may be ‘bad controls’ in the sense of Angrist and Pischke (2008). The results are identical when we drop these additional controls or use their lagged values.
19
Falsification Tests. Columns (4)-(8) in Table 2 report the results of OLS and IV regressions, respectively, of the falsification tests that seek to determine the validity of the exclusion restriction. The dependent variable in (4)-(6) and (8) is the (log of) voter turnout of all local elections during the years 1996-2000. Column (4) shows that the OLS estimate of the effect of previous-year rainfall on turnout is zero, and the standard error indicates that this estimate of zero is very precise. Interestingly, the coefficients of almost all other variables are very similar to those reported in column (1). Hence, this regression suggests that the exclusion restriction of our main IV results is valid. The regressions reported in columns (5)-(8) indicate that voter turnout does not seem to anticipate future broadband diffusion. Specifically, regression (5) shows that the OLS estimate of the effect of future rainfall on turnout is not statistically different from zero. Similarly, regression (6) shows that the OLS estimate of the effect of future broadband penetration is substantially smaller than the one reported in column (1) and is not statistically different from zero. Finally, columns (7)-(8) confirm that the IV estimate of the effect of future broadband penetration is also not statistically different from zero. Hence, we conclude that any changes in voter turnout observed as broadband internet diffused are not the continuation of pre-existing trends. Overall, we believe that regressions (4)-(8) provide a powerful validation of our instruments and our identification strategy. 3.2.1
Robustness: Alternative Instruments
Our identification relies on local variation in rainfall, which determines a variation in internet penetration that is smaller than the overall variation in the sample. To compare the magnitudes of our main IV estimates reported in Table 2, in Appendix C, we also employ two alternative identification strategies that borrow ideas from other papers in the literature and exploit slightly larger within-LA variation in internet penetration. First, Falck, Gold, and Heblich (2014) exploit the idea that the capacity of ADSL technology depends on the length of the copper wire between the LE and the house. Similarly, Campante, Durante, and Sobbrio (Forthcoming) argue that it is more expensive to deploy an optical fiber connection between LEs that are farther away from the network backbone, thereby affecting the pattern of ADSL rollout across different areas. Hence, we present results that use the average distance between the LE and houses in a ward and the distance between the LE and the network backbone as supply-side instruments. Second, Gentzkow (2006) studies the effect of the introduction of TV on voter turnout, exploiting the fact that television stations broadcast over a large area and, thus, reach several small counties when entering into a larger city. Hence, sharing the idea that proximity to a large market is uncorrelated with unobserved shocks that affect turnout, demand characteristics of nearby markets are valid instruments for internet penetration, once we control for the same characteristics in a given market (see, also, Fan, 2013). Appendix C reports these additional results. Both alternative identification strategies have
20
strong first-stage results, and the second-stage estimates of the effects of internet diffusion on electoral participation are very similar to the estimate reported in column (2) of Table 2.20
3.3
Results on Subsamples
We further investigate the heterogeneity of the effect of internet penetration on voter turnout across different demographic groups, focusing on education, age, and socio-economic status. Columns (1)-(4) in Table 3 present the results of IV regressions performed on subsamples in which we include the wards in tails of the distribution of the fraction of residents with at least a bachelor’s degree only. More specifically, the subsample used in (1)-(2) includes all wards in which this fraction is in the bottom 60 percent of the distribution across wards, and that used in columns (3)-(4) includes all wards in which it is in the top 60 percent.21 The estimates reported in columns (2) and (4) show that internet penetration has a larger negative effect on voter turnout in the subsample of wards with a higher fraction of less-educated individuals than in the subsample of wards with a lower fraction of them. The magnitude of the effect reported in column (2) is quite large: a one-percentage-point increase in internet penetration (which is broadly the order of magnitude that the within-LA variation in Rain implies) decreases turnout by e−1.44 − 1 ≈ −0.76 percent, which represents approximately a 0.32-percentage-point decline in turnout. The results reported in column (4) show, instead, that internet penetration has a smaller effect on voter turnout in the subsample of wards with a higher fraction of highly-educated individuals. Columns (5)-(8) in Table 3 present the results of IV regressions performed on subsamples in which we include the wards in tails of the distribution of the median age of residents; the subsample used in columns (5)-(6) includes all wards in which this fraction is in the bottom 60 percent of the distribution across wards, and that used in columns (7)-(8) includes all wards in which it is in the top 60 percent. The results reported in columns (6) and (8) show that internet penetration has a larger negative effect on voter turnout in the subsample of wards with relatively younger voters than in the subsample of wards with relatively older voters. Specifically, a one-percentage-point increase in internet penetration significantly decreases turnout by 0.62 percent in the former and by 0.41 percent in the latter. Columns (9)-(12) in Table 3 present the results of IV regressions performed on subsamples in which we include the wards in tails of the distribution of the fraction of residents with high socio-economic status. The subsample used in columns (9)-(10) includes all wards in which this fraction is in the bottom 60 percent of the distribution across wards, and that used in columns (11)-(12) includes all wards in which it is in the top 60 percent. The results show that internet penetration has a larger negative effect on voter turnout in the subsample of wards with a lower fraction of individuals with a higher socio-economic status than in 20
One important difference between our instruments and these alternatives is that our instruments display variation over time. 21 This threshold guarantees a sample size sufficiently large to obtain reasonable values of the F -tests on the excluded instruments in all subsamples.
21
22
-5.57*** ( 1.61) -2.12*** ( 0.72) 1.18*** ( 0.36) 0.32*** ( 0.03) 0.43*** ( 0.04) -0.05*** ( 0.01) -0.28*** ( 0.03) 0.17*** ( 0.02) 1.22*** ( 0.22) -0.10 ( 0.07) 0.03 ( 0.08) -0.38** ( 0.16) -0.13 ( 0.92) 0.92 ( 1.67) 0.23 ( 0.19) -0.20 ( 0.20) Yes Yes Yes 21.46 0.866 8489 0.526 8489
3.35** ( 1.33) -0.49** ( 0.20) 1.15*** ( 0.27) -0.31*** ( 0.04) 0.06 ( 0.19) -0.13 ( 0.12) -1.69* ( 0.93) -0.86*** ( 0.26) 1.93*** ( 0.32) -4.50*** ( 0.65) -24.11*** ( 3.12) 22.99*** ( 5.37) -1.94*** ( 0.67) -1.26* ( 0.68) Yes Yes Yes
-1.44*** ( 0.49) -8.89*** ( 1.67) -2.73** ( 1.08) 0.64 ( 0.41) 0.37*** ( 0.02) 0.12*** ( 0.03) 0.00 ( 0.01) 0.09*** ( 0.02) 0.06*** ( 0.02) 1.56*** ( 0.18) 0.87 ( 0.99) -0.08 ( 0.09) 0.30* ( 0.16) 1.07 ( 0.99) -1.05 ( 1.66) 0.01 ( 0.24) 0.31 ( 0.20) Yes Yes Yes 40.88 0.859 8490 0.599 8490
0.02 ( 1.07) -1.06*** ( 0.14) 0.55*** ( 0.11) 0.06* ( 0.03) 0.45*** ( 0.08) -0.27*** ( 0.07) -4.29*** ( 0.65) -0.06 ( 2.99) 1.10*** ( 0.26) -4.12*** ( 0.50) -25.47*** ( 2.70) 20.47*** ( 4.16) -0.74 ( 0.83) -1.86*** ( 0.64) Yes Yes Yes
-0.64** ( 0.27) -6.15*** ( 1.67) -1.67** ( 0.84) 0.85** ( 0.35) 0.18*** ( 0.03) 0.05 ( 0.03) 0.02*** ( 0.01) 0.12*** ( 0.02) 0.05** ( 0.02) 1.21*** ( 0.32) -0.09 ( 0.09) -0.02 ( 0.09) -0.09 ( 0.19) -1.20 ( 1.05) 4.19* ( 2.19) 0.09 ( 0.19) 0.12 ( 0.21) Yes Yes Yes 15.52 0.894 8489 0.525 8489
1.78 ( 1.32) -0.99*** ( 0.17) 0.63*** ( 0.13) -0.19*** ( 0.03) 0.58*** ( 0.12) -0.17* ( 0.10) -4.84*** ( 1.28) -0.84*** ( 0.21) 2.37*** ( 0.35) -2.81*** ( 0.76) -30.57*** ( 3.58) 29.06*** ( 7.45) -1.46** ( 0.72) -0.60 ( 0.77) Yes Yes Yes
-0.99* ( 0.58)
Young
-7.79*** ( 1.44) -2.49*** ( 0.81) 0.71* ( 0.37) 0.38*** ( 0.03) 0.53*** ( 0.04) -0.05** ( 0.02) -0.28*** ( 0.03) 0.13*** ( 0.02) 0.93*** ( 0.17) -0.02 ( 0.08) -0.08 ( 0.08) -0.06 ( 0.14) 2.46*** ( 0.92) -3.41** ( 1.45) 0.30 ( 0.21) -0.24 ( 0.19) Yes Yes Yes 43.43 0.856 8490
-0.53* ( 0.28)
0.584 8490
2.04** ( 0.95) -0.92*** ( 0.14) 0.27 ( 0.20) -0.01 ( 0.06) 0.70*** ( 0.13) -0.20** ( 0.08) -4.02*** ( 0.56) -1.17*** ( 0.19) 1.07*** ( 0.24) -4.55*** ( 0.44) -20.04*** ( 2.50) 13.86*** ( 3.83) -2.68*** ( 0.68) -1.44*** ( 0.56) Yes Yes Yes
Old
-5.78*** ( 1.36) -1.66** ( 0.74) 1.17*** ( 0.37) 0.33*** ( 0.03) 0.11*** ( 0.03) 0.01* ( 0.01) 0.03 ( 0.03) 0.08*** ( 0.02) 2.17*** ( 0.24) -0.11 ( 0.07) 0.06 ( 0.09) -0.26 ( 0.17) 0.25 ( 0.93) -0.50 ( 1.70) 0.13 ( 0.18) -0.04 ( 0.20) Yes Yes Yes 23.91 0.862 8489 0.538 8489
2.49* ( 1.30) -0.72*** ( 0.22) 0.92*** ( 0.15) -0.24*** ( 0.03) 0.31*** ( 0.10) -0.24*** ( 0.09) -1.97 ( 1.34) -0.85*** ( 0.28) 2.13*** ( 0.33) -4.36*** ( 0.67) -25.27*** ( 3.01) 25.75*** ( 5.18) -2.10*** ( 0.65) -0.94 ( 0.66) Yes Yes Yes
-1.07** ( 0.54) -9.36*** ( 1.74) -2.59** ( 1.06) 0.82** ( 0.40) 0.37*** ( 0.03) 0.21*** ( 0.03) -0.05*** ( 0.01) 0.00 ( 0.03) 0.08*** ( 0.02) 1.41*** ( 0.17) 1.92* ( 1.00) -0.11 ( 0.08) 0.14 ( 0.15) 2.00** ( 0.99) -1.93 ( 1.65) 0.19 ( 0.24) 0.20 ( 0.20) Yes Yes Yes 41.23 0.861 8490
0.577 8490
1.41 ( 1.04) -0.96*** ( 0.14) 0.42*** ( 0.12) 0.07* ( 0.04) 0.55*** ( 0.08) -0.36*** ( 0.07) -3.92*** ( 0.60) -3.24 ( 2.31) 0.90*** ( 0.25) -3.87*** ( 0.47) -23.17*** ( 2.57) 18.40*** ( 3.95) 0.67 ( 0.80) -1.39** ( 0.61) Yes Yes Yes
-0.75*** ( 0.27)
the 10, 5 and 1 percent level, respectively.
fractions, rescaled to vary between 0 and 1. The standard errors in parentheses allow for spatial correlations in the residuals, following the procedure in Conley (1999). *, ** and *** denote significance at
Liberal Democrats (the excluded category). All variables measuring rainfall are in m/m2 . Work Age, People Aged 65+, High Socio-Economic Status, White, University Degree, Employed and Married are
of the ward with respect to their surrounding areas; the number of telephone lines served by the LE; and an indicator variable for the incumbent belonging to a party other than Conservative, Labour or
percentile of the distribution across wards; columns (11)-(12) above the 40th percentile. All regressions further include the average local housing price; the Elevation of the ward; the Relative Elevation
across wards; columns (7)-(8) above the 40th percentile. Columns (9)-(10) use data from the subsample of all wards in which the fraction of residents with high socio-economic status is below the 60th
the distribution across wards; columns (3)-(4) above the 40th percentile. Columns (5)-(6) use data from the subsample of all wards in which the median age is below the 60th percentile of the distribution
on all local elections during the years 2006-2010. Columns (1)-(2) use data from the subsample of wards in which the fraction of individuals with at least a bachelor degree is below the 60th percentile of
Notes: The dependent variable is: the log of voter turnout in ward i and year t in even-numbered columns; and internet penetration in ward i and year t in odd-numbered columns. The sample uses data
Year Fixed Effects LA Fixed Effects LA Fixed Effects × Time F-Test R2 Observations
Conservative Incumbent
Labour Incumbent
(∆ Share 1st-2nd Party)2
∆ Share 1st-2nd Party
Multiple Vacancies
Number of Parties
Population Density
Urban
Employed
University Degree
White
High Socio-Economic Status
Work Age
Rain Election Day
Max Rain
Rain
2
Internet
Dependent Variable:
High Education
Low Socio-Economic High Socio-Economic Status Status IV 1st IV 2nd IV 1st IV 2nd IV 1st IV 2nd IV 1st IV 2nd IV 1st IV 2nd IV 1st IV 2nd Internet Log(Turnout) Internet Log(Turnout) Internet Log(Turnout) Internet Log(Turnout) Internet Log(Turnout) Internet Log(Turnout) (1) (2) (3) (4) (5) (6) (7) (8) (9) (10) (11) (12)
Low Education
Table 3: Internet Diffusion and Voter Turnout: Heterogeneous Effects
the subsample of wards with a higher fraction of them. A one-percentage-point increase in internet penetration decreases turnout by 0.65 percent in the former, and by 0.52 percent in the latter.22
3.4
Additional Results: Incumbents, Election Closeness, and Parties’ Vote Shares
An important question is whether changes in media markets affect the competitiveness of elections by, for example, favoring incumbents (thereby accounting for their rising advantage) and/or specific parties; for different media, see, among others, the contributions of Falck, Gold, and Heblich (2014), Gentzkow, Shapiro, and Sinkinson (2011), and Prior (2007). Our data are well suited to investigating these issues. Thus, we use our ward-level data to estimate equation (1) with several outcome variables pertaining to incumbents’ electoral performance, to the election closeness, and to parties’ vote shares. Specifically, we study incumbents’ reelection by using two outcome variables: the vote share of the incumbent party; and an indicator variable that equals one if the incumbent party wins the election, and zero otherwise.23 Columns (1) and (3) of Table 4 report OLS estimates of the coefficients, whereas columns (2) and (4) report the IV estimates, using the same instruments based on rainfall that we employed in Table 2 (the first-stage is almost identical to that reported in Table 2; the F -test differs slightly due to the slightly different sample). In the case of the difference in the vote share of the incumbent party, both the OLS and the IV estimates of columns (1) and (2), respectively, suggest a positive effect of internet diffusion on the performance of incumbent parties, although the IV estimates are barely significant at the 10 percent significance level. In the case of the reelection probability, the OLS estimates of column (3) suggest a positive effect of internet diffusion on the reelection of incumbent parties; the IV estimates of column (4) are also positive, but quite imprecise, and, thus, we cannot reject the null of no effect. A related question regarding our study period is whether internet broadband has affected election closeness. Columns (5) and (6) of Table 4 report OLS and IV estimates of a regression in which the dependent variable is the difference between the vote shares of the two candidates with the most votes. Both estimates indicate that internet diffusion increased the vote difference between the winner and the runner-up. These regressions are, perhaps, another manifestation of the increased incumbency advantage documented in columns (1)-(4). Overall, the results of Table 4 suggest that internet penetration may have made elections 22
We should point out that the standard errors of the estimates on subsamples (5)-(8) and (9)-(12) are large, and, thus, we cannot reject the hypotheses that the effects of Internet are identical in subsamples (5)-(8) and (9)-(12), respectively. This is likely due to the fact that the variations in median age across ward and in the fraction of residents with high socio-economic status are quite limited, whereas the variation in the fraction of individuals with a bachelor degree across wards exploited in subsamples (1)-(4) is larger. 23 In approximately one percent of observations (152 observations), the incumbent party does not run for election; we drop these observations from our estimation samples of regressions (1)-(4) of Table 4.
23
Table 4: Internet Diffusion, Performance of Incumbents, and Closeness of the Elections
Dependent variable: Internet
OLS IV 2nd Incumbent Vote Share (1) (2)
0.10*** ( 0.02) Rain Election Day 2.32*** ( 0.84) Work Age 0.14*** ( 0.05) High Socio-Economic Status 0.22*** ( 0.06) White -0.05*** ( 0.01) University Degree -0.20*** ( 0.04) Employed -0.16*** ( 0.04) Urban -0.61 ( 0.40) Population Density -0.22 ( 0.39) Number of Parties -7.99*** ( 0.18) Multiple Vacancies -3.70*** ( 0.35) Labour Incumbent 0.86 ( 0.56) Conservative Incumbent 6.02*** ( 0.56) Year Fixed Effects Yes LA Fixed Effects Yes LA Fixed Effects × Time Yes F-Test R2 0.869 Observations 13997
0.38* ( 0.23) 2.14** ( 0.86) 0.04 ( 0.10) 0.17** ( 0.08) -0.05*** ( 0.02) -0.20*** ( 0.05) -0.17*** ( 0.05) -1.06* ( 0.61) -0.22 ( 0.35) -7.97*** ( 0.21) -3.69*** ( 0.37) 0.79 ( 0.69) 5.98*** ( 0.65) Yes Yes Yes 59.34 0.259 13997
OLS IV 2nd OLS IV 2nd Re-election ∆ Share 1st-2nd Party (3) (4) (5) (6) 0.33*** ( 0.08) -0.61 ( 2.71) 0.06 ( 0.17) -0.04 ( 0.19) -0.08* ( 0.05) -0.02 ( 0.14) 0.10 ( 0.12) 1.10 ( 1.28) -3.47*** ( 0.87) -3.55*** ( 0.60) -6.21*** ( 1.18) 6.04*** ( 1.75) 17.16*** ( 1.61) Yes Yes Yes 0.076 13997
0.24 ( 0.75) -0.55 ( 2.63) 0.09 ( 0.32) -0.03 ( 0.25) -0.08 ( 0.06) -0.01 ( 0.17) 0.10 ( 0.15) 1.24 ( 1.86) -3.47*** ( 0.81) -3.55*** ( 0.65) -6.21*** ( 1.22) 6.06*** ( 1.99) 17.18*** ( 1.78) Yes Yes Yes 59.34 0.031 13997
0.05* ( 0.03) 2.89*** ( 1.01) 0.33*** ( 0.07) 0.27*** ( 0.07) -0.02 ( 0.02) -0.30*** ( 0.05) -0.23*** ( 0.05) -0.76 ( 0.52) -1.21*** ( 0.42) -3.49*** ( 0.24) -4.85*** ( 0.45) -4.03*** ( 0.59) 2.45*** ( 0.61) Yes Yes Yes 0.222 14149
0.60** ( 0.27) 2.52** ( 1.04) 0.14 ( 0.13) 0.17 ( 0.11) -0.02 ( 0.02) -0.31*** ( 0.07) -0.26*** ( 0.06) -1.62** ( 0.82) -1.21*** ( 0.36) -3.47*** ( 0.28) -4.86*** ( 0.48) -4.17*** ( 0.68) 2.35*** ( 0.70) Yes Yes Yes 60.18 0.146 14149
Notes: The dependent variable is: the vote share of the incumbent in ward i in year t in columns (1) and (2); an indicator variable equal to one if the incumbent is elected in ward i in year t, and zero otherwise, in columns (3) and (4); and the difference between the vote shares of two candidates with the most votes in ward i in year t in columns (5) and (6). All regressions further include the fraction of individuals living in urban areas; the average housing price; the Elevation of the ward; the Relative Elevation of the ward with respect to their surrounding areas; the number of telephone lines served by the LE; and an indicator variable for the incumbent belonging to a party other than Conservative, Labour or Liberal Democrats (the excluded category). Work Age, People Aged 65+, High Socio-Economic Status, White, University Degree, Employed and Married are fractions, rescaled to vary between 0 and 1. The standard errors in parentheses allow for spatial correlations in the residuals, following the procedure in Conley (1999). *, ** and *** denote significance at the 10, 5 and 1 percent level, respectively.
24
less competitive, thus favoring incumbents. In Section 5, we will show that, as the internet diffused, it crowded out traditional media, such as local newspapers, with greater coverage of local political issues. Moreover, we argue that this substitution decreased the coverage and the quality of local news and, thus, voters’ information about local politics. Since, on average, voters are less aware of challengers than of incumbents (Prior, 2007), the decline in voters’ information may have made it more difficult for challengers to overcome their informational disadvantage and win local elections. Furthermore, we estimate regressions in which the outcome variables are the vote shares of two major parties—i.e., Labour and Conservatives—as well as of the smaller parties—i.e., the Liberal Democrats and a group that includes all other parties: Green Party, British National Party, UK Independent Party, local parties, and independent candidates. This analysis faces one empirical challenge, in addition to the endogeneity of internet penetration: parties do not run for election in all wards—i.e, on average, each party does not field its candidate in approximately 20 percent of wards. Hence, we have selected samples (Heckman, 1979) and, thus, we follow the procedure developed by Semykina and Wooldridge (2010) to obtain consistent estimates in the presence of endogeneity of internet penetration and of selection. While the non-linearities of the selection-correction terms guarantee identification of the outcome equations—i.e., parties’ vote shares—a stronger identification requires that the selection equations—i.e., parties’ decision to run for election in ward i in year t—include (at least) one variable that is not included in the outcome equations. Thus, we want a variable that affects the extensive margin of running for election, but it does not affect the intensive margin of the vote share. Finding such an exclusion restriction is traditionally challenging. Nevertheless, Progress, an independent organisation of Labour party members, emphasizes on its website “the massive organisational challenge for Labour of finding enough candidates in the southeast, southwest and eastern regions where there are nearly 5,000 council seats up for election.” This suggests that Labour finds it difficult to recruit suitable candidates and, thus, it is less likely to field its candidate in each ward when the total number of seats up for election in an area is higher. Presumably, this applies to the Conservative party, as well, whereas smaller parties may be encouraged to run for election when the major parties do not field a candidate. Hence, following this insight, the number of other wards in the LA of ward i holding elections in year t should shift a party’s ability and incentives to field its candidate in ward i in year t, and it may do so differentially between major parties and smaller parties; however, conditional on this party running for election (as well as all other controls, including the total number of other parties running for election), it should not affect its vote share. Moreover, this variable is exogenous to parties, since the election cycles are fixed, and varies over time within LAs, due to the differential election cycles described in detail in Appendix A. The selection equations (omitted) confirm that Labour and Conservatives are less likely to field their candidate when the number of contemporaneous elections in the same LA is higher, whereas smaller parties are more likely to do so. Moreover, odd-numbered columns of Table 5 report OLS coefficient estimates of parties’ vote share regressions, whereas even25
numbered columns report the IV estimates, using the same instruments based on rainfall that we employed in Table 2 (the first-stage regressions, also omitted, are very similar to that reported in Table 2, although they now differ across parties due to their differential selectioncorrection terms; hence the different values of the F -tests in Table 5). Overall, the estimates of the coefficient of Internet are close to zero and/or noisy in all specifications and, thus, we do not have clear evidence that the internet affected party shares.24 Together, Tables 4 and 5 imply that, while broadband penetration helped incumbent parties to increase their vote share, the resulting redistribution of votes from wards in which parties lose to wards in which they win did not significantly affect their aggregate vote shares.
4
The Effect of the Internet on Local-Government Policies: Suggestive Evidence
Several influential papers document that the extent of political participation (as well as of voters’ information) affects aggregate policy choices. For example, government expenditures increased dramatically after large increases in suffrage in the U.S. and in the U.K. (Lott, 1999; Lizzeri and Persico, 2004), and transfers from the federal governments are higher in U.S. districts in which congressmen receive greater press coverage (Snyder and Str¨omberg, 2010). Moreover, Lindbeck and Weibull (1987) and Str¨omberg (2004a,b) formalize the idea that politicians with electoral concerns direct greater public expenditures towards groups of swing voters whose participation more likely changes the election outcome. The evidence reported in Table 2 shows that broadband internet diffusion in our study period had negative effects on voter turnout, and we propose that a decline in voters’ information may explain the results of incumbents’ reelections, shown in Table 4. Hence, these findings in Section 3, along with that of the prior literature documenting that political participation and voters’ information affect public expenditures, raises this natural followup question: Does broadband internet diffusion affect local-government policies? The above arguments suggest that, as internet broadband diffuses, local councils may set a lower level of expenditures because electoral participation (as well as, perhaps, voters’ information) is declining; in turn, taxation may also decline.25 Moreover, Table 3 shows that the diffusion of the internet has differentially affected the participation of different socio-demographic groups. Thus, an additional interesting question is whether LAs’ expenditures display heterogeneous patterns 24
As a robustness check, we exploited an alternative exclusion restriction in the selection equations: the area of the ward. A larger area should make it more costly to run for election, thereby affecting whether or not a party fields its candidate, but, conditional on this party running for election (as well as all other controls, including the total number of other parties running for election and population density), it should not affect its vote share. The estimates of the coefficients of Internet in the vote share equations obtained including the area of the ward in the selection equations are again close to zero and/or noisy in all specifications, thereby buttressing the results of Table 5 that the internet did not affect party shares. 25 An alternative hypothesis is that politicians are budget-maximizers, and, thus, LAs’ aggregate budget choices may not depend on electoral participation (Niskanen, 1974).
26
27 0.723 11833
-0.09*** ( 0.02) 1.46** ( 0.64) -0.10* ( 0.05) -0.22*** ( 0.05) -0.22*** ( 0.01) -0.16*** ( 0.04) 0.21*** ( 0.03) -1.92*** ( 0.58) -0.16 ( 0.19) -12.34*** ( 1.02) -1.09*** ( 0.29) 9.22*** ( 1.68) -31.70*** ( 3.28) 8.29*** ( 0.55) -0.71 ( 0.48)
0.20 ( 0.31) 1.28* ( 0.67) -0.17** ( 0.08) -0.23*** ( 0.06) -0.22*** ( 0.02) -0.20*** ( 0.07) 0.18*** ( 0.06) -2.24*** ( 0.62) -0.17 ( 0.21) -12.30*** ( 1.10) -1.07*** ( 0.32) 9.17*** ( 1.97) -31.90*** ( 3.72) 8.21*** ( 0.64) -0.78 ( 0.55) 16.59 0.570 11833
OLS IV 2nd Labour (1) (2)
0.580 11319
0.00 ( 0.02) -1.73** ( 0.72) 0.12** ( 0.05) 0.19*** ( 0.06) 0.18*** ( 0.01) 0.04 ( 0.05) -0.13*** ( 0.04) -1.09*** ( 0.36) -0.09 ( 0.41) -5.88*** ( 0.88) -1.67*** ( 0.38) -9.96** ( 5.00) 50.73*** (11.08) 5.01*** ( 0.89) 15.99*** ( 1.26)
OLS IV 2nd Lib Dems (5) (6)
OLS IV 2nd Others (7) (8)
-0.17 0.04* -0.14 -0.01 0.29 ( 0.17) ( 0.03) ( 0.38) ( 0.04) ( 0.30) -1.62** 0.03 0.36 -0.86 -1.24 ( 0.76) ( 0.92) ( 1.01) ( 0.94) ( 1.05) 0.19** -0.09 -0.06 0.01 -0.08 ( 0.09) ( 0.08) ( 0.11) ( 0.06) ( 0.12) 0.22*** -0.07 -0.05 -0.02 -0.04 ( 0.08) ( 0.05) ( 0.08) ( 0.06) ( 0.08) 0.18*** 0.04 0.03 0.05*** 0.05** ( 0.01) ( 0.03) ( 0.03) ( 0.02) ( 0.02) 0.04 0.24*** 0.26*** 0.02 -0.01 ( 0.06) ( 0.04) ( 0.06) ( 0.05) ( 0.06) -0.12** 0.03 0.05 0.02 0.00 ( 0.05) ( 0.05) ( 0.07) ( 0.04) ( 0.05) -0.79 1.56*** 1.81** 1.73*** 1.18 ( 0.52) ( 0.51) ( 0.73) ( 0.62) ( 0.84) -0.10 6.14** 6.58** 0.14 -0.81 ( 0.40) ( 3.08) ( 3.24) ( 2.57) ( 2.56) -5.94*** -12.30*** -11.18*** -17.71*** -18.02*** ( 0.99) ( 2.48) ( 2.42) ( 2.75) ( 2.66) -1.64*** 0.50 0.33 3.47*** 3.57*** ( 0.42) ( 0.43) ( 0.48) ( 0.52) ( 0.55) -10.28* 10.45*** 10.88*** -15.21*** -15.29*** ( 5.82) ( 2.41) ( 2.69) ( 3.12) ( 3.31) 51.65*** -45.23*** -45.86*** 33.41*** 33.55*** (12.92) ( 4.40) ( 4.91) ( 5.28) ( 5.68) 5.01*** -1.89 -1.25 -13.34*** -13.29*** ( 1.03) ( 1.41) ( 1.48) ( 1.60) ( 1.64) 15.93*** -1.93 -1.25 -14.81*** -14.73*** ( 1.45) ( 1.49) ( 1.53) ( 1.70) ( 1.75) 17.77 59.15 37.28 0.482 0.748 0.620 0.588 0.422 11319 13704 13704 9174 9174
OLS IV 2nd Conservatives (3) (4)
for spatial correlations in the residuals, following the procedure in Conley (1999). *, ** and *** denote significance at the 10, 5 and 1 percent level, respectively.
High Socio-Economic Status, White, University Degree, Employed and Married are fractions, rescaled to vary between 0 and 1. The standard errors in parentheses allow
incumbent belonging to a party other than Conservative, Labour or Liberal Democrats (the excluded category); and selection-correction terms. Work Age, People Aged 65+,
Elevation of the ward; the Relative Elevation of the ward with respect to their surrounding areas; the number of telephone lines served by the LE; indicator variables for the
in columns (5)-(6); and of the other parties in columns (7)-(8). All regressions further include the fraction of individuals living in urban areas; the average housing price; the
Notes: The dependent variable is the vote share of the Labour party in ward i in year t in columns (1)-(2); of the Conservative party in columns (3)-(4); of the Liberal Democrats
F-Test R2 Observations
Conservative Incumbent
Labour Incumbent
(∆ Share 1st-2nd Party)2
∆ Share 1st-2nd Party
Multiple Vacancies
Number of Parties
Population Density
Urban
Employed
University Degree
White
High Socio-Economic Status
Work Age
Rain Election Day
Internet
Dependent Variable: Party Share
Table 5: Internet Diffusion and Parties’ Vote Shares
across different categories, related to how these categories of expenditures target different socio-demographic groups whose electoral participation (and, possibly, news consumption) changed as the internet diffused. The goal of this section is to provide a first step in the investigation of these issues. To do so, we use an empirical framework similar to that of equation (1), adapted to differences in the data—i.e., we have panel data for Local Authorities. Our outcome variables are the key fiscal variables that local councils determine in their annual budgets: the (log of) per capita aggregate expenditures in each LA, calculated as the sum of the per capita expenditures on education, housing and social services; and the (log of) per capita tax requirements— i.e., the per capita amount that LAs collect through the council tax. We further calculate internet diffusion, along with our socio-demographic and political control variables, for each LA by aggregating the corresponding variables that we used in the ward-level analysis of voter turnout.26 We include in our specifications year fixed effects to capture aggregate effects that vary across years; fixed effects for each LA to capture any time-invariant unobserved factor specific to each LA; and indicator variables for the party in control of each LA. This rich set of fixed effects implies that we identify the effect of internet penetration on LAs’ expenditures by exploiting only within-LA variation in internet diffusion over time, whereas we relied (mainly) on cross-sectional variation within LAs in our analysis of voter turnout. In practice, since our demographic variables exhibit negligible changes within LAs in the short time period of our sample, LAs’ fixed effects absorb the impact of demographic characteristics on LAs’ choices of expenditures and taxes.
4.1
Empirical Challenges and Identification Strategy
Our empirical analysis of local governments’ policy choices faces two challenges, in addition to those that we already faced in the analysis of voter turnout, and we can only partially overcome them with the available data. First, the aggregation of the data from wards to LAs drastically reduces the number of observations—i.e., from 14, 141 ward-year observations to 565 LA-year observations—thereby reducing the statistical power of our analysis. In turn, this prevents us from performing a rich analysis on subsamples based on demographic splits (similar to the one that we performed in Table 3); rather, it prompts us to disaggregate total expenditures into their components that plausibly target different demographic groups. Second, the exclusion restriction of our instruments based on rainfall is more questionable than in our analysis of voter turnout of Section 3, as the weather could have a direct effect on LAs’ expenditures. In this respect, we should point out that: 1) expenditures due to natural disasters, such as floods, are covered by the central government through the Environment Agency and, thus, are not included in our outcome variables; and 2) our expenditure variables 26
The analyses of this section combine the direct effect of internet penetration on policy outcomes, through voters’ information, and the indirect effect, through voting. Unfortunately, data limitations do not allow us to precisely assess the relative importance of these two main effects. We leave further analyses of this interesting question to future research.
28
include current expenditures and, thus, exclude capital investment, which is most directly affected by the weather. However, we cannot rule out that these weather-related disasters could directly affect the policy outcomes that we focus on; hence, we do not report IV estimates. Nevertheless, this section will report correlations that are consistent and complementary to our previous findings of Section 3. We believe that these (conditional) correlations are interesting, and that the different variation and the different ways of slicing the data in the analysis of LAs’ policy choices, relative to that of voter turnout, suggest that internet penetration affects policy choices. OLS Estimates. The OLS estimate of the coefficient of internet penetration is likely to be biased, since unobserved demographic characteristics that affect expenditures are likely to be correlated with internet penetration. Nonetheless, the OLS estimates may still be useful for constructing bounds. The direction of this bias is, perhaps, more difficult to determine a priori than in the voter turnout analysis in Section 3. However, internet adoption is positively correlated with observable demographic characteristics of more-informed voters, such as income and education, and several papers document that more-informed voters receive more-favorable policies, often through higher expenditures. Therefore, it seems plausible that unobserved demographic characteristics that increase expenditures may be positively correlated with internet penetration. In this case, the OLS estimate of the coefficient of internet penetration should be biased upward and, thus, should be an upper bound of the causal effect of the internet diffusion on per capita expenditures. Furthermore, we employ the OLS estimates to construct bounds as in equation (2).
4.2
Results
Expenditures. Column (1) in Table 6 reports the coefficient estimates of an OLS regression in which the dependent variable is the log of the per capita aggregate expenditures in LA I in year t. Internet diffusion and per capita expenditures are negatively correlated; the point estimate means that a one-percentage-point increase in internet diffusion is associated with a decrease in expenditures by e−0.31 − 1 ≈ −0.26 percent. Since per capita total expenditures amount to approximately £1,200, on average, the percent decrease corresponds to a decrease of £3.5, which is approximately 1.5 percent of one standard deviation of per capita expenditures in our sample. Since we argued that unobserved demographic characteristics that affect expenditures are likely to be correlated with internet penetration, the OLS estimate of the coefficient of Internet should be an upper bound of the causal effect of the diffusion of the internet on per capita expenditures. This upper bound being negative suggests that broadband internet diffusion caused a decline in LAs’ per capita expenditures. We further employ the OLS estimates as inputs to construct the bound in equation (2): it equals −3.714 if we consider the OLS regressions on LA-demeaned data (the values of ˜ = 0.395, ˚ ˚ = 0.305), and −0.323 if the components are: β˜ = −0.308, R β = 0.198 and R 29
Table 6: Internet Diffusion and Local Authorities’ Expenditures and Taxes
OLS
Dependent Variable:
Internet Conservative Majority Labour Majority Election Year Year Fixed Effects LA Fixed Effect R2 Observations
OLS OLS OLS Log(Expenditures) Log(Taxes) Aggregate Housing Education & Soc. Serv. (1) (2) (3) (4) -0.31** (0.14) -0.00 (0.01) -0.01 (0.01) -0.00 (0.00) Yes Yes 0.395 565
-0.34** (0.16) -0.00 (0.01) 0.00 (0.01) -0.00 (0.01) Yes Yes 0.091 565
-0.27 (0.16) -0.00 (0.01) -0.01 (0.01) -0.00 (0.01) Yes Yes 0.408 565
-0.34** (0.13) 0.00 (0.01) 0.01 (0.01) -0.00 (0.00) Yes Yes 0.253 565
Notes: The dependent variable is: the log of per capita total expenditures in LA I and year t in column (1); the log of per capita expenditures on housing services and social services in LA I and year t in columns (2); the log of per capita expenditures on education in LA I and year t in columns (3); and the log of per capita tax requirements in LA I and year t in columns (4). All regressions further include an indicator variable for the party in control other than Conservative, Labour or Liberal Democrats (the excluded category). Rain and Max Rain are in m/m2 . The robust standard errors in parentheses are adjusted by clusters within LAs. *, ** and *** denote significance at the 10, 5 and 1 percent level, respectively.
we consider the OLS regressions without demeaning the data from their LA-averages (the ˜ = 0.967, ˚ ˚ = 0.011). The values of the components are: β˜ = −0.308, R β = 0.125 and R values of the coefficient ˚ β that enter into the calculation of the bound are similar whether or not we demean the variables—i.e., they equal 0.198 or 0.125, respectively—but the fixed effects absorb the variation of expenditures across LAs, thereby affecting the calculation of the R2 of the regressions and accounting for the difference between the magnitudes of these bounds. Overall, these bounds provide further evidence that expenditures are lower in LAs with greater broadband diffusion. Moreover, the difference in the coefficient of Internet between the OLS regressions without any control (equal to either 0.198 or 0.125, depending on whether or not we demean the variables) and the regressions with controls (equal to −0.308) seems to corroborate that selection on observables subsists in our data. Columns (2)-(3) in Table 6 further report OLS estimates of regressions that focus on the two specific categories of expenditures: the dependent variables are the (log of) the per capita aggregate expenditures in Local Authority i in year t on housing services and social services in (2), and on education in (3). These categories plausibly benefit different socio-demographic groups of the electorate, and our previous analyses showed stark differences in the electoral
30
participation of these groups as the internet diffuses. Specifically, expenditures on housing and social services target individuals with lower incomes (and, thus, less education) and, to a smaller extent, provide assistance to the elderly with special needs; expenditures on education, however, appear to target quite different demographic groups than expenditures on housing services and social services, as more-educated and higher-income individuals seem to invest proportionally more in the human capital of their children than less-educated and lower-income individuals do (Guryan, Hurst, and Kearney, 2008; Ramey and Ramey, 2010). The point-estimates of the coefficients of internet penetration in these regressions show that all expenditures are lower in LAs with greater broadband diffusion. Moreover, the pointestimates suggest that internet penetration has the largest effect on housing and social services, which target low-income voters—i.e., the demographic group that the diffusion of the internet affected the most with regard to electoral participation in our sample. At the same time, internet penetration had a smaller and non-statistically significant effect on expenditures on education, to which higher-income individuals arguably pay close attention to—i.e., the demographic group that the diffusion of the internet affected the least with regard to electoral participation in our sample. However, we should point that the standard errors of these estimates are quite large, and, thus, we cannot reject the hypothesis that the effect of Internet is identical across these two categories of expenditures. We further employ these OLS estimates as inputs to construct bounds in equation (2). For housing and social expenditures, they equal −9.601 if we consider the OLS regressions ˜ = 0.091, ˚ on LA-demeaned data (the values of the components are: β˜ = −0.336, R β = 0.098 ˚ and R = 0.049), and −0.357 if we consider the OLS regressions without demeaning the data ˜ = 0.967, ˚ from their LA-averages (the values of the components are: β˜ = −0.336, R β = 0.268 ˚ and R = 0.021); for expenditures on education, they equal −4.720 if we consider the OLS ˜ = 0.408, regressions on LA-demeaned data (the values of the components are: β˜ = −0.272, R ˚ ˚ = 0.337), and −0.286 if we consider the OLS regressions without demeaning β = 0.259 and R ˜ = 0.952, the data from their LA-averages (the values of the components are: β˜ = −0.272, R ˚ ˚ = 0.00003). Hence, these bounds seem to confirm that the effect of internet β = 0.007 and R penetration on education expenditures is lower than that on housing and social expenditures. Taxes. Column (4) in Table 6 report the OLS estimates of a regression in which the dependent variable is the log of the per capita tax requirements in Local Authority I in year t. The specification includes several demographic controls, as well as fixed effects for each LA to capture any unobserved factor specific to each LA. This regression provides a natural robustness check of the result on expenditures since, through LAs’ budget constraints, local taxation should move in the same direction as local expenditures. In addition, since the Council Tax establishes higher tax rates on more-valuable properties, by construction, a reduction in tax requirements implies that households that occupy these more-valuable properties, such as higher-income and older individuals (Banks, Oldfield, and Wakefield, 2002), pay less taxes. The results show that taxes are lower in LAs with greater broadband internet penetration, 31
consistent with the results on expenditures. Specifically, we argued that the OLS estimate of the coefficient of Internet in column (5) should be an upper bound of the causal effect of the diffusion of the internet on taxes; this estimate suggests that broadband internet diffusion caused a e−0.34 − 1 ≈ −0.29 percent decline in LAs’ per capita taxes. Moreover, the bound of equation (2) based on these OLS estimates equals −4.720 if we consider the OLS regressions ˜ = 0.253, ˚ on LA-demeaned data (the values of the components are: β˜ = −0.339, R β = 0.259 ˚ = 0.337), and −0.352 if we consider the OLS regressions without demeaning the data and R ˜ = 0.979, ˚ from their LA-averages (the values of the components are: β˜ = −0.339, R β = 0.235 ˚ = 0.031). Again, the LA-fixed effects account for the large differences between these and R two calculations of the bounds. Overall, these results on taxes further corroborate our previous findings that LAs’ policy choices seemed to favor the demographic groups—i.e., higher-income and older voters—whose electoral participation changed the least as the internet diffused; however these voters became relatively more important for electoral competition because the participation of other groups declined as the internet diffused.
5
Insights into the Mechanism: Internet and Local News
The goal of this section is to present evidence consistent with the idea that the internet crowded out traditional media—i.e., local newspapers—with greater coverage of local news. Moreover, we report some aggregate trends that suggest a decline of other traditional media and, most notably, a decline in news consumption on these other media (radio and television). We argue that it is unlikely that the decline in news consumption on traditional media has been fully compensated by an increase in online news consumption and, in particular, local news. Finally, we show that different demographic groups display stark differences in their news consumption as the internet diffuses: less-educated and younger individuals are less likely than more-educated and older individuals to use the internet to consume news.27
5.1
Substitution Away from Traditional Media
Newspapers. Newspapers are the media with a richer content about politics, and regional newspapers are the main source of information about local politics (Franklin and Murphy, 1991; Nielsen, 2015).28 While newspaper circulations had been declining for several years, the internet may have accelerated this decline—most notably, of local newspapers. Specifically, Ramsay and Moore (2016) report several striking facts about local newspapers and local news: “From 2005 to 2010 the revenue of the four leading local newspaper companies 27 These changes in media and news markets are not unique to the U.K., but the U.S. and several other countries display very similar patterns; see, among others, Anderson, Waldfogel, and Str¨omberg (2015). 28 Gentzkow, Shapiro, and Sinkinson (2011) study the effects of newspapers on U.S. presidential and congressional elections, and show, among other things, that newspapers had a positive effect on political participation.
32
1.5 2 2.5 Regional Newspapers
3
30 National Newspapers 15 20 25
.5
1
10 5 2001
2005 Year National Newspapers
2010 Regional Newspapers
Figure 4: Circulation of National (left scale) and Regional (right scale) Newspapers 2001-2010. in the UK dropped by between 23 per cent and 53 per cent, according to analysis by Enders Analysis for the Leveson Inquiry. This was partly as a consequence of a drop in print circulation, and partly due to the decline of advertising revenue. [...] The increase in digital revenue has not matched the decrease in revenues from print.” They further point out: “[T]he UK’s mainstream journalism corps has shrunk between a quarter and a third over the past decade (and 30-40 per cent on the 2001 estimates widely used by the industry).” Similarly, the Press Gazette 29 reported on December 19, 2016 that: 1) a net of 198 local newspapers closed down in the U.K. from 2005 to 2016; 2) the total number of journalists working on local newspapers is reckoned to have at least halved from 2005 to 2016; and 3) the industry’s revenue has also halved from 2005 to 2016. Hence, the Media Reform Coalition (2014) calculates that: “Out of 406 Local Government Areas, 100 (25%) have no daily local newspaper at all while in 143 LGAs (35% of the total) a single title has a 100% monopoly.” Figure 4 displays trends in national and regional newspaper circulations using aggregate ABC data. From 2001 to 2010, the number of daily copies sold by national newspapers declined by approximately 25 percent. The decline in regional newspapers was even more dramatic: from 2001 to 2011, the number of regional weekly newspapers declined by 35 percent, and the average number of weekly copies sold per (surviving) newspaper declined by 50 percent, leading to an overall decline of approximately 65 percent in total weekly copies.30 While these reports are striking, they are, perhaps, anecdotal. Thus, using the panel data on local newspaper circulations from the ABC that we described in Section 2, we investigate more formally whether internet penetration affected local newspapers. To this end, we merge 29
Available at http://www.pressgazette.co.uk/new-research-some-198-uk-local-newspapers-haveclosed-since-2005/. 30 The ABC reports data for daily and weekly regional newspapers. Since most local newspapers are weekly, we report on them, although the trends of daily newspapers are very similar to those of weekly ones.
33
these local-newspaper circulation data with our data on internet penetration, averaged over the corresponding circulation area and six-month period, as well as our weather instruments, also averaged correspondingly. We then use these data to estimate the coefficients of the following equation: ∆Log (Circulationias ) = βInternetas + γ i + η s + εias ,
(3)
where the dependent variable ∆ Log (Circulationias ) is the difference in the log of the circulation of local newspaper i in area a between time (semi-year) s and time s − 1; the independent variable Internetas measures household broadband penetration in area a and time s; γ i are fixed effects for newspaper i; η s are time fixed effects; and εias are residuals. We use ∆ Log (Circulationias ), rather than Log (Circulationias ), as our dependent variable since it allows us to better control for the long-run aggregate decline in newspaper circulation. Moreover, the inclusion of newspaper fixed effects in equation (3) implies that we are identifying the effect of broadband penetration exclusively exploiting within-newspaper variations in the rate of change of its circulation as the internet diffuses in its circulation area. Table 7 reports the coefficient estimates of several specifications. Specification (1) is an OLS regression that treats Internet as exogenous. It indicates that Internet and newspaper circulation are negatively correlated. While the inclusion of newspaper fixed effects should capture persistent local unobservables, the concern is that broadband penetration may still be correlated with unobserved time-varying variables that affect newspaper circulation. Most notably, as we argued in Section 3, internet adoption is positively correlated with observable demographic characteristics, such as income and education, and these demographic characteristics also drive newspaper circulation. Since our specification does not control for all the determinants of the demand for broadband internet, some unobservable demographic characteristics may confound the interpretation of OLS estimates in column (1). Nevertheless, since unobserved demographic characteristics that increase newspaper circulation are likely to be positively correlated with internet penetration, the OLS estimate of the coefficient of Internet is likely to be biased upward and, thus, to be an upper bound of the causal effect of the diffusion of the internet on newspaper circulation. This upper bound being negative, it suggests that broadband penetration caused a decline in local-newspaper circulation. However, its standard error does not allow us to statistically reject the null hypothesis of no effect. Specifications (2)-(9) are instrumental-variable regressions that treat Internet as endogenous and use our weather variables as instruments: even-numbered columns report the first-stage regressions and odd-numbered columns report the second-stage regressions. Specifications (2)-(3) employ data on all local newspapers; specifications (4)-(5) employ data on local weekly newspapers; specifications (6)-(7) employ data on local daily newspapers; and specifications (8)-(9) employ data on local newspapers in England, for which we use data on local elections and local government policies in Sections 3 and 4, respectively. The first-stage regressions show that the excluded instruments based on rainfall have a negative effect on
34
35 0.172 10604
0.01 (0.01) -0.00*** (0.00) Yes
-0.03 (0.12) 1.45 (1.74) -3.31*** (1.02) 0.08*** (0.00) -0.00*** (0.00) Yes 7.200 0.989 10604 0.042 10604
0.18*** (0.04) -0.01*** (0.00) Yes
-2.35*** (0.53)
0.989 8878
1.51 (1.77) -3.56*** (1.04) 0.08*** (0.00) -0.00*** (0.00) Yes 0.20*** (0.04) -0.01*** (0.00) Yes 7.824 0.048 8878
-2.48*** (0.55)
0.983 1726
0.69 (2.22) -1.57 (1.15) 0.07*** (0.00) -0.00*** (0.00) Yes
0.12 (0.08) -0.01* (0.00) Yes 1.659 0.165 1726
-1.70 (1.21)
0.987 8902
2.12 (1.79) -3.77*** (1.09) 0.08*** (0.00) -0.00*** (0.00) Yes
0.19*** (0.04) -0.01*** (0.00) Yes 6.444 0.031 8902
-2.37*** (0.56)
correlations in the residuals, following the procedure in Conley (1999). *, ** and *** denote significance at the 10, 5 and 1 percent level, respectively.
and internet penetration in area a at time (semi-year) s in even-numbered columns. Rain and Max Rain are in m/m2 . The standard errors in parentheses allow for spatial
Notes: The dependent variable is: the difference in the log of circulation of local newspaper i in area a between time (semi-year) s and time s − 1 in odd-numbered columns;
Newspaper dummy F-test R2 Observations
Time2
Time
Max Rain
Rain2
Internet
All All Weekly Daily England newspapers newspapers newspapers newspapers newspapers OLS IV 1st IV 2nd IV 1st IV 2nd IV 1st IV2nd IV 1st IV2nd Dependent variable: ∆ Log(Circ) Internet ∆ Log(Circ) Internet ∆ Log(Circ) Internet ∆ Log(Circ) Internet ∆ Log(Circ) (1) (2) (3) (4) (5) (6) (7) (8) (9)
Table 7: Internet Diffusion and Local Newspapers
broadband diffusion even at the area level, although the aggregation of rainfall to newspaper circulation areas weakens the power of the first stage, as expected, and the values of the F -tests are below 10. The comparison between the OLS and the second-stage IV estimates of specifications (1) and (3), respectively, show that the magnitude of the coefficient of Internet is greater in the IV estimates that exploit the variation in internet penetration due to supply-side factors exclusively, thereby confirming that unobserved demographic characteristics that increase newspaper circulation are positively correlated with internet diffusion. Overall, the IV estimates of specification (3) indicate that broadband internet caused a large, significant decline in newspaper circulation: a one-percentage-point increase in Internet (which is broadly the order of magnitude that the within-area variation in Rain implies) decreased the rate of change in newspaper circulation by 2.35 percentage points. Since the average of ∆ Log (Circulationias ) equals −2.6 percentage points in our sample, specification (2) implies a large substitution effect away from local newspapers. Specifications (4)-(7) seem to suggest that this substitution affected weekly local newspapers more than daily local newspapers. However, the small sample size of daily newspapers makes the first-stage regression weak, and, thus, we do not have reliable estimates of the effect of the internet on daily newspaper circulation. Finally, specification (9) indicates that the effect of internet diffusion on local newspapers in England—where our turnout data (used in Section 3), as well as our expenditure and tax data (used in Section 4), are from—is identical to the overall effect in the entire U.K. Other Traditional Media: TV and Radio. Of course, the diffusion of broadband internet affected other traditional media with news content, such as television and radio. While do not have cross-sectional data on these other media, we briefly present some aggregate trends that indicate a broad decline in news consumption—including local news consumption—from these other media. The U.K. television market has traditionally been a single market dominated by five national public-service channels (BBC1, BBC2, ITV, Channel 4, and Channel 5) and several subscription-based channels (e.g., Sky). Local stations played almost no role; only after 2012 (after the period of our election data) did the government announce a plan to set up a network of local television stations, similar to the U.S. network-affiliate model.31 Therefore, during our study period, TV stations provided mainly national or regional news and played a minor role in most local elections, especially in those of small LAs. Generally, there was a steady per capita consumption of TV of about four hours per day in the decade 2001-2010 (although more-recent data show that TV viewership started to decline in 2011). Net advertising revenues were also constant over the same period. However, the time devoted to news on the five 31 Ofcom awarded licenses to operate local TV “multiplex” on digital terrestrial TV in 2013. The first station (London Live) was launched in April 2104, but it immediately applied to the media regulator to reduce the amount of local programming it had to produce according to its license condition, as it received zero audience ratings for some of its shows with local content. In general, there has been widespread skepticism within the media industry about the commercial viability of this new generation of local TV stations.
36
public-service channels decreased from a total of 3,299 hours in 2004 to 2,679 hours in 2011—a 20-percent decline. Meanwhile, subscription channels gained market share by expanding the availability of sports programming, television series, and “reality shows.”32 Radio traditionally enjoys a large number of listeners in the U.K., with the BBC operating the most prominent national stations. A few national commercial stations operate, but most commercial stations broadcast locally, within a radius of 20-50 miles. Some large radio groups own several local radio stations. Ofcom, using data collected by Radio Joint Audience Research (the official body in charge of measuring radio audiences in the U.K.), reports that BBC radio national/local, the biggest supplier of news, experienced a 10.8-percent decline in listeners over the period 2007-2011, mainly due to the decline among young listeners. Commercial radio revenue per listener decreased by almost 20 percent, from £16.59 per listener in 2006 to £13.55 per listener in 2011, implying that fewer resources have become available for news production (these figures exclude the license fee to the BBC). Finally, local radio news could also come from so-called community radio, which refers to a system of licensing small, local, non-profit radio stations. Community radio typically receives funding through grants, donor income, the National Lottery or charities, but these funds declined steadily, by over 25 percent, in the period 2008-2011.
5.2
Internet Use and News Consumption
The diffusion of broadband internet, as well as the massive expansion of online content, has greatly increased internet consumption. Ofcom (2015) reports that the average weekly hours of internet use among all adults increased from 9.9 hours in 2005 to 14.2 hours in 2010 (20.5 hours in 2015). This growth has been mostly due to increased use at home, which rose from 6.6 hours in 2005 to 9.4 hours in 2010. How do people use the internet? Oxford Internet Surveys, which collect information about internet use and attitudes in Britain, suggest that a large fraction of the U.K. population do not use to internet to consume news and, more specifically, political information.33 More precisely, the 2007 survey (Dutton and Helsper, 2007), at the mid-point of our data, reports that almost everyone used the internet to communicate—93 percent of internet users reported using email—and many used it for leisure and entertainment—54 percent reported downloading music, and 48 percent reported playing games. Interesting for our purposes, fewer individuals used it to access news—28 percent of internet users reported reading a newspaper online—and only 11 percent of users reported using the internet to look for information about an MP, local councillor, or politician. 32 All the data about TV, as well as those about radio that we discuss next, are available at http:// stakeholders.ofcom.org.uk/binaries/research/cmr/cmr12/UK 3.pdf. 33 The Opinions and Lifestyle Survey, administered by the Office of National Statistics, is another source that investigates internet access and use. It displays patterns about internet use across demographic groups very similar to those reported in the Oxford Internet Surveys.
37
20 0
% Reading about Politicians 10
25 % Reading about Politicians 15 5
Secondary
Sixth Form and Technical Educational Attainment
University
20
30
40
50
60
70
Age
Figure 5: Fraction of internet users reading about politicians, by educational attainment (left panel) and age groups (right panel).
The survey further collects individual demographic characteristics that are useful for understanding the heterogeneity of uses across different demographic groups. The left panel of Figure 5 plots the fraction of internet users who report using it to look for information about a member of parliament, local councillor, political party or candidate. Users are grouped according to their educational attainment, and the figure shows that individuals with a university degree are four times more likely than individuals with only secondary education to use the internet to access this information. Similarly, the right panel of Figure 5 plots the fraction of internet users, grouped by age, who report using it to look for information about a member of parliament, local councillor, political party or candidate, showing that younger individuals are less likely to access this information.
5.3
Summary
Overall, the evidence reported in this section describes some stark changes in media and local news consumption in the U.K. as the internet diffused. Several commentators assert that these rapid changes in media markets are endangering the quality and ‘local-ness’ of local news.34 Franklin (2010) and Hamer (2006) argue that the content of U.K. online local newspapers differs from that of offline ones and, in particular, that many online local newspapers have poor coverage of local politics. Ramsay and Moore (2016) contend that “the shift to digital at certain large publishers has been accompanied by a drive for audiences, at the cost of public interest news.” Williams, Harte, and Turner (2015) and Ramsay and Moore (2016) further report that local newspapers have not been fully replaced by local news sites; for example, Ramsay and Moore (2016) warn that: “[t]here are still less than half as many hyperlocals as 34
Cag´e (2014) and Angelucci and Cag´e (2017) show that French newspapers decreased the size of their newsrooms and, thus, the quality of information provided to their readers as a response to an increase in the competition that they face.
38
local newspapers—550 as compared to 1,112 local newspapers. For the most part they cover a much smaller catchment area than a local newspaper [,...] their reach and impact remains limited, and the extent of their sustainability is unclear.” As a result of all these trends, The Guardian 35 warned on April 23, 2015: “There are now areas of the UK where there is virtually no professional news reporting at all.” Moore (2014) further laments: “Local Councils now regularly go unattended and unreported.” While we acknowledge that this evidence does not allow us to precisely quantify how much the decline in voters’ information accounted for the decline in their political participation during our study period, it does suggest that the decline in information may have contributed to the empirical findings in Sections 3 and 4.
6
Conclusions
Understanding political participation and election outcomes is a major research area in the social sciences. For example, voter turnout is considered fundamental to sustaining the legitimacy of the democratic process (Lijphart, 1997). In turn, election outcomes form the basis for the design of public policy. In this paper, we investigate how the diffusion of the internet affects voters’ information, thereby shaping both election outcomes and public policies. We exploit the dramatic growth of the internet in the U.K. through a uniquely rich dataset that reports the total number of local broadband subscribers in each node of British Telecom’s local distribution network. Using complementary identification strategies, our data paint a picture consistent with the ideas that internet penetration decreases voter turnout, most notably among less-educated and younger individuals; in turn, local-government expenditures (and taxes) are lower in areas with greater broadband penetration—more so those targeted at less-educated voters and less so those targeted at more-educated individuals. Overall, our findings highlight the effects of the media on electoral politics. They suggest that internet penetration has displaced media that have a richer political content (i.e., radio and newspapers). Our findings also buttress the idea that voters’ information plays a key role in determining electoral participation, government policies and government size. In our view, these results lead to at least two observations. First, several countries have enacted policies to decrease the “digital divide” by subsidizing the supply and/or the demand of internet broadband, with the goal of decreasing economic and social inequality between different demographic groups. However, our results suggest that the use of these technologies varies dramatically across demographic groups, and they point to some potentially unintended consequences of such policies, such as increasing the “political divide” between groups. Second, many countries have recently increased the devolution of powers towards local governments. Our results show that participation in local elections has dramatically declined in recent years, 35
Available at https://www.theguardian.com/society/2015/apr/23/unreported-britain-withoutlocal-newspapers-who-is-keeping-tabs.
39
in part as the internet has displaced other media that provide greater local news content, thus questioning the accountability of these decentralized governments. Finally, we hope that future research will address the limitations of this paper. First, our analysis is descriptive, and we are unable to make statements about the overall welfare effects of our results. Second, while we believe that the main mechanisms underlying our findings—i.e., the substitution of the internet for traditional media—is quite general, we focus on local elections in one country only and during a short period of time, calling into question the external and long-run validity of our results and of their magnitudes. Third, our analysis of the effects of internet penetration on policy choices faces several empirical challenges, and, thus, we view our suggestive findings as a first step, hoping that they spur further investigation into these issues.
References Adam, S., C. Emmerson, and A. Kenley (2007): “A Survey of UK Local Government Finance,” Discussion Paper 74, The Institute for Fiscal Studies. Altonji, J. G., T. E. Elder, and C. R. Taber (2005): “Selection on Observed and Unobserved Variables: Assessing the Effectiveness of Catholic Schools,” Journal of Political Economy, 113(1), 151–184. ¨ mberg (eds.) (2015): Handbook of Media Anderson, S., J. Waldfogel, and D. Stro Economics, vol. 1A. Elsevier, Amsterdam. ´ (2017): “Newspapers in Times of Low Advertising Revenues,” Angelucci, C., and J. Cage Discussion Paper 11414, Centre for Economic Policy Research. Angrist, J. D., and J.-S. Pischke (2008): Mostly Harmless Econometrics: An Empiricist’s Companion. Princeton University Press. Banks, J., Z. Oldfield, and M. J. Wakefield (2002): “The Distribution of Financial Wealth in the UK: Evidence from 2000 BHPS Data,” Discussion paper, Institute for Fiscal Studies. Besley, T., and R. Burgess (2002): “The Political Economy of Government Responsiveness: Theory and Evidence from India,” The Quarterly Journal of Economics, 117(4), 1415–1451. Besley, T., and A. Prat (2006): “Handcuffs for the Grabbing Hand? Media Capture and Government Accountability,” American Economic Review, 96(3), 720–736. Besley, T., and I. Preston (2007): “Electoral Bias and Policy Choice: Theory and Evidence,” The Quarterly Journal of Economics, 122(4), 1473–1510. 40
Bouckaert, J., T. van Dijk, and F. Verboven (2010): “Access Regulation, Competition, and Broadband Penetration: An International Study,” Telecommunications Policy, 34(11), 661–671. Burton, A., V. Glenis, M. Jones, and C. Kilsby (2013): “Models of Daily Rainfall Cross-Correlation for the United Kingdom,” Environmental Modelling & Software, 49, 22– 33. ´, J. (2014): “Media Competition, Information Provision and Political Participation,” Cage Mimeo, Harvard University. Campante, F. R., R. Durante, and F. Sobbrio (Forthcoming): “Politics 2.0: The Multifaceted Effect of Broadband Internet on Political Participation,” Journal of the European Economic Association. Conley, T. G. (1999): “GMM Estimation with Cross Sectional Dependence,” Journal of Econometrics, 92(1), 1–45. ˇ M. Randic ´, and G. Krc ˇelic ´ (2016): “A Multivariate Approach to PredictDeljac, Z., ing Quantity of Failures in Broadband Networks Based on a Recurrent Neural Network,” Journal of Network and Systems Management, 24(1), 189–221. DellaVigna, S., and E. Kaplan (2007): “The Fox News Effect: Media Bias and Voting,” The Quarterly Journal of Economics, 122(3), 1187–1234. Deloitte (2013): “Openreach Fault Data: Data Analysis,” Technical report. Drago, F., T. Nannicini, and F. Sobbrio (2014): “Meet the Press: How Voters and Politicians Respond to Newspaper Entry and Exit,” American Economic Journal: Applied Economics, 6(3), 159–88. Durante, R., P. Pinotti, and A. Tesei (2015): “The Political Legacy of Entertainment TV,” Discussion Paper 10738, Centre for Economic Policy Research. Dutton, W. H., and E. J. Helsper (2007): The Internet in Britain: 2007. Oxford Internet Institute, University of Oxford. Enikolopov, R., M. Petrova, and E. Zhuravskaya (2011): “Media and Political Persuasion: Evidence from Russia,” American Economic Review, 101(7), 3253–85. Falck, O., R. Gold, and S. Heblich (2014): “E-Lections: Voting Behavior and the Internet,” American Economic Review, 104(7), 2238–65. Fan, Y. (2013): “Ownership Consolidation and Product Characteristics: A Study of the US Daily Newspaper Market,” American Economic Review, 103(5), 1598–1628. 41
Ferraz, C., and F. Finan (2008): “Exposing Corrupt Politicians: The Effects of Brazil’s Publicly Released Audits on Electoral Outcomes,” The Quarterly Journal of Economics, 123(2), 703–745. Franklin, B. (2010): “Sources, Credibility and the Continuing Crisis of UK Journalism,” in Journalists, Sources, and Credibility: New Perspectives, ed. by B. Franklin, and M. Carlson, p. 90. Taylor & Francis. Franklin, B., and D. Murphy (1991): What News?: The Market, Politics and the Local Press. Routledge. Fujiwara, T., K. Meng, and T. Vogl (2016): “Habit Formation in Voting: Evidence from Rainy Elections,” American Economic Journal: Applied Economics, 8(4), 160–188. Fukuchi, H. (1988): “Correlation Properties of Rainfall Rates in the United Kingdom,” Microwaves, Antennas and Propagation, IEE Proceedings H, 135(2), 83–88. Gavazza, A., and A. Lizzeri (2009): “Transparency and Economic Policy,” The Review of Economic Studies, 76(3), 1023–1048. (2011): “Transparency and Manipulation of Public Accounts,” Journal of Public Economic Theory, 13(3), 327–349. Gentzkow, M. (2006): “Television and Voter Turnout,” The Quarterly Journal of Economics, 121(3), 931–972. Gentzkow, M., J. M. Shapiro, and M. Sinkinson (2011): “The Effect of Newspaper Entry and Exit on Electoral Politics,” American Economic Review, 101(7), 2980–3018. Gomez, B. T., T. G. Hansford, and G. A. Krause (2007): “The Republicans Should Pray for Rain: Weather, Turnout, and Voting in U.S. Presidential Elections,” Journal of Politics, 69(3), 649–663. Guryan, J., E. Hurst, and M. Kearney (2008): “Parental Education and Parental Time with Children,” The Journal of Economic Perspectives, 22(3), 23–46. Hamer, M. (2006): “Trading on trust: news agencies, local journalism and local media,” in Local Journalism and Local Media: Making the Local News, ed. by B. Franklin, pp. 210–218. Routledge. Heckman, J. J. (1979): “Sample Selection Bias as a Specification Error,” Econometrica, 47(1), 153. Larcinese, V. (2007): “Does Political Knowledge Increase Turnout? Evidence from the 1997 British General Election,” Public Choice, 131(3-4), 387–411. 42
Lijphart, A. (1997): “Unequal Participation: Democracy’s Unresolved Dilemma,” American Political Science Review, 91(1), 1–14. Lind, J. (2015): “Rainy Day Politics: An Instrumental Variables Approach to the Effect of Parties on Political Outcomes,” Discussion paper, University of Oslo. Lindbeck, A., and J. W. Weibull (1987): “Balanced-Budget Redistribution as the Outcome of Political Competition,” Public Choice, 52(3), 273–297. Lizzeri, A., and N. Persico (2004): “Why Did the Elites Extend the Suffrage? Democracy and the Scope of Government, With an Application to Britain’s ‘Age of Reform’,” The Quarterly Journal of Economics, 119(2), 707–765. Lockwood, B., and F. Porcelli (2013): “Incentive Schemes for Local Government: Theory and Evidence from Comprehensive Performance Assessment in England,” American Economic Journal: Economic Policy, 5(3), 254–86. Lott, J. R. (1999): “How Dramatically Did Women’s Suffrage Change the Size and Scope of Government?,” Journal of Political Economy, 107(6), 1163–1198. Media Reform Coalition (2014): “The elephant in the room: a survey of media ownership and plurality in the United Kingdom,” Technical report. Miner, L. (2015): “The Unintended Consequences of Internet Diffusion: Evidence from Malaysia,” Journal of Public Economics, 132, 66–78. Moore, M. (2014): “Addressing the Democratic Deficit in Local News through Positive Plurality,” Technical report, Media Standards Trust. Nardotto, M., T. Valletti, and F. Verboven (2015): “Unbundling the Incumbent: Evidence from UK Broadband,” Journal of European Economic Association, 13(2), 330– 362. Nielsen, R. K. (2015): Local journalism: The decline of newspapers and the rise of digital media. IB Tauris. Niskanen, W. A. (1974): Bureaucracy and Representative Government. Transaction Publishers. Nunn, N., and D. Puga (2012): “Ruggedness: The Blessing of Bad Geography in Africa,” Review of Economics and Statistics, 94(1), 20–36. Ofcom (2014): “Fixed access market reviews: wholesale local access, wholesale fixed analogue exchange lines, ISDN2 and ISDN30 (Annexes),” Technical report. (2015): “Adults’ media use and attitudes, Report 2015,” Technical report. 43
Oliver, J. E., S. E. Ha, and Z. Callen (2012): Local Elections and the Politics of Small-Scale Democracy. Princeton University Press. Openreach (2014): “Openreach response to Ofcom’s consultation document ‘Fixed access market reviews: Openreach quality of service and approach to setting LLU and WLR Charge Controls’,” Technical report. Oster, E. (Forthcoming): “Unobservable Selection and Coefficient Stability: Theory and Validation,” Journal of Business Economics and Statistics. ¨ mberg (2005): “Commercial Television and Voter Information,” Prat, A., and D. Stro Discussion Paper 4989, Centre for Economic Policy Research. Prior, M. (2007): Post-Broadcast Democracy: How Media Choice Increases Inequality in Political Involvement and Polarizes Elections. Cambridge University Press. Putnam, R. D. (2000): Bowling Alone: The Collapse and Revival of American Community. Simon & Schuster, New York. Ramey, G., and V. Ramey (2010): “The Rug Rat Race,” Brookings Papers on Economic Activity, 41(1), 129–199. Ramsay, G., and M. Moore (2016): “Monopolising Local News: Is There an Emerging Local Democratic Deficit in the UK due to the Decline of Local Newspapers?,” Report for the Centre for the Study of Media, Communication and Power, King’s College London. Schulman, A., and N. Spring (2011): “Pingin’in the Rain,” in Proceedings of the 2011 ACM SIGCOMM conference on Internet measurement conference, pp. 19–28. ACM. Semykina, A., and J. M. Wooldridge (2010): “Estimating Panel Data Models in the Presence of Endogeneity and Selection,” Journal of Econometrics, 157(2), 375–380. ¨ mberg (2010): “Press Coverage and Political Accountability,” Snyder, J. M., and D. Stro Journal of Political Economy, 118(2), 355–408. Sondheimer, R. M., and D. P. Green (2010): “Using Experiments to Estimate the Effects of Education on Voter Turnout,” American Journal of Political Science, 54(1), 174–189. ¨ mberg, D. (2004a): “Mass Media Competition, Political Competition, and Public PolStro icy,” The Review of Economic Studies, 71(1), 265–284. (2004b): “Radio’s Impact on Public Spending,” The Quarterly Journal of Economics, 119(1), 189–221. Sunstein, C. R. (2007): Republic.com 2.0. Princeton University Press.
44
Williams, A., D. Harte, and J. Turner (2015): “Filling the news hole? UK community news and the crisis in local journalism,” in Local Journalism. The Decline of Newspapers and the Rise of Digital Media, ed. by R. K. Nielsen, pp. 203–223. IB Tauris. Wolfinger, R., and S. Rosenstone (1980): Who Votes? Yale University Press.
45
APPENDIXES A
Local Elections and Local Authorities in England
This Appendix briefly describes the organization of English local governments. The organization and functions of local government vary among England, Scotland, Wales and Northern Ireland. Since our electoral data cover only English wards, we focus on England. England is subdivided into nine regions, all of which have limited administrative roles, with the notable exception of London, which has an elected Assembly and Mayor. Below the regional level and excluding London, England has two different types of local government: unitary and two-tier authorities. London and other metropolitan areas have unitary LAs, and most rural areas have two-tier LAs. This distinction persists for historic reasons, and the most recent administrative reorganizations consolidated several two-tier LAs into unitary ones. In two-tier LAs, district councils (lower tier) deal with public housing, local planning and development applications, leisure and recreation facilities, waste collection, environmental health, and revenue collection; county councils (upper tier) deal with education, strategic planning, transport, highways, fire services, social services, public libraries, and waste disposal. Unitary LAs deal with all of these functions together. As of 2014, there were 353 councils: 27 county councils (upper tier); 201 non-metropolitan district councils (lower tier); 32 London boroughs (unitary); 36 metropolitan boroughs (unitary); 55 unitary authorities (unitary); and 2 sui generis authorities, the City of London Corporation and the Isles of Scilly (unitary). The council is the governing body of each LA. The size of the council varies, mainly according to population: it has an average of 49 seats and a standard deviation of 12 seats. Councils are divided into wards (on average, 23 wards per council), which are the primary unit of the electoral system; as of 2014, there were 7,707 wards in England. An independent commission determines wards’ boundaries, adjusting them to account for changes in population, with the goal of keeping the number of eligible voters in each ward approximately constant. Each ward holds first-past-the-post elections, returning between one and three members to the local council. Finally, unitary and two-tier LAs differ in their electoral cycles. London boroughs and county councils elect all their members in a single election every four years, whereas metropolitan districts elect a third of their members on a rotating basis in each of three out of four years. Non-metropolitan district councils can choose either system. Adam, Emmerson, and Kenley (2007) describe the financing of LAs and report total LA income in England, by source, for 2005-06: Council Tax raised 25 percent of LA income, while grants from the central government accounted for approximately 75 percent of LA income. The Council Tax, which is based on residential property, is of great importance for local politics, as it is highly visible to residents. Government grants are either block grants or ringfenced grants, in approximately equal share. Adam, Emmerson, and Kenley (2007) explain that: “ [a] block grant from Whitehall (or the relevant devolved administration) is not ringfenced for any specific service area but may be spent as the local authority chooses. Central 46
government determines how much block grant to pay to local authorities in such a way that if every local authority spent at the level judged appropriate by central government, council tax rates for properties in a given band [...] would be uniform within England, Scotland and Wales. Similar arrangements apply in Northern Ireland.” Moreover: “Central government also pays ‘specific grants’ to local authorities, which are formally ring-fenced for a specific service. Local authorities can choose to top up spending in these areas from their general resources, but cannot spend less.[...] The areas to which specific grants are allocated include education and police, and within these categories the service to which the grant is allocated—for example, teachers’ pay reform or nursery education—is specified.” Finally, LAs are required by law to have a balanced budget: they cannot borrow to finance current spending, but they can do so to finance capital investments.36
B
U.K. Broadband Market
As in most countries, several different technologies allow households to access the internet in the U.K. From 2000 to 2010, approximately 80 percent of the households with a broadband connection had it through the telephone network and approximately 20 percent through cable networks; fiber operators and mobile broadband operators were almost negligible, used by less than 0.1 percent of the total population. As we recount in Section 2, the U.K.’s telephone network comprises 5,587 LEs, which connect directly to houses. Each LE (sometimes called the “local loop”) aggregates local traffic and then connects to the network’s higher levels (e.g., the backbone) to ensure worldwide connectivity, typically through high-capacity fiber lines. BT was the monopoly provider of telephone services until 1984 and still maintains a dominant role in U.K. communication markets. While the basic topology of BT’s network was set up several decades ago, technology has proven extremely flexible. Until the end of the 1990s, the old copper technology provided low-speed connections via dial-up (i.e., a modem). Without having to change the cables in the local loop, the installation of special equipment in the LEs has allowed the provision of high-speed internet to households. A breakthrough occurred with a technology called ADSL, which uses a wider range of frequencies over the copper line, thus reaching higher speeds. The first major upgrade involved bringing the ADSL technology to each LE in early 2000 and took several years to complete. In the early 2000s, deregulation also opened the market to entrants by allowing them to provide broadband internet services over BT’s existing network. This process involved several steps. First, in 2005, Ofcom mandated that BT split into two separate wholesale entities, Openreach and BT wholesale, along with a retail unit. Openreach maintains the network, while BT wholesale leases broadband lines to entrants. Second, Ofcom required BT to upgrade all LEs to allow entrants to invest in local-loop unbundling (LLU hereafter) 36
Adam, Emmerson, and Kenley (2007) provide further useful details on U.K. local government finances.
47
technologies to supply internet services. This allowed entrants to install their equipment in the LEs, thereby improving the quality of their services. Third, Ofcom imposed a national wholesale access price for the lease of LLU lines and reduced it (by more than half) in 2004 and again in 2007.37 Entrants undertook limited LLU investments until early 2005, mainly because the wholesale access price for BT’s network was high. This caused a delay in LLU investments in the U.K. compared to other European countries, slowing down households’ internet adoption. The entry process took off around 2005, following the division of BT into Openreach and BT wholesale and the lower access prices regulated in 2004. Cable is the main technological alternative to the telephony network. The cable operator Virgin Media deployed its own cable network during the 1990s, primarily for the purpose of selling cable TV. Cable covers approximately 50 percent of U.K. households, mainly in urban areas. The cable network has not expanded since the 1990s, but it was quickly upgraded to support voice and broadband services. The broadband business of Virgin Media has never been subject to regulation. The regulator does not force Virgin to let entrants access its network (and Virgin has never done so). As Figure 1 shows, aggregate broadband penetration among U.K. households quickly expanded after 2003. At the end of 2009, BT had a retail market share of approximately 28 percent; Virgin Media (the cable operator) had a market share of approximately 22 percent; and the entrants (the main ones are Talk Talk, Sky, O2 and Orange), which supply their services via LLU, had the remaining 50 percent of the market. Of course, the diffusion of broadband internet was not uniform across the U.K., and several demand and supply factors determined different penetration rates across markets and over time. First, local entry of new providers is the main reason for the expansion of broadband internet. In order to recover LLU’s large investment, entrants first unbundled the larger and more profitable LE-markets and later expanded to cover a large share of the country.38 Second, the shape and the extension of the area covered by each LE is an important determinant of entrants’ costs, as the actual speed of a connection decays rapidly with the distance from the LE to the premises—i.e., it is very difficult to improve the speed of the internet connection of a home located more than two miles away from its own LE. Finally, rapid technological progress, along with entrants’ learning curves, decreased costs over time.
C
Additional Results
In this Appendix, we use two alternative identification strategies to that employed in Section 3, exploiting alternative instruments that borrow ideas from other papers in the literature: 37 This LLU investment allowed entrants to provide higher-quality services to consumers: Nardotto, Valletti, and Verboven (2015) show that the average download speed of LLU is 19.1-percent higher than BT’s speed. 38 The catchment areas of LEs are heterogeneous. Unbundled LEs are typically in urban areas and can cover 12,135 households, on average, with some LEs in bigger areas having over 50,000 households. LEs that have not been unbundled can reach only 1,243 households, on average. By the end of 2009, at least 86 percent of U.K. lines were in LEs that could be supplied by a new entrant.
48
Table C1: Internet Diffusion and Voter Turnout, Alternative Instruments
Dependent Variable:
IV 1st IV 2nd IV 1st IV 2nd Internet Log(Turnout) Internet Log(Turnout) (1) (2) (3) (4)
Internet Distance LE-Backbone Distance LE–Homes (Distance LE–Homes)2 (Distance LE–Backbone)2
-0.84*** ( 0.15) -0.13*** ( 0.02) 0.90* ( 0.48) -0.00* ( 0.00) 0.00*** ( 0.00)
Lines 10-15 Miles Cable Lines 10-15 Miles Lines 0-10 Miles Cable Lines 0-10 Miles Work Age High Socio-Economic Status White University Degree Employed Urban Population Density Year Fixed Effects LA Fixed Effects LA Fixed Effects × Time F-test R2 Observations
-1.25*** ( 0.22)
0.33*** ( 0.04) 0.16*** ( 0.04) 0.01 ( 0.01) 0.04 ( 0.03) 0.04** ( 0.02) 1.41*** ( 0.25) -0.00 ( 0.13) Yes Yes Yes 30.94 0.869 14149
-0.94*** ( 0.05) 0.55*** ( 0.05) -0.17*** ( 0.02) 0.56*** ( 0.03) -0.18*** ( 0.04) -4.67*** ( 0.28) -0.94*** ( 0.06) Yes Yes Yes 0.592 14149
0.05*** ( 0.01) -0.04*** ( 0.01) -0.03** ( 0.01) 0.04** ( 0.02) 0.34*** ( 0.04) 0.16*** ( 0.03) 0.00 ( 0.01) 0.04 ( 0.03) 0.06*** ( 0.02) 1.75*** ( 0.26) 0.02 ( 0.16) Yes Yes Yes 21.92 0.867 14149
-0.07*** ( 0.01) 0.10*** ( 0.02) -0.78*** ( 0.12) 0.62*** ( 0.08) -0.16*** ( 0.02) 0.56*** ( 0.03) -0.17*** ( 0.03) -4.30*** ( 0.35) -0.95*** ( 0.07) Yes Yes Yes 0.569 14149
Notes: The dependent variable is: the log of voter turnout in ward i in year t in columns (2) and (4); and internet penetration in ward i in year t in columns (1) and (3). All regressions further include the fraction of individuals living in urban areas; the average housing price; the Elevation of the ward; the Relative Elevation of the ward with respect to their surrounding areas; the number of telephone lines served by the LE; and an indicator variable for the incumbent belonging to a party other than Conservative, Labour or Liberal Democrats (the excluded category). Work Age, People Aged 65+, High Socio-Economic Status, White, University Degree, Employed and Married are fractions, rescaled to vary between 0 and 1. The standard errors in parentheses allow for spatial correlations in the residuals, following the procedure in Conley (1999). *, ** and *** denote significance at the 10, 5 and 1 percent level, respectively.
49
A) Falck, Gold, and Heblich (2014) exploit the fact that the capacity of the ADSL technology depends on the length of the copper wire between the LE and the house. Similarly, Campante, Durante, and Sobbrio (Forthcoming) argue that it is more expensive to deploy optical fiber connections between LEs that are farther away from the network backbone, thereby affecting the pattern of ADSL rollout across different areas. Hence, we use our data to calculate two distances as supply-side instruments: 1) the average distance between houses in a ward and their respective LE; and 2) the distance between the LE and the network backbone. In our main specification, we use these variables as controls, whereas we now employ them as excluded instruments. Column (1) in Table C1 reports IV estimates based on this identification strategy. The first-stage regression shows that instruments are relevant—most notably, the distance between the LE and the network backbone—and strong (i.e., the F -test is above 30). The second-stage estimate of the coefficient of Internet implies that a one-percentagepoint increase in internet penetration decreases turnout by e−0.84 − 1 ≈ −0.56 percent, which corresponds to a 0.24-percentage-point decline in turnout. Hence, the pointestimate using these alternative instruments is almost identical to that of column (2) of Table 2. B) Gentzkow (2006) studies the effect of TV introduction on voter turnout, exploiting the fact that individual television stations broadcast over a large area and, thus, reach several small counties when entering a larger city. Thus, sharing the idea that proximity to a large market is uncorrelated with unobserved shocks that affect turnout, demand characteristics of nearby markets are valid instruments for internet penetration, once we control for the same characteristics in a given market (see, also, Fan, 2013). More specifically, we calculate the number of telephone lines and of cable lines between ten and 15 miles from the LEs serving each electoral ward, and we use them as instruments, while controlling for the number of telephone and cable lines between zero and ten miles from the LEs. Column (2) in Table C1 reports IV estimates based on this identification strategy. The first-stage regression shows that instruments are relevant and not weak—i.e., the F test equals approximately 22. Moreover, the second-stage estimate of the coefficient of Internet, equal to −1.25, is larger to those obtained using other instruments.
50