IEEE TRANSACTIONS ON ROBOTICS, VOL. 26, NO. 1, PP. 160-165, FEBRUARY 2010
1
Influence of Vibration Modes and Human Operator on the Stability of Haptic Rendering I˜naki D´ıaz and Jorge Juan Gil Abstract—Developing stable controllers able to display virtual objects with high stiffness is a persistent challenge in the field of haptics. This paper addresses the effect of internal vibration modes and human operator on the maximum achievable virtual stiffness. An 11-parameter mechanical model is used to adequately characterize overall system dynamics. Experiments carried out on LHIfAM and PHANToM haptic interfaces demonstrate the importance of vibration modes to determine the critical stiffness when the user grasps the device. Index Terms—Haptics and haptic interfaces, stability, physical humanrobot interaction, vibration modes
I. I NTRODUCTION Haptic devices allow users to interact with a certain environment, either remote or virtual, through the sense of touch. With these mechanisms—unlike in conventional robotic systems—both the user and the device inhabit the same workspace. Therefore, stability must be guaranteed to ensure user safety and maintain proper haptic performance. Unfortunately, preserving haptic stability usually implies reducing the range of impedances achievable by the system. Hence, rigid virtual objects cannot be perceived as stiff as real ones, and the overall haptic performance is degraded. The critical stiffness of a haptic system depends on many factors, such as inherent interface dynamics, motor saturation, sensor resolution or time delay. Several studies [1]–[3], have analyzed how these phenomena affect the stability and passivity boundaries. However, the mathematical models used to analyze stability rarely consider the existence of internal vibration modes [4], [5]. This paper presents a theoretical and experimental approach that studies the influence of the first vibration mode of the haptic interface on the stability of haptic rendering. The first resonant mode of the system is often linked to the flexibility of the mechanical device itself, or to the cable transmission used in these types of devices. The current study also takes into account the influence of the human operator dynamics. Previous studies on impedance interactions [6], [7], based on rigid haptic models that do not include vibration modes, showed that the worst-case scenario occurs when the operator is not grasping the haptic device. However, this assumption cannot be generalized for the haptic schematic with a vibration mode. In this paper, a model of the human impedance is included and its influence on stability is evaluated using the LHIfAM [8] and PHANToM haptic interfaces. II. S YSTEM D ESCRIPTION AND STABILITY A NALYSIS A. System Model without Human Operator Fig. 1a illustrates a simplified model commonly used to analyze the stability of haptic systems [3], [7]. It has a mass m and a viscous damping b, and the model assumes that the mechanical device is perfectly rigid. Although the force exerted by the motor Fr and the net force exerted by the user Fu are introduced in different places, a single transfer function is defined for this model, which is X 1 G(s) = = . (1) Fr + F u ms2 + bs This work is supported by the Basque Government, project S-PE07TE02. I. D´ıaz and J. J. Gil are with the Applied Mechanics Department, CEIT, Paseo Manuel Lardiz´abal 15, E-20018 San Sebasti´an, Spain (phone: +34 943 212 800; fax: +34 943 213 076; e-mails: {idiaz,jjgil}@ceit.es) and the Control and Electronics Department, TECNUN, University of Navarra, Paseo Manuel Lardiz´abal 13, E-20018 San Sebasti´an, Spain. Digital Object Identifier 10.1109/TRO.2009.2037254
d
B
E
1 >
B
B`
Ed
K
Kd
K (a)
E1
B`
K1 (b)
Fig. 1. Mechanical schematic of a perfectly rigid haptic device (a), and a haptic device with a single vibration mode (b).
Fig. 1b shows a haptic system with a single vibration mode [9]. In this model, the interface is divided into two masses connected by a link: device mass m1 , pushed by the force of the motor, and device mass m2 , pushed by the user. The dynamic properties of their connection are characterized by a spring and a damper (kc and bc ). Depending on the nature of the vibration mode, the physical interpretation of m1 and m2 changes: mass m1 could be the rotor inertia if the link is modeling the transmission system (usually a steel cable), or an arbitrary mass if the vibration mode is due to the flexibility of the mechanism. This model is a two-input/two-output system and the relationship between output positions and input forces is �� � � � � G2 (s) Gc (s) Fu X2 = = Gf . (2) x= X1 Gc (s) G1 (s) Fr Three new transfer functions have been defined: � � 1 kc + b c s p1 (s) G= p2 (s) p(s) kc + bc s
(3)
where, p1 (s) = m1 s2 + (b1 + bc )s + kc , 2
p2 (s) = m2 s + (b2 + bc )s + kc , 2
p(s) = p1 (s)p2 (s) − (kc + bc s) .
(4) (5) (6)
Introducing an impedance interaction with the virtual environment, the device can be analyzed as a single-input/single-output system, as illustrated in Fig. 2. C(z) is the force model of the virtual contact (which usually includes a spring and a damper) and H(s) is the zeroorder-holder. T is the sampling period and td represents the delay in the loop (e.g., lag caused by amplifier circuitry). The sampled position of the motor is given by X1∗ =
Z[Gc (s)Fu (s)] . 1 + C(z)Z[H(s)G1 (s)e−td s ]
(7)
If the force model only has a virtual spring with stiffness K, stability of the system depends on the following characteristic equation: 1 + KZ[H(s)G1 (s)e−td s ] = 0,
(8)
and the critical stiffness is KCR = Gm{Z[H(s)G1 (s)e−td s ]},
(9)
where Gm{.} means gain margin of the transfer function within brackets. From (9) it follows that G1 (s) is the relevant transfer function for the stability of the system. B. System Model Including the Human Operator Human impedance models are usually characterized by a secondorder linear time-invariant system (mass-spring-damper) [10]–[13]. The model assumes that the human operator has a perfectly rigid grasp on the manipulator’s end-effector. This assumption may not be valid depending on the type of grasp or tension applied to it by
IEEE TRANSACTIONS ON ROBOTICS, VOL. 26, NO. 1, PP. 160-165, FEBRUARY 2010
,QWHUIDFH
B` B
±d
p
III. M ODEL PARAMETERS I DENTIFICATION
1
d
'HOD\
+ROGHU )RUFH�PRGHO
�±0QX
IwXD
gwFD
d~ x
Fig. 2. Haptic system with impedance interaction.
d B
1
>
Ed
K
Kd
E1
_
>X KX
K1
2
E_
8VHU
B_
K_ >_
Fig. 3. Mechanical schematic of the haptic system with a single vibration mode including user dynamics.
The physical parameters for G1 (s) and H1 (s) have been experimentally identified for two haptic interfaces, PHANToM and LHIfAM. Since these interfaces are significantly different in terms of workspace and overall physical properties, the influence of the user as well as the nature of the vibration modes may differ from one to another. Both devices are controlled by a dSPACE DS1104 board that reads encoder information, processes the control loop and outputs torque commands to the motor at 1 kHz. A system identification method based on frequency response has been used to determine both G1 (s) and H1 (s). This strategy has already been successfully used to develop a model of the human wrist [12] and hand [14], and a cable transmission [4]. This method yields an empirical transfer function estimate (ETFE), or experimental Bode plot [17], by taking the ratio of the discrete Fourier transform (DFT) of the system’s output response signal to the DFT of the input signal applied. A white noise signal is commonly used as input signal [18]. Model parameters are identified by fitting the ETFE to the theoretical transfer function with 11 independent variables by performing an automatic iterative curve fitting using least-squares method. A. Identification of PHANToM Model Parameters
the user. Some authors [14]–[16] present a human impedance model that adds an additional spring and damper to the mass-spring-damper model, resulting in a 5-parameter model for the user. This paper follows this last approach in order to obtain a better characterization of the influence of the human operator. Fig. 3 illustrates an 11-parameter model for the haptic system including user dynamics. The user has been modeled by a massspring-damper system (mh , kh and bh ) connected to the body of the device through a spring-damper link (ks and bs ). All these new parameters can change depending on user posture or the way he/she grasps the device. This new model is a two-input/three-output system. The relationship between output positions and input forces is as follows: ⎤ ⎡ ⎤ ⎡ Hh (s) Ha (s) � � Xh F (10) x = ⎣ X2 ⎦ = ⎣ Hs (s) Hc (s) ⎦ h = Hf . Fr X1 Ha (s) H1 (s) Five new transfer functions have been defined: ⎡ ⎤ q (s)q2 (s) − qc2 (s) qc (s)qs (s) 1 ⎣ 1 ⎦ qh (s)qc (s) q1 (s)qs (s) H= q(s) qh (s)q2 (s) − qs2 (s) qc (s)qs (s)
φ
device
(11) user active motor
where, qc (s) = bc s + kc ,
(12)
qs (s) = bs s + ks ,
(13)
q1 (s) = m1 s2 + b1 s + qc (s),
(14)
2
q2 (s) = m2 s + b2 s + qc (s) + qs (s),
(15)
qh (s) = mh s2 + bh s + kh + qs (s),
(16)
q(s) =
The first rotating axis of a PHANToM 1.0 haptic interface has been used for the experiments (angle φ in Fig. 4). Only the motor that actuates this axis is active. A thirty seconds long white noise signal is applied by the motor to excite the system over a wide range of frequencies, up to 200 Hz, and the resulting movement is measured by the encoder on the motor’s shaft. The experiment is performed with and without a user grasping the handle of the device. In the former case, the only instruction given to the subject is to maintain a constant, moderate grip force and to not resist the motion of the handle. Without any user, the device’s joints (except φ-axis) were mechanically locked to avoid undesired reconfigurations. As a result, the kinematic configuration of the device is always the same, as shown in Fig. 4: the tip of the handle is placed approximately at 12 cm from the rotating φ-axis.
qh (s)q2 (s)q1 (s)−qc2 (s)qh (s)−qs2 (s)q1 (s).
(17)
Following the same stability analysis of impedance rendering as described in Section II-A, in this case H1 (s) becomes the relevant transfer function for the stability of the system: KCR = Gm{Z[H(s)H1 (s)e−td s ]},
(18)
Therefore, once the different parameters of the system have been identified, it is possible to study the influence of the user and the vibration mode on the stability of haptic rendering by analyzing the transfer functions H1 (s) and G1 (s).
?
cable transmission
Fig. 4. User grasping a PHANToM 1.0 haptic interface.
The frequency responses of the system are presented in Fig. 5. The first vibration mode of the interface takes place at 62.5 Hz, which may correspond to the one detected in [19] at 60 Hz. If the user is grasping the device, at low frequencies the gain plot starts horizontal and the phase tends to 0◦ . This is an indicator that user’s dynamics includes a spring kh . That is, while G1 (s) is a type 1 system, H1 (s) is a type 0 system in which kh is the denominator’s constant term. The parameters obtained for G1 (s) and H1 (s) are presented in Table I. These parameters have been identified with respect to the
IEEE TRANSACTIONS ON ROBOTICS, VOL. 26, NO. 1, PP. 160-165, FEBRUARY 2010
40 Gain (dB)
20
TABLE I P HYSICAL PARAMETERS USING THE PHANT O M 1.0
Experiment without user Bode of Z [H(s)G 1 (s)e−td s ]
0 −20 −40 −60 0.7 1 −80
10
100
200
100
200
Phase (º)
−100 −120 −140 −160 −180 −200 0.7 1
10 Frequency (Hz)
0 Gain (dB)
−10 −20 −30 −40 −50
Phase (º)
−60 0.7 1 0
Experiment with user Bode of Z [H(s)H1 (s)e−td s ] 10
3
Parameter Device mass Device damping Device mass 1 Device damping 1 Connection damping Connection stiffness Device mass 2 Device damping 2 Link damping Link stiffness Human mass Human damping Human stiffness Time delay
Variable m b m1 b1 bc kc m2 b2 bs ks mh bh kh td
200
100
200
With user 0.81 gm2 0.057 Nms/rad 0.0084 Nms/rad 18.11 Nm/rad 0.95 gm2 0 Nms/rad 0.017 Nms/rad 52.73 Nm/rad 3.14 gm2 0.099 Nms/rad 1.42 Nm/rad 150 μs
The linear transmission provides a 1500 mm linear stroke and a resolution of 3.14 μm with a QuantumDevices D145 encoder. The cable transmission is driven by a commercial Maxon RE40 DC motor. The kinematic configuration of the device is as in Fig. 6, but with the device placed at the middle of the linear guide.
active motor 100
Without user 1.05 gm2 0.0085 Nms/rad 0.895 gm2 0.0085 Nms/rad 0.0057 Nms/rad 18.13 Nm/rad 0.155 gm2 0 Nms/rad 150 μs
device
x
−45 −90 −135 −180 −225 0.7 1
10 Frequency (Hz)
cable transmission
Fig. 5. Experimental (blue line) and theoretical (black line) Bode diagrams for the PHANToM without user (top) and with user (bottom).
user
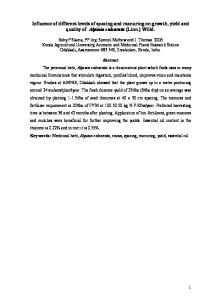
φ-axis. The equivalent translational parameters at the tip of the handle (along the x-axis in Fig. 4) can be calculated by dividing the rotational parameters by (12 cm)2 . The linear inertia m is 72.92 g, which is consistent with the manufacturer specifications: m < 75 g; and the linear damping b is 0.59 Ns/m. The linear human parameters are mh = 218.10 g, bh = 6.93 Ns/m and kh = 98.27 N/m. These values are similar to those proposed in [11], [12], [20]. The experiment was repeated with different users grasping the device. Although inter-subject variability for the user dynamics is known to be significant [12], [21], the experiments among subjects always yielded quite similar frequency responses. Notice that m1 and m2 change significantly with the user, and that none of them correspond to the inertia of the rotor, which is approximately 0.079 gm2 in φ axis (using the specifications of the Maxon™ motor). Thus, the first vibration mode of the PHANToM is a structural mode whose properties change if the user grasps the stylus. Although the rest of vibration modes have not been modeled (Fig. 5), the phase crossover frequency can be identified and the gain margin of the system can be correctly determined. B. Identification of LHIfAM Model Parameters The translational movement along the guide of the LHIfAM haptic interface [22] has been used as a second testbed (x-axis in Fig. 6).
Fig. 6. User grasping the LHIfAM haptic interface.
Fig. 7 shows the frequency responses of the system with and without user to a white noise force signal of thirty seconds long, and a frequency range up to 300 Hz, applied by the motor along the translational movement. Without any user, the device’s joints (except x-axis) were mechanically locked to avoid undesired reconfigurations. It can be seen that the first vibration mode takes place at 87 Hz, which corresponds to the cable transmission connecting the motor and the main body of the device [9]. The figure also shows another vibration mode at 110 Hz; however, the theoretical model only considers the first one. Table II summarizes the physical parameters obtained. Analyzing the parameters obtained with user, it can be seen that the previous inertia of the body of the device (5.20 kg) has been decoupled into m2 and mh . This fact suggests that the user’s influence possibly consists of exciting a new mechanical vibration mode of the device (new peak at 34 Hz), rather than adding any additional mass to the system. The system model depicted in Fig. 3
IEEE TRANSACTIONS ON ROBOTICS, VOL. 26, NO. 1, PP. 160-165, FEBRUARY 2010
4
−20
Gain (dB)
TABLE II P HYSICAL PARAMETERS USING THE LHIfAM
Experiment without user Bode of Z[H(s)G1(s)e−td s ]
−40 −60 −80 −100 −120
Phase ( )
−140 0.3 0 ◦
1
10
100
300
−90 −180 −270 0.3
Parameter Device mass 1 Device damping 1 Connection damping Connection stiffness Device mass 2 Device damping 2 Link damping Link stiffness Human mass Human damping Human stiffness Time delay
1
10 Frequency (Hz)
100
300
motor (m1, b1)
−20
With user 0.2 kg 0.1 Ns/m 13.41 Ns/m 61.36 kN/m 3.78 kg 4 Ns/m 62.68 Ns/m 56.03 kN/m 1.42 kg 18.34 Ns/m 133.48 N/m 200 μs
X2 device (m2, b2)
flexible joint (bc, kc)
flexible link (bs, ks)
Experiment with user Bode of Z[H(s)H1 (s)e−tds]
−40 Gain (dB)
Without user 0.19 kg 0.1 Ns/m 15 Ns/m 55.3 kN/m 5.20 kg 6.8 Ns/m 200 μs
X1
+ –
Variable m1 b1 bc kc m2 b2 bs ks mh bh kh td
human (mh, bh, kh)
−60
Xh
−80 Fig. 8. Physical model of the user grasping the LHIfAM.
−100 −120 0.3 0
1
10
100
300
haptic device. For this model, the critical virtual stiffness for haptic rendering [3] is:
Phase ( )
KCR = ◦
−90
−180
−270 0.3
1
10 Frequency (Hz)
100
300
Fig. 7. Experimental (blue line) and theoretical (black line) Bode diagrams for the LHIfAM haptic interface without user (top) and with user (bottom).
is still valid, but now the dynamics of the user and the device are mixed: mh contains part of the inertia of the device, and parameters ks and bs correspond to the new vibration mode excited by the user. Although ks and bs do not appear unless the user holds the device, they are mechanical properties of the mechanism (Fig. 8). When analyzing the shape of the LHIfAM haptic interface, which has quite long carbon-fiber links, the flexibility of these links may be excited if the user grasps the device. Therefore, the user and a part of the mass of the device can be modeled as moving together (Fig. 8). However, the existence of a stiffness kh can only be attributed to the user. This is consistent with [23], where it was suggested that when the device’s dynamics prevails over human arm dynamics, the user can be modeled as a linearized endpoint stiffness.
T 2
b , + td
(19)
which states that the critical stiffness of a haptic system is equal to the overall damping of the mentioned system divided by the total delay of the control loop. A more rigorous analysis can be performed by using the proposed models that include the influence of the first vibration mode and the user (Fig. 1b and Fig. 3). Table III shows the gain margins and the critical frequencies calculated for the PHANToM and LHIfAM, by applying (9) and (18) with the parameters that have been identified in the previous section. TABLE III G AIN MARGIN USING PHANToM’ S AND LHIfAM’ S ESTIMATED MODELS Device PHANToM LHIfAM
Model With user Without user With user Without user
Gm (dB) 40.90 22.41 86.80 87.01
ωCR (Hz) 63.52 17.67 102.86 8.73
Fig. 9 and Fig. 10 show these gain margins in the respective Bode diagrams. The rigid model has also been depicted for both devices. Comparing the Bode diagrams of the different models it is possible to understand the influence of the user and the vibration mode on the stability margin of the system. A. Influence of the Vibration Mode
IV. C RITICAL S TIFFNESS A NALYSIS Previous studies on impedance control [6], [7], based on the 2parameter rigid haptic model (Fig. 1a), showed that the worst-case scenario, stability-wise, occurs when the operator is not grasping the
Without the user grasping the PHANToM (Fig. 9), the gain margin of the model with one vibration mode GmA is 22.41 dB, which leads to a critical stiffness of 916.51 N/m along the x-axis. A similar value is estimated for the rigid model by using (19), KCR = 907.69 N/m,
IEEE TRANSACTIONS ON ROBOTICS, VOL. 26, NO. 1, PP. 160-165, FEBRUARY 2010
5
40
�W � ±
Gain (dB)
20 0
GmA
−20
5HOD\
+ROGHU
IwXD
GmB
,QWHUIDFH
Bd
tdwXD
d
x
−40
Fig. 11. Relay experiment scheme.
−60 0.7 1 0
10
100
200
10
Force (N) Position (mm)
Phase (º)
5 −90
0 −5
−180
ωA 10 Frequency (Hz)
0.7 1
ωB 100
200
−10
[t]
Fig. 9. Comparison of the gain margins for the PHANToM: rigid model of the device (blue line), device with one vibration mode (black line) and device with one mode and user (red line).
0 Gain (dB)
GmA
−50
GmB
−75
−100
Phase (º)
1
10
100
300
−90
ωA
−180 0.3
7.02
7.04 7.06 Time (s)
7.08
7.1
Fig. 12. Force input (blue line) and position output (black line) of a relay experiment with the LHIfAM.
B. Influence of the Human Operator
−25
−125 0.3 0
7
1
10 Frequency (Hz)
ωB 100
300
[t]
Fig. 10. Comparison of the gain margins for the LHIfAM: rigid model of the device (blue line), device with one vibration mode (black line) and device with one mode and user (red line).
because these two models are nearly identical at low frequencies, where the phase crossover frequency arises. Therefore, for the stability analysis without user, the vibration mode might not be taken into account. An analogous assertion could be made in the case of the LHIfAM (Fig. 10). However, the rigid model and the model with one vibration mode are identical for a narrower range of frequencies. The crossover frequency for GmA arises within this range, but possible modifications in the device could easily lead to a different behavior. In fact, previous work [9] already showed that the gain margin of the LHIfAM can jump to a higher frequency beyond the first vibration mode if the cable transmission pretension is changed. Thus, in the case of the LHIfAM, modeling the vibration mode could be necessary to analyze the stability properly.
Among other observable effects, the user substantially increases the phase of the Bode diagram at low frequencies. This fact moves the phase crossover frequency to a higher frequency, beyond the first vibration mode in both devices. But the resulting gain margin GmB is not predictable unless the vibration mode is correctly modeled. In the case of the PHANToM, the gain margin is much larger (almost double) than without user. However, for the LHIfAM, the first vibration mode is so pronounced that the gain margin is comparable to the one without user, and even a bit lower. Notice that, although the user is responsible for the phase crossover frequency change, the gain margin decrement is a consequence of the existence of the vibration modes rather than the presence of the user. In summary, for devices like the PHANToM, the worst-case scenario for stability analyses is the situation without a user grasping the device, as stated in previous works. However, for other devices like the LHIfAM, both the user and the vibration modes should be taken into account to determine their stability limits. V. E XPERIMENTAL C RITICAL S TIFFNESS Relay experiments have been carried out in order to assess that the gain margins of Table III match the real behavior of the systems. The relay experiment [7], [24], [25] allows to obtain the gain margin of the system without identifying all model parameters. It consists of a relay feedback—an on-off controller—that makes the system oscillate around a reference position (Fig. 11). In steady state, the force F1 is a square wave, the output position X1 is similar to a sinusoid wave, both in counter-phase (Fig. 12). It can be demonstrated [24] that the ultimate frequency ωCR is the oscillation frequency of both signals, and the ultimate gain is the quotient of the amplitudes of the first harmonic of F1 and X1 . The oscillation frequency is found by determining the maximum of the average power spectral density of both signals in steady state. The gain margin is obtained by evaluating the ETFE built using input-output signals at that frequency. This ultimate gain is the critical gain of this system. The relay experiment is performed for the first rotating axis of the PHANToM and the translational movement of the LHIfAM, with and without user grasping the end-effectors. Testbed description and
IEEE TRANSACTIONS ON ROBOTICS, VOL. 26, NO. 1, PP. 160-165, FEBRUARY 2010
TABLE IV G AIN MARGINS OF THE PHANToM AND LHIfAM Device
PHANToM 1 2 3 LHIfAM
1 2
Trial User 1 User 2 User 3 User 4 User 5 User 6 without user without user without user User 1 User 2 without user without user
Gm (dB) 40.60 40.86 41.35 38.93 42.64 37.96 18.46 16.33 15.21 82.5022 82.5189 86.7089 86.7204
ωCR (Hz) 57.61 57.61 57.61 52.73 62.98 51.26 16.60 14.64 14.16 87.4023 87.1582 9.0332 9.0332
kinematic configurations are the same as in previous section. Several trials are performed to obtain reliable conclusions. In each trial, inputoutput data values are measured for more than 15 seconds in steady state. During the experiments with users, they are asked to maintain a constant, moderate grip force and to not resist the motion of the handle. Table IV presents the oscillation frequencies and gain margins obtained in each trial. It can be seen that manipulating the PHANToM the users always increase the gain margin of the system. However, in the case of the LHIfAM, the results support theoretical conclusions, drawing attention to the negative influence of the first vibration mode on the stability boundary. Notice that gain margins obtained with users are lower than those obtained theoretically (Table III). This is due to the influence of a second vibration mode near the first one (Fig. 7 bottom), which is not considered in the 11-parameter model used to calculate the theoretical gain margin. VI. C ONCLUSIONS AND F UTURE W ORK This paper shows that, although real haptic systems present nonlinear behavior, several vibration modes, distributed masses, etc., mechanical linear models with concentrated parameters can successfully characterize them, with and without user, for a wide frequency range and predict the stability limits of haptic rendering. A haptic model with 11 parameters has been used to adequately characterize the dynamic behavior of the LHIfAM and the PHANToM haptic interfaces and human operator. Identification of such parameters allows understanding the influence of the first vibration mode and the user on the critical stiffness for haptic rendering. The analysis of the frequency response of the systems reveals that the user’s presence tends to stabilize the PHANToM in case of impedance interaction. However, the existence of a high resonant peak leads the LHIfAM to decrease its gain margin when the user is grasping the device. These results have been assessed by relay experiments and with different users grasping both interfaces. Further investigations will complete the stability analysis carried out in this paper by including user behavior uncertainties and device parameters variability for different kinematic configurations. Future work will also analyze under which conditions the compliant links can degrade stability margins in presence of the user in order to provide useful guidelines for the mechanical design of new haptic devices. R EFERENCES [1] J. J. Abbott and A. M. Okamura, “Effects of position quantization and sampling rate on virtual wall passivity,” IEEE Trans. Robot., vol. 21, no. 5, pp. 952–964, Oct. 2005.
6
[2] N. Diolaiti, G. Niemeyer, F. Barbagli, and J. K. Salisbury, “Stability of haptic rendering: Discretization, quantization, time-delay, and Coulomb effects,” IEEE Trans. Robot., vol. 22, no. 2, pp. 256–268, Apr. 2006. [3] J. J. Gil, E. S´anchez, T. Hulin, C. Preusche, and G. Hirzinger, “Stability boundary for haptic rendering: Influence of damping and delay,” in IEEE Int. Conf. Robot. Autom., Roma, Italy, Apr. 10-14 2007, pp. 124–129. [4] K. J. Kuchenbecker and G. Niemeyer, “Modeling induced master motion in force-reflecting teleoperation,” in IEEE Int. Conf. Robot. Autom., Barcelona, Spain, Apr. 2005, pp. 350–355. [5] J.-H. Ryu, C. Preusche, B. Hannaford, and G. Hirzinger, “Time domain passivity control with reference energy following,” IEEE Trans. Contr. Syst. Technol., vol. 13, no. 5, pp. 737–742, Sep. 2005. [6] R. J. Adams and B. Hannaford, “Stable haptic interaction with virtual environments,” IEEE Trans. Robot. Autom., vol. 15, no. 3, pp. 465–474, Jun. 1999. [7] J. J. Gil, A. Avello, A. Rubio, and J. Fl´orez, “Stability analysis of a 1 dof haptic interface using the Routh-Hurwitz criterion,” IEEE Trans. Contr. Syst. Technol., vol. 12, no. 4, pp. 583–588, Jul. 2004. [8] D. Borro, J. Savall, A. Amundarain, J. J. Gil, A. Garc´ıa-Alonso, and L. Matey, “A large haptic device for aircraft engine maintainability,” IEEE Comput. Grap. Appl., vol. 24, no. 6, pp. 70–74, Nov. 2004. [9] I. D´ıaz and J. J. Gil, “Influence of internal vibration modes on the stability of haptic rendering,” in IEEE Int. Conf. Robot. Autom., Pasadena, CA, USA, May 2008, pp. 2884–2889. [10] D. A. Lawrence, “Stability and transparency in bilateral teleoperation,” IEEE Trans. Robot. Autom., vol. 9, no. 5, pp. 624–637, Oct. 1993. [11] N. Hogan, “Controlling impedance at the man/machine interface,” in IEEE Int. Conf. Robot. Autom., vol. 3, Scottsdale, AZ, USA, May 1989, pp. 1626–1631. [12] K. J. Kuchenbecker, J. G. Park, and G. Niemeyer, “Characterizing the human wrist for improved haptic interaction,” in ASME Int. Mechan. Eng. Congress Expo., vol. 2, Nov. 16-21 2003. [13] F. Mobasser and K. Hashtrudi-Zaad, “A method for online estimation of human arm dynamics,” in 28th IEEE Engineering in Medicine and Biology Society Annual Int. Conf., New York City, NY, USA, 30 Aug. - 3 Sep. 2006, pp. 2412–2416. [14] J. E. Speich, L. Shao, and M. Goldfarb, “Modeling the human hand as it interacts with a telemanipulation system,” Mechatronics, vol. 15, pp. 1127–1142, 2005. [15] E. de Vlugt, A. C. Schouten, and F. C. van der Helm, “Closedloop multivariable system identification for the characterization of the dynamic arm compliance using continuous force disturbances: A model study,” J. Neurosci. Meth., vol. 122, pp. 123–140, 2003. [16] K. B. Fite, L. Shao, and M. Goldfarb, “Loop shaping for transparency and stability robustness in bilateral telemanipulation,” IEEE Trans. Robot. Autom., vol. 20, no. 3, pp. 620–624, Jun. 2004. [17] L. Ljung, System Identification: Theory for the User, 2nd ed. Upper Saddle River, NJ: Prentice-Hall, 1999. [18] D. W. Weir, J. E. Colgate, and M. A. Peshkin, “Measuring and increasing z-width with active electrical damping,” in 16th Int. Symp. Haptic Interfaces Virtual Environ., Teleoper. Syst., Reno, NV, USA, Mar. 13-14 2008, pp. 169–175. [19] M. C. C ¸ avuso˘glu, D. Feygin, and F. Tendick, “A critical study of the mechanical and electrical properties of the PHANToM haptic interface and improvements for high performance control,” Presence: Teleoper. Virtual Environ., vol. 11, no. 6, pp. 555–568, Dec. 2002. [20] C. R. Wagner and R. D. Howe, “Mechanisms of performance enhancement with force feedback,” in WorldHaptics Conf., Pisa, Italy, 18-20 Mar. 2005, pp. 21–29. [21] A. Z. Hajian and R. D. Howe, “Identification of the mechanical impedance at the human finger tip,” J. Biomech. Eng., vol. 119, no. 1, pp. 109–114, 1997. [22] J. Savall, J. Mart´ın, and A. Avello, “High-performance linear cable transmission,” J. Mech. Des., vol. 130, no. 6, p. 64501, Jun. 2008. [23] J. Podobnik and M. Munih, “Haptic interaction stability with respect to grasp force,” IEEE Trans. Syst. Man Cybern. C, vol. 37, no. 6, pp. 1214–1222, Nov. 2007. ˚ om and T. H¨agglund, PID Controllers: Theory, Design and [24] K. J. Astr¨ Tuning. Research Triangle Park, NC: Instrum. Soc. Amer., 1995. [25] L. Barb´e, B. Bayle, and M. de Mathelin, “Towards the autotuning of force-feedback teleoperators,” in 8th Int. IFAC Symposium on Robot Control, Bologna, Italy, Sep. 6-8 2006.